Abstract
Photovoltaic maximum power point tracking (MPPT) faces a trade-off between rapid dynamic response and accurate steady-state regulation. This study proposes a segmented MPPT framework that uses large-step perturb-and-observe (P&O) control for coarse tracking outside a normalized voltage range of 0.75Uoc-0.90Uoc and prediction-assisted fuzzy PID control for fine regulation within this range. The framework was evaluated through MATLAB/Simulink simulations, threshold-sensitivity and hysteresis analyses, partial-shading tests, and outdoor hardware experiments. Under irradiance and temperature variations, the proposed method reduced tracking time by up to 79.9 % and dynamic power overshoot by more than 98 %, while maintaining tracking errors below 0.18 %. Threshold-sensitivity analysis confirmed the 0.75/0.90 range as an effective operating interval, achieving 100 % relative tracking efficiency, while hysteresis reduced switching events by 70.27 %. Under partial-shading conditions, tracking efficiencies of 99.23 % and 98.80 % were achieved. Outdoor experiments further verified real-time mode switching and demonstrated improved energy harvesting. Overall, the proposed segmented control framework enhances both dynamic and steady-state MPPT performance with low computational complexity, making it suitable for embedded photovoltaic applications.
1. Introduction
Solar photovoltaic (PV) systems require maximum power point tracking controllers because their voltage-current and power-voltage characteristics vary nonlinearly with irradiance, temperature, loading, and shading conditions [1]-[4]. These systems have become an important renewable-energy technology due to their scalability, low operating emissions, and suitability for grid-connected and standalone applications. However, the nonlinear characteristics of PV arrays cause the maximum power point (MPP) to vary with irradiance, temperature, shading conditions, and load variations. Therefore, maximum power point tracking (MPPT) algorithms are essential for maximizing energy extraction from PV systems [1], [3], [4].
Conventional fixed-step P&O is widely used because of its simple implementation and relatively low computational requirement. However, its performance involves a trade-off between transient response and steady-state oscillation. A large perturbation accelerates movement toward the MPP but increases oscillation around the operating point, whereas a small perturbation improves steady-state accuracy but slows convergence [5]-[8]. Large perturbation steps provide faster convergence but increase oscillations around the MPP, whereas small steps improve accuracy at the expense of slower tracking [5], [6], [9]. Variable-step and adaptive P&O methods modify the perturbation magnitude according to the photovoltaic operating condition. These approaches have been developed to improve convergence under sudden irradiance changes while reducing oscillation near the MPP [9]-[14]. More recent studies have continued to investigate drift-free, adaptive, and modified P&O approaches for improving tracking under dynamic or partially shaded conditions [15]-[19]. Although these approaches enhance tracking performance, a single adaptive control law may not provide optimal behavior across the entire PV operating range. The nomenclature of symbols and parameters is shown in nomenclature.
Consequently, region-based MPPT strategies have been investigated, where different control actions are assigned to different operating regions to achieve both rapid convergence and accurate regulation [9], [20], [21]. In addition to MPPT algorithms, effective regulation of the DC–DC converter is required to ensure accurate tracking of the generated reference. Conventional PID controllers are commonly applied due to their simplicity; however, fixed gains may provide limited performance under the nonlinear and time-varying conditions of PV systems. Fuzzy and predictive control approaches have been explored to improve robustness and dynamic response by adapting the control action according to system variations [22]-[24].
Recent MPPT research has increasingly focused on adaptive, optimization-assisted, intelligent, and hybrid control strategies to overcome the limitations of conventional perturb-and-observe (P&O) methods. Variable-step algorithms have been proposed to improve the trade-off between convergence speed and steady-state oscillation by dynamically adjusting the perturbation size according to operating conditions. Although these methods generally achieve faster convergence than fixed-step P&O, their performance remains highly dependent on the selected adaptation law and tuning parameters, and they may still exhibit degraded performance under rapidly varying irradiance conditions [12]-[15].
To address the nonlinear characteristics of photovoltaic (PV) systems, intelligent and optimization based MPPT techniques, including fuzzy logic, artificial intelligence, and metaheuristic optimization, have been developed to improve tracking accuracy, particularly under dynamic environmental conditions and partial shading [4], [19]. These approaches generally provide improved global-search capability and robustness against local maxima; however, they often incur higher computational complexity, require extensive parameter tuning or training, and may exceed the resource constraints of low-cost embedded controllers. Consequently, their practical deployment in real-time PV applications remains dependent on the available processing capability and implementation cost.
Recent studies have therefore placed greater emphasis on real-time implementation and experimental validation to demonstrate the practical feasibility of advanced MPPT controllers [25]-[27]. As summarized in Table 1 conventional P&O methods remain attractive because of their simplicity and low computational requirements but continue to suffer from the inherent compromise between tracking speed and steady-state oscillation. Variable-step and fuzzy-based methods improve adaptability, yet their effectiveness depends on carefully designed adjustment mechanisms, membership functions, and controller tuning. Prediction-assisted fuzzy PID controllers further enhance transient performance by incorporating anticipatory correction, but existing studies generally employ a single control strategy throughout the operating range, requiring one controller to balance the competing objectives of rapid convergence and precise steady-state regulation.
This observation highlights an unresolved challenge in embedded-oriented MPPT design. Existing adaptive, fuzzy, optimization-based, and hybrid approaches generally attempt to improve tracking performance using a single dominant control law or adaptation mechanism across the operating range. However, the control requirements differ substantially when the photovoltaic operating point is far from and close to the MPP. Rapid convergence is the primary requirement in regions far from the MPP, whereas precise regulation and oscillation suppression become more important near the MPP. Although region-based and hybrid MPPT approaches have previously been investigated, the coordinated use of explicit normalized-voltage segmentation with separate coarse and fine-regulation controllers remains comparatively limited, particularly for low-cost embedded implementation.
Among the approaches most closely related to the present study, the dual-mode MPPT method in [20] modifies the operation of P&O according to different tracking conditions, while the adaptive P&O fuzzy controller in [22] integrates fuzzy logic with P&O for improved adaptation. Prediction-assisted fuzzy PID control has also been investigated in [24]. However, these approaches do not jointly combine normalized-voltage-based operating-region segmentation, fixed large-step P&O for coarse tracking, prediction-assisted fuzzy PID for fine regulation, and hysteresis-based mode switching within a single low-complexity embedded MPPT architecture. This coordinated integration constitutes the principal distinction of the proposed framework from the existing methods considered in this study.
To address this gap, the present study proposes a segmented hybrid MPPT architecture that assigns fixed large-step P&O to rapid coarse tracking outside a normalized near-MPP voltage interval and prediction-assisted fuzzy PID control to precise regulation within the interval. The contribution of the proposed method therefore does not lie in introducing P&O or fuzzy PID as individual control techniques, but in their coordinated use within a region-dependent architecture in which each controller is assigned to the operating region that best matches its control characteristics. The framework further incorporates threshold-based mode switching and hysteresis to reduce transition chatter while retaining low computational complexity. The proposed method is evaluated through comparative simulation, threshold-sensitivity analysis, hysteresis analysis, partial-shading assessment, and real-time embedded hardware implementation.
2. Comparative review of related MPPT studies
The existing literature includes conventional fixed-step P&O, variable-step tracking methods, fuzzy-logic-based controllers, and prediction-assisted control approaches. These methods differ in their tracking mechanism, implementation complexity, dynamic response, and ability to reduce steady-state oscillation. Table 1 summarizes the studies most relevant to the proposed segmented MPPT framework.
The current literature shows that conventional and adaptive MPPT methods continue to face a trade-off between rapid transient tracking and accurate steady-state regulation, while existing hybrid and intelligent approaches may involve increased computational complexity or rely on a single control mechanism over a wide operating range. In this study, the proposed framework addresses this trade-off by coordinating normalized-voltage-based operating-region segmentation, large-step P&O for coarse tracking, and prediction-assisted fuzzy PID control for fine regulation. The results demonstrate that explicitly separating the coarse and fine-tracking functions can improve convergence during operating-point changes, reduce transient overshoot, maintain accurate steady-state operation, and mitigate switching chatter. These findings provide practical evidence for the effectiveness of combining complementary control mechanisms according to the operating region rather than relying on a single MPPT strategy across the entire operating range.
Table 1Comparative review of related MPPT and control Studies
Study | Method | Main Contribution | Limitation Relative to the Present Study |
[5] | Conventional P&O Examined the relationship between | Perturbation design and the dynamic performance of P&O-based MPPT | A fixed perturbation creates a trade-off between convergence speed and steady-state oscillation |
[6] and [8] | Improved and evaluated P&O methods | Investigated modifications intended to improve the tracking behavior of conventional P&O under changing operating conditions | The controller remains dependent on a single tracking strategy and may not provide separate coarse and fine-regulation modes |
[9] and [20] | Variable-step MPPT | Adjusted the perturbation magnitude according to the photovoltaic operating condition to improve the balance between tracking speed and steady-state accuracy | Performance depends on the selected step-size law and tuning parameters; no prediction-assisted fuzzy PID fine-regulation stage is included |
[21] | Region or condition dependent MPPT | Applied operating-condition-dependent control to improve tracking over different portions of the photovoltaic characteristic | The method does not combine explicit normalized-voltage boundaries with the proposed P&O and prediction-assisted fuzzy PID architecture |
[22] | Adaptive P&O fuzzy control | Combined fuzzy control with P&O to improve adaptation and converter response under changes in photovoltaic operating conditions | The fuzzy controller is integrated with P&O but does not use the same dual-region separation and one-step prediction-assisted correction proposed in this study |
[23] | Fuzzy-logic MPPT with PI regulation | Demonstrated the use of fuzzy logic for nonlinear photovoltaic MPPT and regulation | It does not assign P&O and fuzzy PID controllers to separate operating regions based on the normalized photovoltaic voltage |
[24] | Prediction-based fuzzy PID control | Presented a fuzzy PID control structure incorporating a prediction-based correction mechanism | The study provides a general control basis rather than a complete segmented photovoltaic MPPT framework validated through simulation, C-HIL, and outdoor hardware tests |
[12] and [13] | Real-time and adaptive variable-step P&O | Developed variable and adaptive-step P&O methods intended to improve tracking speed and reduce steady-state oscillation under changing operating conditions | The methods continue to use P&O as the principal tracking mechanism rather than assigning separate coarse and fine regulation controllers to explicitly defined operating regions. |
[17] and [18] | Improved and adaptive P&O MPPT | Introduced recent modifications to conventional P&O for improved tracking efficiency and operation under dynamic or partially shaded conditions | The approaches do not incorporate the same normalized-voltage-based segmentation and prediction-assisted fuzzy PID regulation used in the present study |
[19] | Hybrid MPPT control | Presented a hybrid MPPT implementation for photovoltaic operation under different partial-shading conditions | The method focuses on partial-shading performance, whereas the present study evaluates segmented local-MPP tracking under uniform irradiance and temperature variations |
[4] and [27] | Optimization based and real-time MPPT | Demonstrated recent optimization-assisted and real-time MPPT methods under changing weather conditions | These methods may provide global or optimization-based searching but typically require greater algorithmic complexity than the proposed region-based controller |
Present study | Segmented P&O and prediction assisted fuzzy PID | Uses the normalized ratio to assign large-step P&O tracking outside the near-MPP interval and prediction-assisted fuzzy PID regulation inside the interval. The framework is evaluated through simulation and laboratory hardware implementation. | Statistical repeated-run evaluation and long-duration outdoor validation remain areas for further investigation. |
The remainder of the manuscript is organized as follows. Section 3 details the research methodology, comprising the proposed control strategy, the simulation configuration and photovoltaic (PV) array specifications, the irradiance and temperature disturbance profiles, the threshold and hysteresis analyses, the partial-shading test condition, and the hardware implementation procedure – including the hardware system architecture and its operating mechanism. Section 4 presents and discusses the simulation and hardware-validation results. Section 5 concludes the study by summarizing the principal findings.
3. Research methodology
This study developed and validated a segmented variable-step Maximum Power Point Tracking (MPPT) control framework that integrates dual-threshold Perturb and Observe (P&O) with predictive fuzzy PID control. The proposed framework addresses key limitations of conventional MPPT techniques, particularly slow tracking response, steady-state oscillation, dynamic overshoot, and operating-point deviation under rapidly changing irradiance and temperature conditions.
The study builds on three core control concepts: MPPT, P&O, and fuzzy PID control. MPPT ensures that the photovoltaic (PV) system operates at or near its Maximum Power Point (MPP). P&O is used for its simple structure and ability to track power changes by perturbing the converter duty cycle; however, conventional P&O produces oscillations near the MPP and responds slowly to sudden environmental changes. A dual-threshold, variable-step approach addresses this trade-off, while an integrated predictive fuzzy PID controller improves steady-state precision and reduces power oscillation near the MPP.
The design requirements were organized into hardware requirements, software requirements, and performance evaluation requirements, which guided the development of the simulation platform, control algorithm, laboratory-scale prototype, and performance evaluation of the proposed MPPT framework.
3.1. Perturb and observe (P&O)
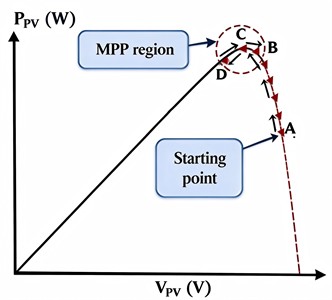
Perturb and Observe (P&O) is one of the most widely adopted MPPT algorithms due to its simple implementation and low computational requirement. The operating principle of the P&O algorithm is illustrated in Fig. 1. The algorithm introduces a small perturbation to the operating voltage or current of the photovoltaic array and evaluates the resulting power variation using sampled voltage and current measurements. The perturbation magnitude is determined by the design characteristics of the tracking algorithm and may be implemented using either fixed-step or variable-step approaches. Accordingly, existing P&O techniques are commonly classified into two categories: fixed-step P&O and variable-step P&O. The fixed-step approach applies a constant perturbation magnitude to generate the reference signal supplied to the closed-loop converter controller. The perturbed reference typically represents the desired photovoltaic voltage or current operating point. Fig. 2 illustrates the power trajectory obtained using a conventional fixed-step P&O controller. Starting from operating point A, the PV output power increases continuously as the controller applies a constant perturbation step. When the operating point reaches point D, the controller detects a reduction in PV power and reverses the perturbation direction. The reference voltage then moves from point D toward point C to recover the power loss. However, because the perturbation magnitude remains unchanged, the operating voltage continues increasing until a power reduction is detected at point B, resulting in another reversal of the perturbation direction.
Fig. 1Flowchart of the P&O method
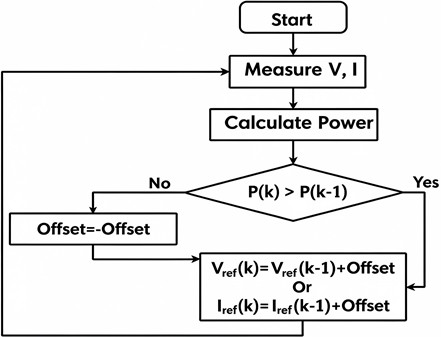
Fig. 2Movement of the operating point during MPP tracking
a) Large perturbation
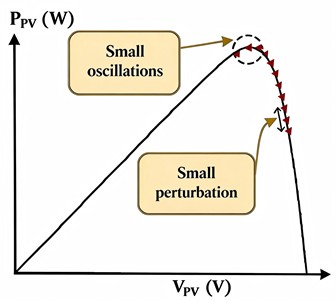
b) Small perturbation
Consequently, the operating point continuously oscillates between points D and B during steady-state operation. The amplitude of these oscillations is directly influenced by the selected perturbation step size. A larger step size improves the convergence speed toward the MPP but produces significant steady-state power oscillations, as shown in Fig. 2(a). Conversely, reducing the perturbation magnitude reduces steady-state oscillations but increases the tracking time required to reach the MPP, as illustrated in Fig. 2(b).
The perturbation step size of conventional fixed-step P&O controllers is usually determined through iterative tuning procedures, making the controller highly dependent on the specific PV system characteristics. Therefore, fixed-step P&O algorithms inherently experience a trade-off between fast dynamic tracking response and low steady-state power oscillation. This limitation motivates the development of adaptive and segmented MPPT strategies that can provide rapid convergence while maintaining accurate steady-state operation.
3.2. Fuzzy PID control method
Fuzzy-logic controllers have been applied to photovoltaic MPPT because they can provide nonlinear control actions without requiring a fixed linear representation of the complete photovoltaic system. Existing studies have investigated adaptive P&O fuzzy control, fuzzy MPPT with PI regulation, fuzzy variable-step P&O, optimized fuzzy controllers, and hardware-based fuzzy MPPT implementation [11], [22], [23], [25], [28], [29]. The fuzzy PID control process consists of the following steps:
1. Determination of the fuzzy inputs and outputs.
2. Definition of the fuzzy sets.
3. Establishment of the fuzzy inference method and control rules.
Using the fuzzy inference mechanism, the three PID parameters are adjusted online to provide strong adaptability under varying operating conditions. Fig. 3 illustrates the schematic diagram of the fuzzy PID control method.
Since the fuzzy inference process produces fuzzy output values, a defuzzification stage is required to convert these outputs into precise control parameters suitable for implementation. In this study, the Center of Area (COA) method is employed to obtain the crisp proportional (), integral (), and derivative () gains. The COA method determines the centroid of the aggregated output membership function, thereby providing a representative crisp value.
The proposed controller is implemented using the Fuzzy Inference System (FIS) module in MATLAB’s Fuzzy Logic Toolbox, which provides three primary design environments: the FIS Editor, Membership Function Editor, and Rule Editor, together with the Rule Viewer and Surface Viewer for inference visualization and analysis. Based on the predefined fuzzy rule base, the controller generates the appropriate values of , , and according to the instantaneous error () and change in error (), thereby realizing the fuzzy PID inference mechanism.
Fig. 3Fuzzy PID control algorithm
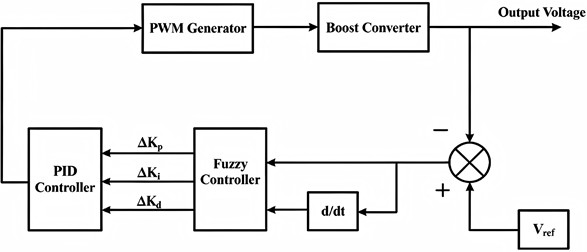
Considering the inherently asymmetric power-voltage (P-U) characteristics of photovoltaic modules around the maximum power point (MPP), the membership functions are intentionally designed with an asymmetric configuration. Specifically, triangular membership functions are employed in the intermediate regions of the input and output universes of discourse, while Z-shaped and S-shaped membership functions are adopted at the lower and upper boundaries, respectively. The resulting fuzzy PID inference architecture is illustrated in Fig. 3.
The asymmetric arrangement of the triangular, S-shaped, and Z-shaped membership functions was selected to better represent the nonlinear characteristics of the photovoltaic power-voltage (P-U) curve. Near the maximum power point (MPP), the slope of the P-U characteristic is relatively gradual on the low-voltage side but becomes progressively steeper as the operating point approaches the open-circuit voltage. Consequently, a symmetric membership-function configuration would allocate identical control resolution across operating regions that exhibit markedly different dynamic responses to duty-cycle perturbations. In contrast, the proposed asymmetric design provides finer control resolution in regions of greater sensitivity while maintaining adequate resolution in less sensitive regions, thereby improving the controller’s ability to respond to nonlinear operating conditions.
Fuzzy-logic-based MPPT controllers have been investigated as a means of improving adaptation to the nonlinear operating characteristics of photovoltaic systems. Previous studies have examined adaptive P&O fuzzy control, fuzzy-logic MPPT with converter regulation, variable-step fuzzy P&O, and optimized fuzzy-controller design [11], [22], [23], [29], [30]. In the present study, the membership-function arrangement was selected through controller-design analysis and simulation-based tuning. No claim is made that the selected asymmetric configuration is universally optimal for all photovoltaic systems.
3.3. Intrinsic characteristics of the photovoltaic cell P-U curve
The P-U curve of photovoltaic cells exhibits a single-peak characteristic, with the MPP typically located within a specific proportion of . Extensive experimental and theoretical analyses reveal that:
1. Under standard illumination and temperature conditions, the voltage corresponding to the MPP () is approximately 0.75-0.9. Although minor variations exist across photovoltaic cell types and environmental conditions, this interval represents the highest probability range for covering the MPP in engineering practice
2. When the operating voltage is below 0.75 or above 0.9, the slope of the P-U curve.
Changes significantly (steep slope in regions far from the MPP and gentle slope near the MPP). This “slope difference” enables a division of control modes: fixed large-step tracking in distant regions and variable-step fine adjustment in the threshold region.
3.4. Demand for segmented control strategy adaptation
The selection of the perturbation step size is an important consideration in photovoltaic (PV) maximum power point tracking (MPPT). In conventional perturb-and-observe (P&O) control, a fixed perturbation step involves a trade-off between dynamic tracking speed and steady-state accuracy. A larger step size can accelerate the movement of the operating point toward the maximum power point (MPP), but it can also increase steady-state oscillations around the MPP. Conversely, a smaller step size can reduce these oscillations at the expense of slower convergence [5], [11]. Variable-step and adaptive P&O techniques have therefore been proposed to adjust the perturbation magnitude according to the operating condition, particularly during rapid irradiance variations [9], [13], [15].
3.4.1. Distant MPP regions (0.75 or 0.9)
When the PV operating voltage is outside the selected near-MPP region, the primary control requirement is rapid convergence toward the vicinity of the MPP. Accordingly, the proposed strategy employs a relatively large fixed perturbation step in these regions. This provides a coarse-tracking mechanism that moves the operating point rapidly toward the selected near-MPP region rather than performing a slow point-by-point search. The use of larger perturbations during the initial or transient tracking stage is consistent with the established speed–accuracy trade-off of P&O-based MPPT methods [5], [9], [11]. The fixed-step P&O controller therefore performs the coarse-search function of the proposed segmented control strategy.
3.4.2. MPP threshold region (0.75 or 0.9)
Once the operating voltage enters the selected near-MPP region, the control objective shifts from rapid convergence to accurate regulation with reduced steady-state oscillation. In this region, the proposed strategy employs predictive fuzzy PID control to provide finer and adaptive control action. The use of variable-step or adaptive control near the MPP is consistent with previous MPPT studies, which have demonstrated that reducing the perturbation magnitude as the operating point approaches the MPP can improve steady-state behavior while retaining satisfactory dynamic performance [9], [11], [12]. Fuzzy-based variable-step MPPT has likewise been investigated as a means of simultaneously improving transient response and reducing steady-state voltage oscillations [11]. Therefore, the proposed segmented strategy assigns the adaptive fuzzy PID controller to the near-MPP region, where finer control action is more beneficial.
3.4.3. Basis for the selected thresholds
The thresholds were selected as control-oriented boundaries for separating the coarse and fine-tracking modes. The MPP voltage of a PV module varies with operating conditions, including irradiance and temperature, and therefore cannot be represented by a single fixed voltage under all conditions [1], [2], [5]. Consequently, the selected interval is not intended to imply that the MPP is universally confined to 0.75-0.9Instead, it provides a practical voltage region within which the proposed controller transitions from rapid P&O-based searching to fine adaptive regulation. The specific threshold values were subsequently examined through the threshold sensitivity analysis. This analysis provides a system-specific basis for determining whether the selected boundaries offer an appropriate balance between tracking speed, steady-state accuracy, and convergence stability. Thus, the proposed segmentation combines established MPPT control principles with threshold values determined and evaluated for the PV system considered in this study.
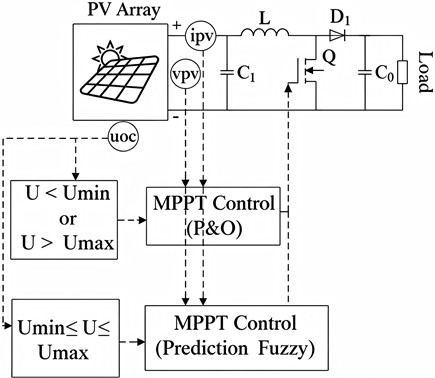
Fig. 4Schematic diagram of the proposed MPPT control method
3.5. Piecewise variable-step MPPT control method
This study proposes a segmented variable-step MPPT control method for photovoltaic systems, which is based on disturbance P&O combined with dual threshold interval partitioning and predictive fuzzy PID control. This method divides the output characteristics of photovoltaic cells into two parts: “outside the range (far from the MPP area)” and “inside the range (near the threshold area of the MPP)”.
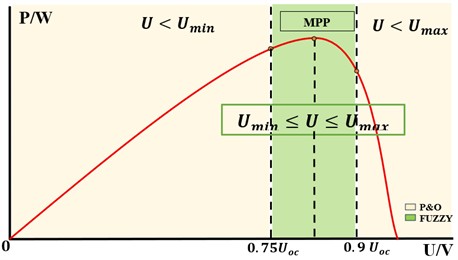
As shown in Fig. 5, when the voltage satisfies 0.75 or 0.9, it is judged to be far from the MPP area. At this time, the slope of the P-U curve is large and the power changes dramatically. A fixed large-step P&O strategy is adopted to quickly cross the low-efficiency area through the “strong disturbance fast response” mode, shortening the time from startup or large irradiation mutation to near the MPP.
When the voltage is between 0.75 and 0.9 it is determined to be in the threshold area near the MPP. At this time, the slope of the P-U curve is gentle and the power change is subtle. Switching to predictive fuzzy PID control, the PID parameters are corrected through fuzzy inference of power deviation () and deviation change rate (), and the duty cycle is compensated by combining the predictive model to achieve “precise tracking + oscillation suppression” and ensure steady-state accuracy.
This switching logic is triggered by the voltage ratio and embedded in the main control loop. The data acquisition layer obtains real-time voltage, current, irradiation, and temperature data. The mode judgment layer activates the corresponding control mode based on the value of , while the control execution layer adjusts the duty cycle of the Boost converter through PWM. This design balances global fast convergence and local precise control, solving the problem of low efficiency in long-distance tracking and improving stability near the MPP, thereby improving MPPT performance under the irradiance and temperature variations considered in this study. In engineering applications, it can be logically implemented through the MATLAB/ Simulink condition judgment module.
Fractional open-circuit-voltage MPPT methods approximate the maximum-power-point voltage as a fraction of the photovoltaic open-circuit voltage. The proportional coefficient is dependent on the photovoltaic technology and operating conditions and should therefore be treated as an approximate operating-region indicator rather than a universal constant [1], [2], [31]. The relationship is expressed as:
where 𝐾 is an empirically selected proportional coefficient. In this study, the interval
0.75 0.90 was adopted as the mode-selection region and was subsequently examined:
and proposes a composite strategy combining segmented variable-step P&O with predictive fuzzy PID control. The rationale for this design is deeply rooted in the characteristics of photovoltaic cells and control requirements, as elaborated in the following sections.
3.5.1. MMPT control strategy segmentation
As shown in Fig. 5, the segmentation of the variable-step MPPT control strategy is illustrated.
The proposed strategy divides the operating voltage range into three regions to achieve fast tracking under large deviations and improved stability near the maximum power point (MPP). The control process is defined as follows:
– Fixed large-step P&O method: .
– Fuzzy PID control with prediction model: .
– Fixed large-step P&O method: .
The voltage range of each segmented area is determined by the selective control switch module, which enables the transition between the two MPPT approaches. The specific control process remains consistent with the corresponding individual control methods. The specific control process is consistent with the single control method.
Fig. 5Division of segmented intervals
3.5.2. Predictive fuzzy PID formulation
The parameters of the online rolling optimization model are input into the fuzzy PID controller by comparing the output value of the prediction model with the actual input value and the rate of change of the deviation, which constitutes the fuzzy PID control with the prediction model to predict the future output of the system (Guo et al., 2011). As shown in Fig. 6, this is the schematic diagram of the fuzzy PID control method with a prediction model.
The mode-switching mechanism is determined by the normalized operating-point ratio:
where is the measured photovoltaic terminal voltage and is the irradianceand temperature-compensated open-circuit voltage. Based on the value of , the proposed controller:
where:
The first branch of Eq. (5) governs the large-step Perturb and Observe (P&O) mode when the operating point lies outside the predefined voltage-ratio interval, whereas the second branch activates the predictive fuzzy PID mode when the operating point falls within the threshold region surrounding the maximum power point (MPP). Here, denotes the output of the primary fuzzy self-tuning PID controller computed during the present control cycle for application at the next sampling instant, and denotes the corresponding value retained from the preceding cycle. The prediction-assisted component performs a model-free, one-step extrapolation of the primary fuzzy PID controller’s output, using only the most recent discrete-time variation between the current and immediately preceding control cycles:
Fig. 6Schematic diagram of fuzzy PID control method with predictive model
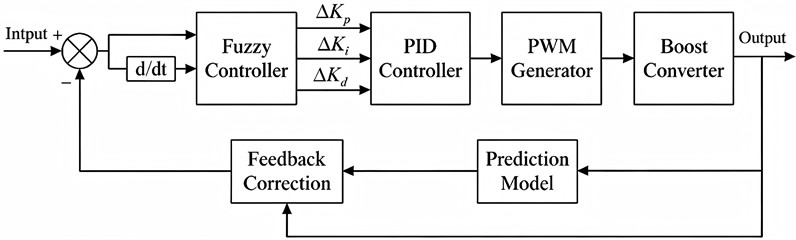
This variation is weighted by an adaptive adjustment coefficient , generated by a secondary fuzzy inference system, to form the corrected prediction:
The auxiliary fuzzy controller determines the value of from the input-output difference . The input variable is defined over the universe of discourse [–1, +1] with the linguistic terms {NB, NS, Z, PS, PB}, whereas the output coefficient is defined over the interval [0, +3] using the linguistic set {Small, Medium, Big}. The corresponding fuzzy rule base is presented in Table 2.
Table 2Fuzzy rules for the predictive-model adjustment coefficient
ED | NB | NS | Z | PS | PB |
P | B | M | S | M | B |
The proposed fuzzy controller employs two input variables: the error, , defined as the local slope of the photovoltaic power-voltage (P-V) characteristic:
and the change in error:
Both input variables are normalized over the universe of discourse [–3, +3].
A seven-level linguistic partition, {NB, NM, NS, Z, PS, PM, PB}, is adopted for both inputs and the three output variables, , , and . The corresponding output universes of discourse are [–0.3, +0.3], [–0.06, +0.06], and [–3, +3], respectively.
Table 3ΔKp fuzzy rule table
E/ΔE | NB | NM | NS | Z | PS | PM | PB |
NB | PB | PB | PM | PM | PS | Z | Z |
NM | PB | PB | PM | PS | PS | Z | NS |
NS | PM | PM | PM | NS | Z | NS | NS |
Z | PM | PM | PS | Z | NS | NM | NM |
PS | PS | PS | Z | NS | NS | NM | NM |
PM | PS | Z | NS | NM | NM | NM | NB |
PB | Z | Z | NM | NM | NM | NB | NB |
Triangular membership functions are assigned to the intermediate linguistic terms, whereas Z-shaped and S-shaped membership functions are employed for the lower and upper extreme linguistic sets, respectively. The complete fuzzy rule bases governing the adaptive adjustment of , , and are presented in Table 3-5.
Table 4ΔKi fuzzy rule table
E/ΔE | NB | NM | NS | Z | PS | PM | PB |
NB | NB | NB | NM | NM | NS | Z | Z |
NM | NB | NB | NM | NS | NS | Z | Z |
NS | NB | NM | NS | NS | Z | PS | PS |
Z | NM | NM | NS | Z | PS | PM | PM |
PS | NM | NS | Z | PS | PS | PM | PM |
PM | Z | Z | PS | PS | PM | PB | PB |
PB | Z | Z | PS | PM | PM | PB | PB |
Table 5ΔKd fuzzy rule table
E/ΔE | NB | NM | NS | Z | PS | PM | PB |
NB | PS | NS | NB | NB | NM | NM | PS |
NM | PS | NS | NB | NM | NM | NS | Z |
NS | Z | NS | NM | NM | NS | NS | Z |
Z | Z | Z | NS | NS | NS | Z | PS |
PS | Z | Z | Z | Z | Z | Z | Z |
PM | PB | NS | PS | PS | PS | PB | PB |
PB | PM | PM | PM | PS | PS | PB | PB |
Table 6Reference parameters of the simulated photovoltaic array
Parameter | Symbol | Value |
Reference irradiance | 1300 W/m2 | |
Reference cell temperature | 25 ℃ | |
Short-circuit current | 48 A | |
Current at the MPP | 40 A | |
Open-circuit voltage | 330 V | |
Voltage at the MPP | 260 V | |
Reference MPP power | 10.4 kW |
3.6. Simulation configuration
The comparative evaluation was conducted using a common photovoltaic array and DC-DC converter model in MATLAB/Simulink. The conventional P&O, fuzzy PID, and proposed segmented controllers were connected to the same photovoltaic source, converter, load, environmental input profiles, and measurement blocks. Identical initial conditions, controller sampling periods, solver settings, and simulation durations were maintained for all three controllers to ensure that the observed performance differences were attributable to the MPPT control method. The conventional P&O, standalone fuzzy PID, and proposed segmented MPPT controllers were implemented using a common sampling period of:
which corresponds to a sampling frequency of:
At each sampling instant, the photovoltaic voltage and current were acquired, the instantaneous power was calculated, the operating region was identified, and the corresponding controller output was updated. The same sampling period was used for all controllers to ensure that the comparative results were not affected by differences in controller update frequency. The one-second interval used to present the outdoor hardware measurements represents the data-logging interval rather than the internal controller sampling period.
3.6.1. Photovoltaic array model and specifications
The photovoltaic source was represented by an irradiance and temperature-dependent array model. The array parameters at the reference operating condition are summarized in Table 6. The instantaneous array parameters were adjusted according to the applied irradiance, , and cell temperature, . The temperature difference and normalized irradiance were defined as:
The short-circuit current and MPP current were calculated as:
where 𝑎 is the current temperature coefficient used in the photovoltaic model. The open-circuit and MPP voltages were calculated using:
where and are the irradiance and temperature-correction coefficients of the implemented photovoltaic model. The resulting voltage and current parameters were used to generate the instantaneous current-voltage and power-voltage characteristics of the array.
3.6.2. DC-DC converter and simulation parameters
The simulated photovoltaic array was connected to a DC-DC boost converter. The converter duty cycle regulated the electrical operating point presented to the photovoltaic source. Previous studies have investigated PID, fuzzy, and nonlinear control structures for DC-DC converter regulation [32]-[35].
To ensure a fair comparison, the conventional P&O, fuzzy PID, and proposed segmented MPPT controllers were evaluated using the same photovoltaic model, converter components, load condition, PWM configuration, controller timing, initial operating point, solver configuration, and simulation duration. Only one environmental variable was changed during each test so that the effect of irradiance and temperature disturbances could be evaluated separately. The corresponding converter and simulation parameters are summarized in Table 7.
The PWM subsystem used a sawtooth carrier with a period of 100 µs, corresponding to a switching frequency of:
PWM switching cycles. The switching frequency was maintained at 10 kHz for the conventional P&O, fuzzy PID, and proposed segmented controllers. Consequently, the observed differences in tracking time, transient power deviation, and steady-state response were attributable to the MPPT control strategies rather than to differences in converter switching conditions. The selected switching frequency represents a compromise between converter ripple and switching activity. In general, increasing the switching frequency can reduce inductor-current and output-voltage ripple for fixed passive components, but it may also increase semiconductor switching losses and thermal stress. Conversely, a lower switching frequency may reduce switching losses while producing greater current and voltage ripple. However, the switching frequency was not varied independently in the present study. Therefore, its quantitative effects on converter efficiency, semiconductor losses, inductor-current ripple, and output-voltage ripple were not evaluated. A switching-frequency sensitivity analysis remains an area for future converter-level optimization.
Table 7DC-DC converter and simulation parameters
Parameter | Symbol | Value |
Converter topology | – | Boost converter |
Inductance | 150 µH | |
Output capacitance | 100 µF | |
Input capacitance | 100 µF | |
Load resistance | 7.5 Ω | |
Switching frequency | 10 kHz | |
Initial duty cycle | 0.10 | |
Minimum duty cycle | 0 | |
Maximum duty cycle | 1 | |
Controller sampling period | 0.5 ms | |
Controller update frequency | 2 kHz | |
Simulation solver | – | Variable-step automatic |
Solver step size | – | Automatic |
Simulation duration | 0.15 s |
3.7. Irradiance and temperature disturbance
Two principal disturbance tests were applied. For the irradiance test, the irradiance was changed through the levels 1300, 1000, and 700 W/m2 while the cell temperature was maintained at 25 ℃. For the temperature test, the cell temperature was changed through 40, 25, and 10 ℃ while irradiance was maintained at 1000 W/m2. The same transition times and model parameters were applied to all three controllers.
3.8. Robustness and sensitivity of the mode-switching thresholds
Beyond the theoretical basis of the selected threshold interval, the robustness of the modeswitching strategy can be examined through two additional considerations: (1) switching behavior in the presence of measurement noise near the threshold boundaries and (2) the sensitivity of overall system performance to changes in the selected threshold values.
3.8.1. Threshold sensitivity analysis
To evaluate the influence of different switching threshold pairs on the proposed piecewise variable-step MPPT strategy, a threshold sensitivity analysis was performed by varying 𝑈min from 0.73to 0.77 and from 0.88 to 0.92. During this analysis, all controller parameters, PV model parameters, and simulation settings were kept constant, while only the switching threshold pair was varied. Four representative operating conditions were selected, namely 1300 W/m2 at 10 ℃, 1300 W/m2at 40℃, 700 W/m2 at 10 ℃, and 700 W/m2 at 40 ℃. These operating points represent the extreme combinations of irradiance and temperature within the considered operating range of the PV system and were intentionally selected to evaluate the robustness of each threshold pair under both high-power and low-power operating conditions. Constant irradiance and temperature were maintained throughout each simulation to isolate the influence of the switching thresholds from environmental transients, ensuring that any observed performance differences could be attributed solely to the selected threshold values.
Three performance metrics were considered: tracking time, relative tracking efficiency, and steady-state power oscillation. These metrics characterize the transient response, steady-state power extraction capability, and output stability of the controller, respectively. The tracking time was defined as the time required for the PV output power to converge from its initial operating condition to the maximum power point (MPP). Since each threshold sensitivity simulation was performed under constant irradiance and temperature conditions, no external disturbance was introduced after the start of the simulation. Consequently, the disturbance time was taken as 0, and the measured tracking time corresponds to the startup convergence of the MPPT controller. The steady-state reference power, , was obtained as the average of the final 500 samples of the simulated PV power response:
where denotes the instantaneous PV array power during the final steady-state interval. The corresponding ±2 % settling band was defined as:
The settling time, , was defined as the first sampling instant at which the PV output power entered the ±2 % settling band around and remained continuously within this band for the remainder of the simulation. To prevent premature convergence caused by numerical fluctuations or transient oscillations, the settling criterion was additionally required to be satisfied for at least five consecutive sampling instants before the response was considered settled. The tracking time was then calculated as:
where 0 for all threshold sensitivity simulations. Consequently, a smaller value of indicates faster convergence of the MPPT controller from its initial operating condition. The steady-state average power was evaluated using only the final 500 samples of the simulation:
Using a fixed observation window for every threshold configuration ensures that all threshold pairs are evaluated over an identical steady-state interval, thereby eliminating bias associated with differences in convergence time.
Since the objective of the threshold sensitivity analysis is to compare the relative performance of different threshold selections rather than to determine the absolute MPPT efficiency of the controller, the relative tracking efficiency was calculated by normalizing the average steady-state power of each threshold pair with respect to the highest average steady-state power obtained among all evaluated threshold configurations under the same irradiance and temperature condition:
where denotes the maximum value of among all threshold pairs evaluated for a given operating condition. Consequently, each irradiance-temperature condition has its own reference power, ensuring that the comparison reflects only the influence of the switching thresholds and is not biased by variations in the maximum power available from the PV array under different environmental conditions.
The steady-state power oscillation was evaluated over the interval beginning at the settling time, , and extending to the end of the simulation. The peak-to-peak steady-state oscillation was calculated as:
where and denote the maximum and minimum PV output powers measured during the steady-state interval. To facilitate comparison among different threshold configurations, the oscillation was normalized as:
A lower value of indicates reduced steady-state power fluctuation around the operating point and, therefore, improved controller stability.
Consequently, these three-performance metrics collectively evaluate the primary characteristics affected by threshold selection, namely convergence speed through the tracking time, steady-state power extraction through the relative tracking efficiency, and output stability through the normalized steady-state power oscillation. Together, these metrics provide a comprehensive and consistent basis for identifying the threshold pair that offers the most balanced performance across the investigated operating conditions for the proposed piecewise variable-step MPPT controller.
Table 8Illustrative hysteresis thresholds for the mode-switching enhancement (δh= 0.01Uoc)
Threshold | Value | Description |
0.76 | Activation threshold for entering the fuzzy PID operating region from the lower-voltage P&O region | |
0.74 | Deactivation threshold for leaving the fuzzy PID operating region toward the lower-voltage P&O region | |
0.89 | Activation threshold for re-entering the fuzzy PID operating region from the upper-voltage P&O region | |
0.91 | Deactivation threshold for leaving the fuzzy PID operating region toward the upper-voltage P&O region |
3.8.2. Hysteresis-based chattering mitigation
To further enhance the robustness of the proposed mode-selection strategy, a hysteresis band may be incorporated around each switching threshold as an additional design consideration. Instead of using a single switching point at each threshold may be divided into separate activation and deactivation values. These values are separated by a hysteresis margin, , defined as a small fraction of the open-circuit voltage, . Selecting a hysteresis margin of 0.01 yields the following activation and deactivation thresholds is shown in Table 8. They are presented as an illustrative practical hysteresis configuration that may be adopted to improve the robustness of the mode-selection mechanism.
Unlike a single-threshold switching strategy, a hysteresis-based implementation determines the active switching threshold according to the previously selected operating mode. Separate activation and deactivation thresholds are therefore used when entering and leaving the fuzzy PID operating region, thereby establishing a finite hysteresis band around each decision boundary. While the measured operating voltage remains within this band, the controller retains its current operating mode instead of immediately switching to the alternative controller. This behavior reduces unnecessary mode transitions caused by measurement noise, numerical quantization, and small steady-state oscillations near the switching thresholds.
This additional design consideration is particularly relevant under rapidly varying environmental conditions, such as sudden changes in solar irradiance or photovoltaic cell temperature. Under such conditions, the operating point may repeatedly approach or cross a switching boundary before reaching a new steady-state condition. The hysteresis band reduces undesirable switching chatter by allowing a mode transition only after the operating point has moved sufficiently beyond the applicable threshold. Consequently, the proposed hysteresis mechanism can improve the robustness and reliability of the mode-selection process while preserving the intended operating regions of the Perturb and Observe (P&O) and prediction-assisted fuzzy PID controllers.
3.9. Partial-shading condition
To further evaluate the robustness of the proposed piecewise variable-step MPPT controller, an additional simulation was performed under partial-shading conditions (PSC). The simulated PV system consisted of three series-connected photovoltaic array sections. The first and second array sections were operated at an irradiance level of 1000 W/m2, while the third array section was subjected to a reduced irradiance level of 700 W/m2. The temperature of all array sections was maintained at 25 ℃ throughout the simulation.
Fig. 7Partial shading test configuration
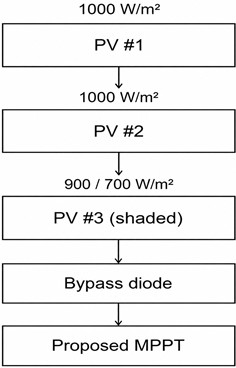
A bypass diode was connected across the partially shaded array section to represent the protection mechanism commonly used in practical photovoltaic systems. The diode provided an alternative current path when the shaded section became reverse biased, thereby limiting localized power dissipation and allowing the series-connected PV system to continue operating under nonuniform irradiance conditions.
Fig. 7 illustrates the photovoltaic-array configuration used for the partial-shading-condition evaluation. The proposed MPPT controller, DC-DC boost converter, and controller parameters were maintained identical to those used in the uniform irradiance simulations. The only modification introduced during the PSC tests was the nonuniform irradiance distribution applied to the three series-connected PV array sections. This arrangement ensured that the observed changes in system performance were primarily associated with partial shading rather than variations in the controller or converter configuration. The proposed controller was evaluated under PSC using the same performance metrics employed in the threshold-sensitivity analysis, thereby providing a consistent basis for comparison. The evaluation examined the ability of the piecewise variable-step MPPT controller to maintain rapid convergence, high power-extraction efficiency, and stable steady-state operation under nonuniform irradiance conditions. The resulting performance was subsequently compared with that obtained under uniform irradiance to determine the influence of partial shading on the dynamic and steady-state behavior of the controller.
3.10. MPPT performance evaluation metrics
The conventional P&O, fuzzy PID, and proposed segmented MPPT controllers were evaluated using identical photovoltaic-system parameters, environmental inputs, initial conditions, sampling periods, and observation intervals. At the th sampling instant, the measured photovoltaic output power was calculated as:
where and are the measured photovoltaic voltage and current, respectively.
The theoretical maximum available photovoltaic power, , was obtained from the power-voltage characteristic of the photovoltaic model under the same irradiance and cell temperature applied at the corresponding sampling instant. The same reference was used for all controllers.
3.10.1. Instantaneous tracking efficiency
The instantaneous MPPT tracking efficiency was defined as the ratio of the measured photovoltaic power to the theoretical maximum available power:
A value approaching 100 % indicates that the photovoltaic operating point is close to the theoretical MPP. The mean tracking efficiency over an evaluation interval containing samples was calculated as:
A value approaching 100 % indicates that the photovoltaic operating point is close to the theoretical MPP. The mean tracking efficiency over an evaluation interval containing 𝑁samples was calculated as:
Unlike a single steady-state operating-point error, this metric accounts for the controller performance throughout the complete evaluation interval, including transient and steady-state operation.
3.10.2. Steady-state MPP tracking error
To quantify the steady-state tracking accuracy of the MPPT controllers, the steady-state MPP tracking error was defined as the normalized absolute deviation of the average measured photovoltaic output power from the theoretical maximum power under the corresponding irradiance and cell temperature conditions:
where denotes the average measured photovoltaic output power over the selected steady-state observation interval, and denotes the theoretical maximum power obtained from the power-voltage characteristic of the photovoltaic model under the corresponding irradiance, , and cell temperature, .
The theoretical MPP is used as the reference because the primary objective of an MPPT controller is to maintain the PV operating point at or near the maximum available power under a given operating condition. Thus, directly quantifies the relative deviation of the achieved steady-state power from the theoretical MPP. A lower value of indicates more accurate steady-state MPP tracking, with 0 % corresponding to exact agreement between the average measured steady-state power and the theoretical MPP.
3.10.3. MPPT energy-harvesting efficiency
The electrical energy extracted from the photovoltaic array during the selected evaluation interval was calculated as:
where is the controller sampling period.
The theoretical maximum available photovoltaic energy during the same interval was calculated as:
The MPPT energy-harvesting efficiency was then defined as:
The energy-harvesting efficiency differs from the arithmetic mean of the instantaneous tracking efficiencies because Eq. (35) weights each sample according to the maximum power available at that instant. This distinction is important when irradiance and temperature vary during the test.
3.10.4. MPPT power and energy loss
The signed instantaneous difference between the theoretical maximum power and the measured photovoltaic power was defined as:
To calculate non-negative power loss, the MPPT power loss was defined as:
The maximum MPPT power loss during the selected interval was calculated as:
while the average power loss was calculated as:
The cumulative energy not extracted because of imperfect MPP tracking was calculated as:
The normalized energy loss was expressed as:
When the measured photovoltaic power does not exceed the theoretical MPP during the selected interval, the energy-harvesting efficiency and normalized energy loss satisfy:
Transient values for which > may occur because of stored energy in converter components, numerical solver effects, or differences between instantaneous and steady-state reference values. Such events were evaluated separately through the maximum transient power-deviation metric and were not treated as negative MPPT loss.
3.11. Hardware implementation procedure
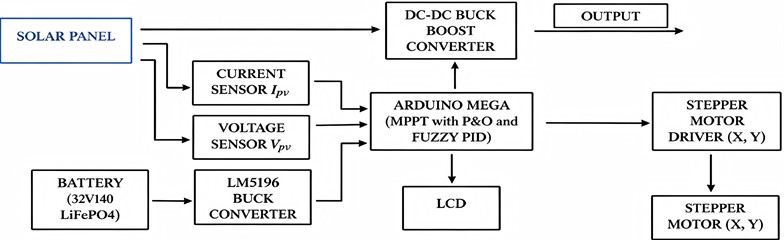
After MATLAB/Simulink validation, a laboratory-scale hardware setup was developed to verify the practical performance of the proposed MPPT framework. The hardware implementation integrates the photovoltaic source, sensing stage, controller, DC-DC buck-boost converter, dual-axis solar tracking mechanism, and electrical load into a complete photovoltaic energy conversion system.
3.11.1. Hardware system architecture
Embedded and real-time implementations have previously demonstrated the feasibility of executing MPPT algorithms using Arduino-, DSP-, and other controller-based platforms [25]-[27], [36]-[37]. The proposed hardware setup consists of a photovoltaic panel, voltage and current sensing.
Modules, a DC-DC buck-boost converter, an Arduino-based controller, stepper motor drivers, dual-axis stepper motors, a battery supply, and a load connection. The photovoltaic panel provides the input power source, while the sensing module measures the PV terminal voltage and current. These measured signals are transmitted to the controller for MPPT computation. The Arduino-based controller executes the MPPT algorithm and generates the corresponding pulse-width modulation (PWM) signal to regulate the duty cycle of the buck–boost converter. The converter subsequently adjusts the operating point of the photovoltaic panel according to the controller output. The stepper motor drivers and dual-axis motors constitute the solar tracking mechanism, which modifies the panel orientation to generate different alignment conditions during hardware validation.
Fig. 8Hardware system architecture of the photovoltaic MPPT and dual-axis solar-tracking setup
3.11.2. Dual-axis solar tracking mechanism
The dual-axis solar tracking mechanism is employed to adjust the orientation of the photovoltaic panel during hardware experimental validation. Since controlled irradiance levels cannot be consistently reproduced under laboratory conditions, controlled angular displacement of the PV panel is utilized to emulate different irradiance conditions on the photovoltaic surface.
Due to environmental and testing constraints, the hardware validation was conducted over a defined observation period under available outdoor conditions, where naturally varying solar irradiance served as the operating input of the photovoltaic system. The selected observation period was sufficient to evaluate the mode-switching performance of the proposed piecewise variable-step MPPT framework, including the threshold-based transition between the P&O and fuzzy PID control modes under changing irradiance conditions.
3.11.3. Voltage and current measurement
The voltage and current sensing stage measures the real-time photovoltaic output voltage and current. These measured quantities are used to calculate the instantaneous PV output power:
where represents the photovoltaic output power, denotes the measured PV voltage, and represents the measured PV current. The calculated power value is used by the MPPT controller to determine the operating condition and generate the required duty-cycle adjustment.
3.11.4. Sensor resolution and calibration
Although the ADC resolution defines the smallest detectable voltage or current increment, it does not represent the overall measurement accuracy of the sensing system. The actual accuracy is influenced by several factors, including resistor tolerance in the voltage divider, ADC quantization error, reference voltage variation, sensor nonlinearity, temperature effects, and calibration uncertainty. For the photovoltaic voltage measurement, the dominant error sources are the tolerance of the 47 kΩ and 10 kΩ resistors and the Arduino ADC conversion error. Assuming resistor tolerances of ±1 %, the uncertainty in the voltage-divider ratio can be estimated using the tolerance propagation of the resistor values. Since the divider ratio directly determines the scaling factor between the ADC measurement and the photovoltaic voltage, any variation in resistor values introduces a corresponding gain error. In addition to the resistor tolerance, the 10-bit ADC introduces a quantization uncertainty of approximately ±0.5 ADC counts. Therefore, the ADC quantization error referred to the ADC input is given by:
where is the ADC reference voltage. For the default 5 V reference, this corresponds to approximately ±2.44 mV at the ADC input. Referred to the photovoltaic input side, the equivalent voltage uncertainty becomes:
which is approximately ±13.9 mV. Therefore, the voltage measurement uncertainty consists of both the ADC quantization error and the voltage-divider gain uncertainty.
For the photovoltaic current measurement, the theoretical resolution calculated from the ADC step size represents only the minimum detectable current change and does not indicate the actual measurement accuracy. The ACS712 Hall-effect current sensor is affected by offset voltage drift, sensitivity variation, output noise, and temperature dependence. To minimize the offset error, the zero-current output of the ACS712 was measured before each experiment and averaged over multiple samples. The measured offset voltage was then subtracted from the sensor output during data processing.
The voltage and current sensing channels were calibrated against a reference digital multimeter using several known operating points covering the experimental measurement range. A linear calibration model was obtained from the relationship between the ADC readings and the reference measurements:
where and are the calibration gain and offset coefficients, respectively. These coefficients were implemented in the Arduino program to compensate for sensor gain and offset errors.
The calibration accuracy was evaluated by comparing the corrected sensor measurements with the reference multimeter values. The percentage measurement error was calculated as:
where sensor is the calibrated sensor measurement and is the corresponding reference measurement. The maximum absolute error and root-mean-square error (RMSE) obtained from the calibration data were used to quantify the accuracy of each sensing channel. After calibration, the remaining measurement error represents the combined influence of sensor nonlinearity, ADC limitations, resistor tolerance, and environmental variations. These uncertainties were considered in the interpretation of the photovoltaic voltage, current, and power measurements.
3.12. MPPT controller and buck-boost converter operation
The Arduino-based MPPT algorithm was configured with a nominal internal controller update period of (1 ms), while the measurements presented in the hardware-result tables were recorded at one-second intervals for data reporting. The controller processes the measured voltage and current signals to determine the operating condition of the photovoltaic system. When the operating point is far from the maximum power point, the large-step P&O mode is activated to achieve rapid tracking. Conversely, when the operating point enters the predefined threshold region near the MPP, the controller switches to the predictive fuzzy PID mode to reduce oscillations and improve steady-state accuracy.
The controller output is converted into a PWM signal, which drives the switching device of the DC-DC buck-boost converter. By regulating the duty cycle, the converter modifies the PV operating point and controls the output response of the photovoltaic energy conversion system.
3.12.1. Computational complexity and embedded implementation
The proposed hybrid MPPT controller was implemented on an Arduino Mega 2560 operating at 16 MHz with a controller update frequency of 1 kHz. The online algorithm consists of fixed-step P&O logic, fuzzy inference using a compact rule base, one-step prediction-assisted correction, and conventional PID arithmetic. Its computational effort remains approximately constant during each sampling interval because it does not require iterative optimization, matrix inversion, or an offline-trained model.
Based on the implemented algorithm structure and the resource capacity of the Arduino Mega 2560, the expected program-memory requirement is approximately 20-40 kB, corresponding to about 8-16 % of the available 256 kB Flash memory. The estimated SRAM requirement is approximately 2-4 kB, equivalent to about 25-50 % of the available 8 kB SRAM. The controller execution time is estimated to be approximately 300-700 µs per update, with an estimated worst-case value of 700-1000 𝜇s. For a controller period of 1 ms, this corresponds to an approximate processor utilization of 30-70 % during normal operation and up to 70-100 % under the estimated worst-case condition.
These values are engineering estimates based on the implemented controller structure and should not be interpreted as direct execution-profile measurements. Exact Flash usage, SRAM utilization, and worst-case execution time require verification using the Arduino compiler report and execution-time instrumentation in the final embedded program.
4. Results and discussions
4.1. Design and development of the segmented variable-step MPPT framework
The primary objective of this paper was to design and develop a segmented variable-step MPPT framework integrating dual-threshold Perturb and Observe (P&O) control and predictive fuzzy PID control. The resulting framework was conceptualized as a dual-mode control strategy that divides the photovoltaic operating region into two zones: the region far from the Maximum Power Point (MPP) and the region near the MPP.
When the operating voltage is outside the defined threshold interval, the system activates the large-step P&O mode to rapidly approach the MPP. Once the operating voltage enters the threshold interval, the controller switches to predictive fuzzy PID control to improve steady-state precision and reduce power oscillation. This control structure allows the proposed MPPT framework to combine fast dynamic tracking with stable near MPP operation.
The final conceptualized MPPT framework therefore consists of four major stages: real-time data acquisition, operating region classification, adaptive control execution, and performance output evaluation. The voltage and current measurements are used to compute the photovoltaic output power, while the voltage threshold condition determines whether the controller should operate under P&O mode or fuzzy PID mode. This result satisfies the first objective by establishing the overall structure and control logic of the proposed segmented variable-step MPPT framework.
4.2. MATLAB/Simulink-based simulation platform
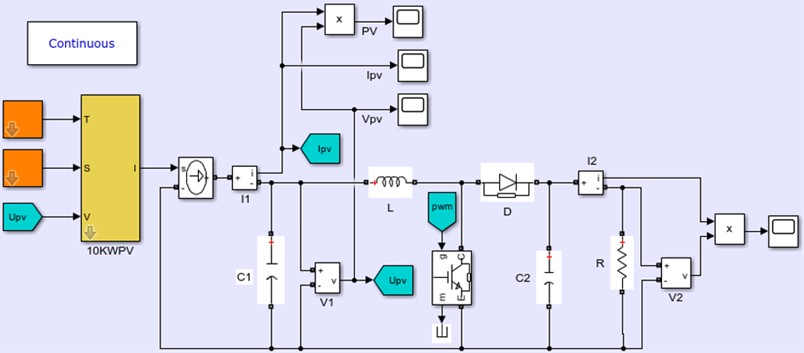
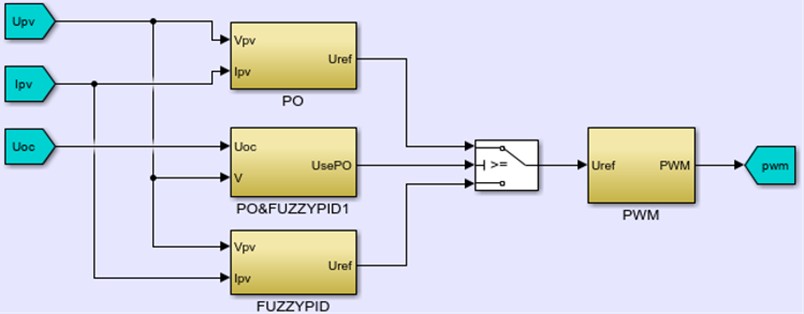
To develop this study, the proposed design was initially implemented on a MATLAB/Simulink based simulation platform incorporating the photovoltaic array model, DC-DC boost converter, voltage and current measurement blocks, MPPT control algorithms, switching logic, and output monitoring components, in order to validate the proposed MPPT control strategy under consistent timing conditions across all controllers.
Fig. 9MATLAB/Simulink simulation model of segmented P&O and fuzzy PID MPPT control framework
a) PV and DC-DC boost converter main circuit
b) Segmented P&O and fuzzy PID MPPT control subsystem
As shown in Fig. 9, the simulation platform integrates the proposed segmented P&O and fuzzy PID MPPT framework into a complete photovoltaic power generation system model. The model enables the controller to receive photovoltaic voltage and current signals, evaluate the operating condition relative to the defined threshold region, and generate the appropriate control response.
The completed simulation platform was used to test the proposed control framework under irradiance and temperature step-change conditions. These simulation conditions provided the basis for evaluating tracking time, dynamic overshoot, steady-state power behavior, and comparative response against conventional P&O and fuzzy PID control methods.
4.3. Simulation-based performance evaluation
The fourth objective of the study was to evaluate the performance of the proposed control framework under varying environmental conditions, including irradiance and temperature step changes. The evaluation focused on tracking time to reach the MPP, steady-state power oscillation, dynamic overshoot, and operating point behavior. The observed improvement in transient response is consistent with the general findings of adaptive, variable-step, and fuzzy-based MPPT studies, which indicate that modifying the control action according to the operating condition can reduce the conventional compromise between tracking speed and steady-state oscillation [9]-[13], [20]. However, direct numerical comparison with these studies is not made because their photovoltaic ratings, converter configurations, environmental profiles, performance definitions, and sampling conditions differ from those used in the present work.
4.3.1. Irradiance and temperature profiles for transient evaluation
Two controlled environmental profiles were applied to evaluate the transient performance of the conventional P&O, fuzzy PID, and proposed segmented MPPT controllers. In the first test, the irradiance was changed in two ideal downward steps while the photovoltaic cell temperature was maintained constant. In the second test, the cell temperature was changed in two ideal downward steps while the irradiance was maintained constant.
The complete irradiance and temperature profiles are presented in Table 9. For the irradiance-transient test, the irradiance was initially set to 1300 W/m2. It was decreased instantaneously to 1000 W/m2 at 0.3 s and subsequently to 700 W/m2 at 0.6 s. The photovoltaic cell temperature was maintained at 25℃ throughout the test. For the temperature-transient test, the cell temperature was initially set to 40 ℃. It was decreased instantaneously to 25 ℃ at 0.3 s and subsequently to 10 ℃ at 0.6 s. The irradiance was maintained at 1000 W/m2 throughout the test.
Only one environmental variable was changed during each test so that the effects of irradiance and temperature disturbances could be evaluated independently. The same environmental profiles, photovoltaic-array model, converter parameters, load condition, initial operating point, controller sampling period, solver configuration, and simulation duration were applied to all three MPPT controllers.
Table 9Irradiance and temperature profiles used for transient performance evaluation
Test case | Time interval (s) | Irradiance (W/m2) | Cell temperature ℃ |
Irradiance variation | 0.0 0.3 | 1300 | 25 |
0.3 0.6 | 1000 | 25 | |
0.6 0.9 | 700 | 25 | |
Temperature variation | 0.0 0.3 | 1000 | 40 |
0.3 0.6 | 1000 | 25 | |
0.6 0.9 | 1000 | 10 |
4.3.1.1. Irradiance step response and MPPT performance
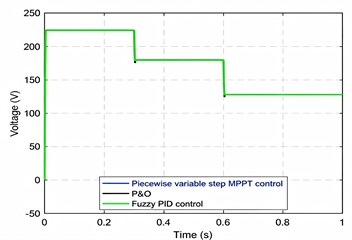
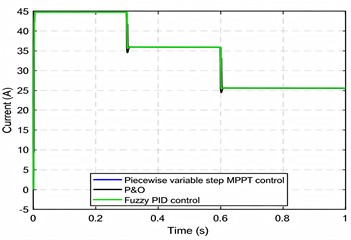
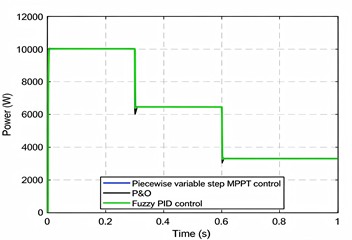
In the dynamic scenario of a stepwise decrease in irradiance (1300 →1000 →700 W/m2) at a constant temperature of 25 ℃, the photovoltaic output characteristics exhibit a clear step-response behavior. Specifically, the output voltage decreases from an initial value of 223 V at 1300 W/m2to 179 V after the irradiance drops to 1000 W/m2 at 0.3 s, and further decreases to 128 V when the irradiance reaches 700 W/m2 at 0.6 s. Similarly, the output current decreases synchronously from 44.7 A to 35.9 A at 1000 W/m2, and then to 25.6 A at 700 W/m2, with its dynamic response closely matching the voltage variations. Consequently, the output power decreases from 10021 W at 1300 W/m2 to 6457 W at 1000 W/m2, and finally stabilizes at 3287 W under 700 W/m2. At 0.3 s, the steady-state tracking error was 0.23 % for P&O, 0.15 % for Fuzzy PID, and 0.14 % for the proposed piecewise variable-step controller, while at 0.6 s, the corresponding steady-state tracking errors were 0.24 %, 0.18 %, and 0.12 %, respectively. These results demonstrate the synchronous attenuation characteristics of the photovoltaic system and confirm the ability of the three MPPT control methods to accurately track and regulate the voltage, current, and power under rapidly changing irradiance conditions, with the proposed controller consistently achieving the lowest steady-state tracking error among the three methods.
Fig. 10Comparison of PV output characteristics under irradiance step changes
a) Output voltage
b) Output current
c) Output power
Table 10Irradiance-step performance indicators at t= 0.3 s
Performance Indicator | P&O | Fuzzy PID | Piecewise variable-step |
Tracking time to MPP (s) | 0.011 | 0.009 | 0.006 |
Dynamic power overshoot (W) | 457 | 115 | 9 |
Steady-state tracking error (%) | 0.23 | 0.15 | 0.14 |
Table 11Irradiance-step performance indicators at t= 0.6 s
Performance Indicator | P&O | Fuzzy PID | Piecewise variable-step |
Tracking time to MPP (s) | 0.014 | 0.012 | 0.010 |
Dynamic power overshoot (W) | 225 | 60 | 6 |
Steady-state tracking error (%) | 0.24 | 0.18 | 0.12 |
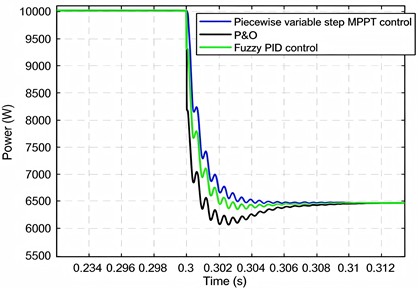
At 0.3 s, the proposed method achieves an MPP tracking time of only 0.006 s, representing improvements of 45.5 % and 33.3 % over the conventional P&O (0.011 s) and Fuzzy PID (0.009 s) methods, respectively. Moreover, its maximum dynamic power overshoot is limited to only 9 W, which is significantly lower than that of the P&O algorithm (457 W) and the Fuzzy PID controller (115 W). The steady-state output power accurately converges to the theoretical maximum of 6457 W, with a tracking error of less than 0.14 %.
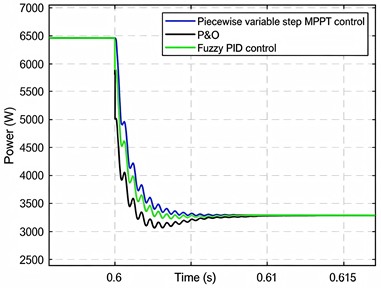
Furthermore, under the second irradiance transition at 0.6 s (1000 → 700 W/m2), the proposed piecewise variable-step MPPT framework continues to exhibit excellent dynamic and steady-state performance. The MPP tracking time is reduced to 0.010 s, which is 28.6 % and 16.7 % faster than the conventional P&O (0.014 s) and Fuzzy PID (0.012 s) methods, respectively. In addition, the maximum power overshoot is restricted to only 6 W, corresponding to merely 2.7 % and 10 % of the overshoot produced by the P&O (225 W) and Fuzzy PID (60 W) methods, respectively. The steady-state output power remains stable at 3287 W with a tracking error of less than 0.18 %. These results demonstrate that the proposed piecewise variable-step MPPT strategy effectively combines rapid dynamic response with minimal steady-state oscillation, thereby significantly improving both tracking speed and tracking accuracy under rapidly varying irradiance conditions. Consequently, the proposed framework is well suited for reliable MPPT operation in complex and highly dynamic photovoltaic environments.
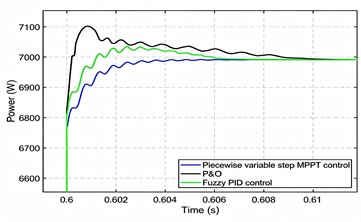
Fig. 11Comparison of photovoltaic output power amplification under irradiance step changes
a) At 0.3 s
b) At 0.6 s
4.3.1.2. Temperature step response and MPPT performance
In the 0.3-second validation of the temperature step descent scenario (40 ℃ → 25 ℃), the piecewise variable-step MPPT framework demonstrates superior performance compared with conventional methods. Specifically, the maximum power point (MPP) tracking time is only 0.00080 s, which is 79.9 % and 55.6 % shorter than the classical P&O (0.00398 s) and Fuzzy PID control (0.00180 s), respectively. Furthermore, the maximum dynamic power overshoot is limited to only 0.436 W, corresponding to just 0.57 % of the overshoot observed with P&O (75.925 W) and 2.52 % of that obtained using Fuzzy PID control (17.285 W).
Table 12Temperature-step performance indicators at t= 0.3 s
Performance Indicator | P&O | Fuzzy PID | Piecewise variable-step |
Tracking time to MPP (s) | 0.00398 | 0.00180 | 0.00080 |
Dynamic power overshoot (W) | 75.925 | 17.285 | 0.436 |
Steady-state tracking error (%) | 0.08 | 0.05 | 0.03 |
Table 13Temperature-step performance indicators at t= 0.6 s
Performance Indicator | P&O | Fuzzy PID | Piecewise variable-step |
Tracking time to MPP (s) | 0.00619 | 0.00371 | 0.00171 |
Dynamic power overshoot (W) | 111.239 | 44.174 | 0.588 |
Steady-state tracking error (%) | 0.09 | 0.04 | 0.03 |
The corresponding steady-state tracking error was 0.08 % for P&O, 0.05 % for Fuzzy PID, and 0.03% for the proposed piecewise variable-step controller. These results demonstrate the significantly enhanced overshoot suppression capability of the proposed piecewise variable-step MPPT framework.
Fig. 12Comparison of PV output characteristics under temperature step changes
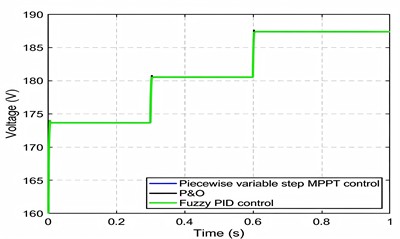
a) Output voltage
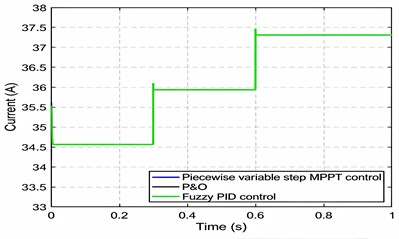
b) Output current
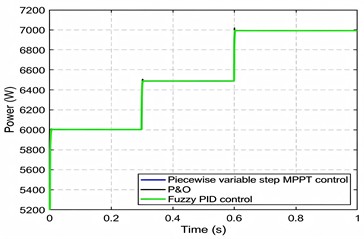
c) Output power
Fig. 13Comparison of photovoltaic output power amplification under temperature step changes
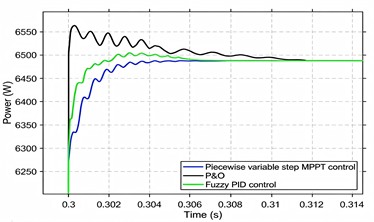
a) At 0.3 s
b) At 0.6 s
Similarly, in the 0.6-second verification of the temperature gradient descent scenario (25℃ → 10 ℃), the proposed framework achieves an MPP tracking time of only 0.0017 s, representing reductions of 72.4 % and 53.9 % compared with the classical P&O (0.0062 s) and Fuzzy PID (0.0037 s) methods, respectively. The maximum power overshoot is constrained to 0.59 W, which is only 0.53% of the overshoot produced by P&O (111.24 W) and 1.33 % of that produced by Fuzzy PID (44.17 W). In addition, the steady-state output power remains stable at 6991.42 W, with a steady-state tracking error of 0.09 % for P&O, 0.04 % for Fuzzy PID, and 0.03 % for the proposed controller.
Table 14Threshold sensitivity analysis under 1300 W/m2 and 10 ℃
Tracking time (s) | Tracking efficiency (%) | Peak-to-peak oscillation (W) | Normalized oscillation (%) | ||
0.73 | 0.88 | 0.0032323 | 100.000 | 221.50 | 2.0414 |
0.74 | 0.89 | 0.0032323 | 100.000 | 221.42 | 2.0407 |
0.75 | 0.90 | 0.0036051 | 100.000 | 228.01 | 2.1015 |
0.76 | 0.91 | 0.0036053 | 100.000 | 227.75 | 2.0990 |
0.77 | 0.92 | 0.0036044 | 100.000 | 228.95 | 2.1101 |
Table 15Threshold Sensitivity analysis under 1300 W/m2 and 40 ℃
Tracking time (s) | Tracking efficiency (%) | Peak-to-peak oscillation (W) | Normalized oscillation (%) | ||
0.73 | 0.88 | 0.0032263 | 100.000 | 193.13 | 2.1012 |
0.74 | 0.89 | 0.0032263 | 100.000 | 193.13 | 2.1012 |
0.75 | 0.90 | 0.0032262 | 100.000 | 193.13 | 2.1012 |
0.76 | 0.91 | 0.0036031 | 100.000 | 202.76 | 2.2060 |
0.77 | 0.92 | 0.0036031 | 100.000 | 202.69 | 2.2052 |
Table 16Threshold sensitivity analysis under 700 W/m2 and 10 ℃
Tracking time (s) | Tracking efficiency (%) | Peak-to-peak oscillation (W) | Normalized oscillation (%) | ||
0.73 | 0.88 | 0.0092605 | 100.000 | 112.42 | 2.2505 |
0.74 | 0.89 | 0.0092605 | 100.000 | 112.42 | 2.2505 |
0.75 | 0.90 | 0.0092605 | 100.000 | 112.42 | 2.2505 |
0.76 | 0.91 | 0.0092605 | 100.000 | 112.42 | 2.2505 |
0.77 | 0.92 | 0.0092605 | 100.000 | 112.42 | 2.2505 |
Table 17Threshold sensitivity analysis under 700 W/m2 and 40 ℃
Tracking time (s) | Tracking efficiency (%) | Peak-to-peak oscillation (W) | Normalized oscillation (%) | ||
0.73 | 0.88 | 0.0092257 | 100.000 | 99.489 | 2.3232 |
0.74 | 0.89 | 0.0092257 | 100.000 | 99.489 | 2.3232 |
0.75 | 0.90 | 0.0092257 | 100.000 | 99.489 | 2.3232 |
0.76 | 0.91 | 0.0092257 | 100.000 | 99.489 | 2.3232 |
0.77 | 0.92 | 0.0092257 | 100.000 | 99.489 | 2.3232 |
The combination of rapid dynamic response and minimal steady-state overshoot significantly enhances both tracking speed and steady-state accuracy under rapidly varying temperature conditions, thereby validating the effectiveness and practical applicability of the proposed piecewise variable-step framework in complex operating environments.
4.3.2. Threshold sensitivity analysis
To determine the most appropriate switching thresholds for the proposed piecewise variablestep MPPT controller, a threshold sensitivity analysis was conducted using five threshold pairs: (0.73, 0.88), (0.74, 0.89), (0.75, 0.90), (0.76, 0.91), and (0.77, 0.92). The threshold pairs were evaluated under four representative operating conditions corresponding to the extreme combinations of irradiance and temperature, namely 1300 W/m2, 10 ℃, 1300 W/m2, 40 ℃, 700 W/m2, 10 ℃, and 700 W/m2, 40 ℃. The objective was to investigate the influence of the switching thresholds on convergence speed, steady-state power extraction, and output stability over the expected operating range of the PV system. The corresponding results are presented in Tables 14-17.
The threshold sensitivity analysis demonstrates that the proposed piecewise variable-step MPPT controller exhibits low sensitivity to moderate variations in the switching thresholds within the investigated range. Across all four operating conditions, the evaluated threshold pairs achieved 100 % relative tracking efficiency, indicating that the controller converged to the same steady-state operating point regardless of the selected threshold values. Consequently, the primary influence of threshold selection was observed in the convergence speed and steady-state oscillation rather than in the amount of power extracted.
Under high-irradiance conditions (1300 W/m2), the threshold pairs of 0.73/0.88, 0.74/0.89, and 0.75/0.90 consistently exhibited the shortest tracking times, whereas increasing the thresholds to 0.76/0.91 and 0.77/0.92 resulted in slightly slower convergence without improving the tracking efficiency. At 1300 W/m2and 10 ℃, the threshold pair 0.74/0.89 produced the lowest normalized steady-state oscillation; however, the difference relative to 0.75/0.90 was less than 0.1 %, indicating that both configurations exhibited nearly identical steady-state behavior. Similarly, under 1300 W/m2and 40 ℃, the threshold pair 0.75/0.90 achieved the fastest convergence while maintaining the same tracking efficiency and oscillation level as the neighboring threshold pairs. Under low-irradiance conditions (700 W/m2), all threshold pairs produced identical tracking times, tracking efficiencies, and steady-state oscillations, indicating that the proposed controller is relatively insensitive to threshold selection when operating under reduced solar irradiance. This suggests that the influence of the switching thresholds becomes more evident under high-power operating conditions, where the transition between the perturb-and-observe and fuzzy PID operating regions has a greater effect on the transient response.
Considering the overall performance across all evaluated operating conditions, the threshold pair of 0.75 and 0.90 was selected for the proposed controller. Although the threshold pair 0.74/0.89 provided marginally lower oscillation under one operating condition, the difference was negligible, whereas 0.75/0.90 consistently achieved equivalent tracking efficiency, comparable or faster convergence, and stable steady-state operation. Furthermore, this threshold pair corresponds to the originally proposed switching boundaries, providing a balanced trade-off between convergence speed, tracking performance, and output stability over the investigated operating range.
4.3.3. Evaluation of the hysteresis-based switching mechanism
To evaluate the effectiveness of the proposed hysteresis mechanism in suppressing switching chatter, a dedicated simulation was conducted using both the original single-threshold switching logic and the proposed hysteresis-based switching logic. The test condition was selected such that the steady-state photovoltaic operating voltage settled very close to the nominal lower switching threshold, . The corresponding environmental and operating conditions were:
The nominal lower switching threshold was calculated as:
Under this condition, the resulting steady-state photovoltaic voltage settled within approximately 0.01 V of . Both switching configurations converged to the same final operating point:
with the fuzzy PID controller active at steady state. This result confirms that the introduction of the hysteresis band does not alter the final tracking condition or the selected steady-state controller mode. The two switching configurations, however, exhibited substantially different transient modeselection behavior. Under the original single-threshold logic, the controller executed 37 transitions between the P&O and fuzzy PID modes during the interval from 5.8 ms to 16.5 ms. All recorded transitions occurred at the nominal threshold voltage:
This behavior is characteristic of switching chatter. Because the operating voltage settled at a value nearly coincident with the switching threshold, small voltage variations repeatedly caused the controller to alternate between the P&O and fuzzy PID modes. The shortest recorded intervals between successive transitions were approximately 0.2-0.3 ms. For the hysteresis-based configuration, the lower activation and deactivation thresholds was 235.06V and 228.87 V . When the same environmental condition was applied, the total number of mode transitions decreased from 37 to 11. The percentage reduction in the number of transitions calculated is 70.27 %.
Fig. 14Photovoltaic-voltage and mode-switching responses near Umin
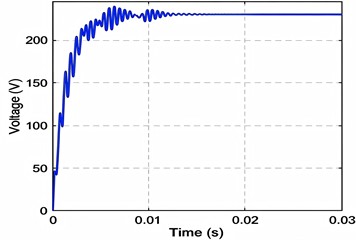
a) Normal threshold
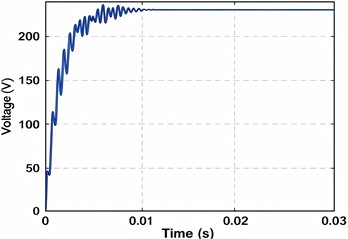
b) Hysteresis-based
In addition, the switching episode was confined to the shorter interval from 5.9 ms to 8.4 ms. Unlike the single-threshold configuration, the transitions did not occur repeatedly at a single voltage. Instead, they occurred near the two hysteresis boundaries, = 235.06 V and = 228.87 V, consistent with the defined activation and deactivation conditions.
Fig. 14 compares the photovoltaic voltage and controller mode obtained using the two switching configurations, while Table 18 summarizes the observed switching behavior. The results demonstrate that the hysteresis mechanism operates as intended.
Instead of responding to every crossing of the nominal lower threshold, the controller requires the operating voltage to traverse the defined hysteresis band before a reverse mode transition is permitted. Consequently, repeated re-triggering at a single threshold voltage is suppressed, while the correct final operating mode and steady-state photovoltaic voltage are preserved.
Table 18Comparison of switching behavior near the lower threshold
Metric | Single-threshold logic | Hysteresis-based logic |
Total mode transitions | 37 | 11 |
Transition voltage (s) | 231.964 V | 235.06 V and 228.87 V |
Switching interval | 5.8-16.5 ms | 5.9-8.4 ms |
Duration of switching episode | 10.7 ms | 2.5 ms |
Minimum interval between transitions | ≈ 0.2-0.3 ms | ≈ 0.06-0.4 ms |
Final steady-state voltage | 231.97 V | 231.97 V |
Final operating mode | Fuzzy PID | Fuzzy PID |
The reduction from 37 to 11 mode transitions, together with the reduction in the switching episode from 10.7 ms to 2.5 ms, provides quantitative evidence that the hysteresis mechanism mitigates threshold-induced chatter. The results also indicate that switching chatter in the proposed segmented MPPT framework is concentrated within narrow transient intervals when the operating voltage settles at or extremely close to a switching boundary. Comparable chatter was not observed during the irradiance and temperature-step tests because, in those cases, the photovoltaic operating point passed through the switching region rather than settling near a threshold.
4.4. Performance under partial shading conditions
To further evaluate the proposed piecewise variable-step MPPT controller, additional simulations were performed under two partial shading conditions (PSC). The first scenario (PSC-1) employed an irradiance distribution of 1000/1000/900 W/m2while the second scenario (PSC-2) reduced the irradiance of the shaded PV array to 700 W/m2. In both cases, the temperature of all PV arrays was maintained at 25 °C, and the controller parameters were identical to those used in the uniform irradiance simulations.
The performance metrics obtained under the two partial-shading conditions are summarized in Table 19. Under PSC-1, the photovoltaic system achieved a maximum power of 7204.85 W at a voltage of 179.72 V. The average steady-state power was 7149.54 W, corresponding to a tracking efficiency of 99.23 %. The maximum power was reached at 0.0911 s. The peak-to-peak and normalized steady-state oscillations were 150.35 W and 2.10 %, respectively, while the standard deviation of the steady-state power was 29.05 W. Under PSC-2, the irradiance applied to the shaded photovoltaic array was reduced from 900 W/m2 to W/m2. Consequently, the maximum power decreased to 6982.87 W, while the voltage at maximum power decreased to 174.36 V. The average steady-state power was 6898.74 W, corresponding to a tracking efficiency of 98.80 %. The maximum power was reached at 0.1166 s. The peak-to-peak oscillation was 119.48 W, corresponding to a normalized oscillation of 1.73 %, while the standard deviation increased to 42.12 W.
Table 19Performance of the proposed MPPT controller under partial-shading conditions
Parameter | PSC-1 | PSC-2 |
Irradiance distribution (W/m2) | 1000/1000/900 | 1000/1000/700 |
Temperature (℃) | 25 | 25 |
Maximum power (W) | 7204.85 | 6982.87 |
Voltage at maximum power (V) | 179.72 | 174.36 |
Time to maximum power (s) | 0.0911 | 0.1166 |
Average steady-state power (W) | 7149.54 | 6898.74 |
Tracking efficiency (%) | 99.23 | 98.80 |
Peak-to-peak oscillation (W) | 150.35 | 119.48 |
Normalized oscillation (%) | 2.10 | 1.73 |
Standard deviation (W) | 29.05 | 42.12 |
Comparison of the two scenarios shows that increasing the irradiance mismatch reduced both the maximum and average steady-state output powers and increased the time required to reach maximum power. Although PSC-2 produced lower peak-to-peak and normalized oscillations than PSC-1, its standard deviation increased from 29.05 W to 42.12 W. This result indicates that the steady-state power samples under PSC-2 were more widely distributed around their mean, despite the lower overall peak-to-peak variation.
4.5. Laboratory-scale hardware validation setup
To validate the proposed control strategy in a practical setting, a hardware prototype of the photovoltaic system was constructed by integrating dual-axis solar tracking and piecewise variable step MPPT control. The prototype was developed to verify whether the proposed control framework could be implemented using actual electronic components and real-time measurements. The experimental hardware was centered around an Arduino Mega 2560 controller, which served as the primary processing unit. As shown in Fig. 15 the complete system integration included the following components: (1) Two NEMA 23 stepper motors driven by dedicated motor drivers for precise panel orientation; (2) A DC-DC buck-boost converter to regulate voltage and current; (3) An ACS712 Hall-effect current sensor and a resistive voltage sensing circuit for real-time data acquisition; (4) A 20×4 LCD module for localized monitoring and a PC-based Serial Monitor for high-resolution data logging.
The DC-DC buck-boost converter serves as a critical power conditioning stage in the proposed photovoltaic system. As shown in Fig. 16, the converter circuit is built around an IRF540 MOSFET as the primary switching element, controlled by a TC4427VPA-ISM gate driver. A 220 µF H inductor and an MBR20100 Schottky diode form the core energy transfer components of the circuit. Input filtering is provided by a 1000 µF capacitor in parallel with a 0.1 µF F capacitor, while the output stage uses a 47 µF F capacitor and a 0.1 µF F capacitor for voltage stabilization. The voltage feedback network, composed of 47 kΩ and 10 kΩ resistors, together with the voltage sensing network, provides feedback signals to the Arduino Mega 2560 through analog input pins. The PWM switching signal is delivered through Arduino digital pin D7 to the gate driver, which regulates the duty cycle based on the piecewise variable-step MPPT algorithm. The buck-boost topology is important because it allows the converter to either step up or step down the photovoltaic output voltage depending on the prevailing irradiance condition. This ensures more stable and continuous power delivery to the load despite fluctuations in the PV input voltage.
Fig. 15Complete hardware prototype
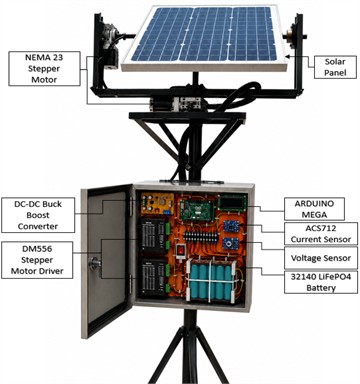
4.6. Hardware performance evaluation
The morning and afternoon experiments provided validation under two different naturally varying outdoor operating periods. The differences in measured photovoltaic voltage, current, power, and controller-mode duration demonstrate that the proposed controller was able to operate under more than one environmental condition. However, each experiment was limited to a 120 s observation period, and only one trial was conducted during each period. Therefore, these results.
should be interpreted as short-duration functional validation rather than long-term reliability evidence. Repeated tests over longer durations, different days, and a wider range of measured irradiance and temperature conditions are required to quantify the repeatability and long-term reliability of the proposed method. The hardware validation results were evaluated using the measured photovoltaic voltage, current, output power, and active MPPT control mode. The results demonstrate that the proposed controller performed voltage-threshold-based switching between the P&O and Fuzzy PID control modes using real-time hardware measurements.
4.6.1. Morning test
The open-circuit voltage measured at the beginning of the morning test was approximately 10.68 V . Accordingly, the lower and upper switching thresholds calculated was 8.01 V for and 9.61V for
Fig. 16 presents the measured photovoltaic voltage during the 120 s morning experiment relative to the calculated switching thresholds. Based on the measured open-circuit voltage of 10.68 V, the lower and upper thresholds were = 8.01 V and = 9.61 V, respectively. During the initial P&O interval from 1 s to 6 s, the photovoltaic voltage increased from 7.90 V to 7.99 V but remained below. At 7 s, the voltage increased to 8.05 V and entered the prescribed near-MPP region, causing the controller to change to Fuzzy PID operation.
Fig. 16Measured PV voltage during morning MPPT mode switching
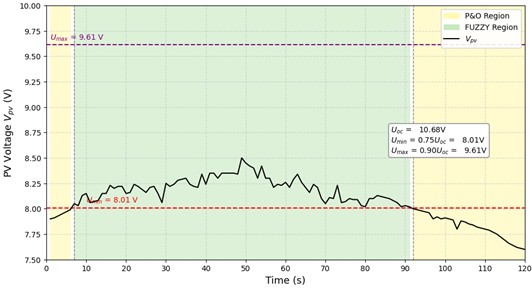
Fig. 17Measured PV power and MPPT control-mode transition during the morning test
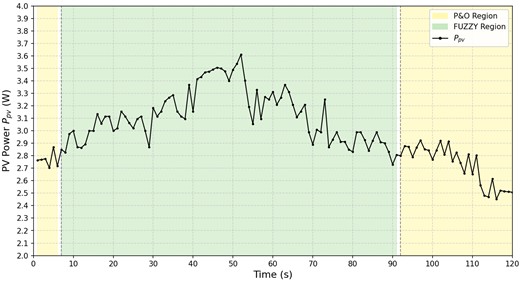
Fig. 18Measured PV voltage during afternoon MPPT mode switching
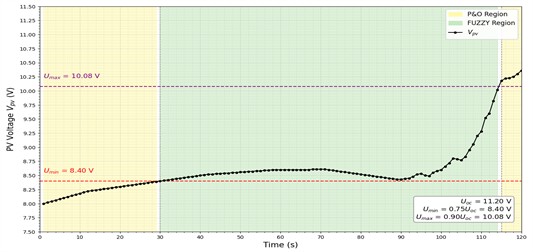
During the Fuzzy PID interval from 7 s to 91 s, the measured voltage ranged from 8.00 V to 8.50 V, with an average value of approximately 8.200 V. The voltage remained considerably below the upper threshold throughout this interval. At 91 s, the voltage decreased to 8.00 V, which was slightly below the lower threshold, while the recorded mode remained Fuzzy PID for that sample. At 92 s, the voltage decreased further to 7.90 V and the controller returned to P&O operation. During the final P&O interval, the voltage ranged from 7.79 V to 8.00 V and ended at 8.00 V. Fig. 18 complements the voltage response by presenting the photovoltaic power measured during the three control intervals identified above. During the initial P&O interval, the power ranged from 2.7030 W to 2.8692 W. During Fuzzy PID operation, the measured power ranged from 2.8240 W to 3.5280 W. The maximum measured power of 3.5280 W occurred at 51 s, when the measured voltage and current were 8.40 V and 0.420 A, respectively.
During the final P&O interval, the power ranged from 2.6588 W to 2.9193 W. At the end of the experiment, the measured voltage and current were 8.00 V and 0.350 A, respectively, corresponding to a final measured power of 2.8000 W. Because the test was conducted under naturally changing outdoor conditions, the observed power variations reflect simultaneous changes in photovoltaic voltage, current, and environmental conditions and should not be attributed solely to the active controller. For descriptive comparison, the average measured power was calculated separately for each recorded control mode. The Fuzzy PID controller was active for 85 samples, giving:
The P&O controller was active for 35 samples, comprising the first six samples and the final 29 samples. Its average measured power was:
Considering all 120 one-second measurement intervals, the overall average photovoltaic power was:
Using the adopted one-second data-logging interval, the corresponding gross photovoltaic energy collected during the morning experiment was:
4.6.2. Afternoon test
For the afternoon hardware test, the open-circuit voltage measured at the beginning of the experiment was approximately 11.2V . Based on this value, the lower switching threshold calculated was 8.40V for while the upper switching threshold calculated is 10.08V for the .
Fig. 19 presents the measured photovoltaic voltage during the 120 s afternoon experiment relative to the calculated switching thresholds. Based on the measured open-circuit voltage of 11.2 V, the lower and upper thresholds were = 8.40 V and = 10.08 V, respectively. During the initial P&O interval from 1 s to 29 s, the photovoltaic voltage increased from 8.00 V to 8.39 V but remained below the lower threshold.
At 30 s, the voltage reached 8.40 V, corresponding to the lower boundary of the near-MPP region, and the controller changed to Fuzzy PID operation. During the Fuzzy PID interval from 30 s to 114 s, the voltage remained within the prescribed threshold range and varied from 8.40 V to 10.02 V, with an average value of approximately 8.631 V.
At 115 s, the voltage increased to 10.18 V, exceeding the upper threshold and causing the controller to return to P&O operation. During the final P&O interval, the voltage continued to increase and reached its maximum measured value of 10.36 V at 120 s. These results demonstrate switching across both voltage boundaries: the controller entered Fuzzy PID operation upon reaching the lower threshold and returned to P&O operation after exceeding the upper threshold. Fig. 20 complements the voltage response by presenting the photovoltaic power measured during the three control intervals identified above. During the initial P&O interval, the measured power increased from 3.8400 W to 4.6984 W. During Fuzzy PID operation, the power ranged from 4.6365 W to 7.15428 W. The maximum power during this interval occurred at 114 s, when the measured voltage and current were 10.02 V and 0.714 A, respectively.
Fig. 19Measured PV power and MPPT control-mode transition during the afternoon test
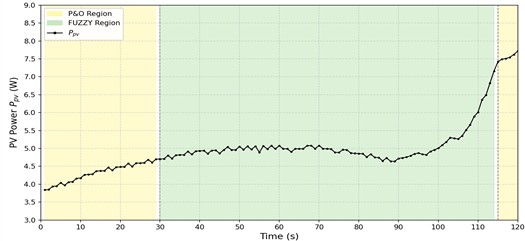
Table 20Summary of the laboratory-scale outdoor test results
Parameter | Morning test | Afternoon test |
Open-circuit voltage, | 10.68 V | 11.20 V |
Switching thresholds, / | 8.01/9.61 V | 8.40/10.08 V |
Initial P&O interval | 1-6 s | 1-29 s |
Fuzzy PID interval | 7-91 s | 30-114 s |
Final P&O interval | 92-120 s | 115-120 s |
Voltage at transition to Fuzzy PID | 8.05 V | 8.40 V |
Voltage at return to P&O | 7.90 V | 10.18 V |
Average voltage during Fuzzy PID | 8.200 V | 8.631 V |
Average photovoltaic power | 3.013574 W | 4.996730 W |
Gross photovoltaic energy | 361.62884 J | 599.60757 J |
Maximum measured power | 3.52800 W | 7.71820 W |
Voltage and current at maximum power | 8.40 V, 0.420 A | 10.36 V, 0.745 A |
Validated switching boundary | Lower boundary only | Lower and upper boundaries |
During the final P&O interval, the power increased from 7.42122 W at 115 s to the overall maximum recorded power of 7.71820 W at 120 s. At this maximum-power point, the measured voltage and current were 10.36 V and 0.745 A, respectively. The increasing power during the later part of the experiment indicates that a greater photovoltaic input became available. However, because calibrated irradiance and photovoltaic cell-temperature measurements were not recorded, this increase cannot be attributed solely to the active MPPT controller. For descriptive comparison, the average measured power was calculated separately for each recorded control mode. The Fuzzy PID controller was active for 85 samples, giving:
The P&O controller was active for 35 samples, comprising the first 29 samples and the final six samples. Its average measured power was:
The average values should be interpreted descriptively rather than as a direct comparison of controller effectiveness because the two control modes operated during different portions of the outdoor experiment and were therefore exposed to different environmental conditions. Considering all 120 one-second measurement intervals, the overall average photovoltaic power was:
Using the adopted one-second data-logging interval, the corresponding gross photovoltaic energy collected during the afternoon experiment was:
The afternoon experiment produced:
more gross photovoltaic energy than the morning experiment. Nevertheless, this difference was obtained from two separate outdoor tests and should not be interpreted as a controlled improvement resulting from either the active MPPT controller or the panel-positioning mechanism.
4.6.3. Comparison of the morning and afternoon results
Table 20 compares the photovoltaic measurements obtained during the morning and afternoon hardware experiments. Both tests were conducted over a 120 s observation period using a one-second data-logging interval. The afternoon experiment produced a higher average photovoltaic power of 4.996730 W, compared with 3.013574 W during the morning experiment. Similarly, the gross photovoltaic energy increased from 361.62884 J in the morning to 599.60757 J in the afternoon, corresponding to an increase of approximately 65.81 %.
The difference between the gross photovoltaic energy measured during the afternoon and morning observation periods was calculated as:
Thus, the afternoon experiment produced approximately 237.98 J more gross photovoltaic energy than the morning experiment. The afternoon test also produced a higher maximum measured power of 7.71820 W, compared with 3.52800 W during the morning test. These differences are consistent with the higher photovoltaic voltage and current recorded during the afternoon observation period.
However, the two experiments represent separate outdoor observations rather than a controlled comparison under identical environmental conditions. Irradiance and photovoltaic cell temperature were not measured using calibrated instruments and may have varied naturally between and during the tests. Therefore, the higher afternoon power and energy should not be attributed solely to the active MPPT controller, the time of day, or the panel-positioning mechanism. The reported energy values represent gross energy generated by the photovoltaic panel. They do not represent the net energy delivered by the complete system because the electrical consumption of the stepper motors, motor drivers, Arduino controller, voltage and current sensors, display, and other auxiliary components was not separately measured or subtracted. The hardware experiments primarily provide functional validation of the proposed segmented MPPT framework. The morning experiment demonstrated transitions across the lower switching boundary, whereas the afternoon experiment demonstrated transitions across both the lower and upper boundaries. Collectively, the results confirm real-time voltage and current acquisition, photovoltaic power calculation, PWM generation, DC-DC converter operation, controller-mode selection, and transitions between P&O and Fuzzy PID operation under different outdoor operating conditions.
4.7. Panel-positioning mechanism used during hardware validation
As shown in Fig. 20, the hardware prototype was capable of dual-axis movement along the horizontal and vertical axes. This mechanism was integrated into the laboratory-scale prototype to provide controlled adjustment of the photovoltaic-panel orientation during hardware testing. Its primary function in the present study was to vary the panel alignment and facilitate observation of the corresponding changes in photovoltaic voltage, current, power output, and MPPT control-mode response. The panel-positioning mechanism and the MPPT controller perform different functions. The positioning mechanism changes the orientation of the photovoltaic panel and consequently affects the incident solar radiation, whereas the MPPT controller regulates the electrical operating point through adjustment of the DC-DC converter duty cycle. Therefore, changes in measured photovoltaic power during the outdoor experiments cannot be attributed solely to either the positioning mechanism or the MPPT controller.
The hardware experiment did not include a simultaneously tested fixed-position photovoltaic panel as a baseline. In addition, plane-of-array irradiance was not measured using a calibrated pyranometer or reference cell, and the electrical energy consumed by the stepper motors, motor drivers, and positioning-control circuit was not recorded separately. Consequently, the gross and net energy contributions of the dual-axis mechanism could not be independently quantified.
Fig. 20Hardware prototype at different photovoltaic-panel orientations
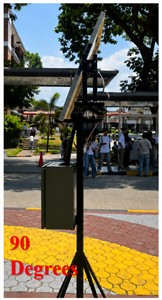
a) At 90 degrees
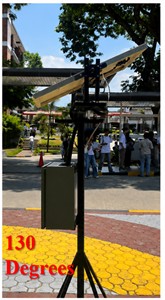
b) At 130 degrees

c) At 180 degrees
Accordingly, the dual-axis system is treated in this study as a panel-positioning mechanism integrated with the MPPT hardware prototype rather than as an independently validated energy enhancement method. The hardware results verify the operation and integration of the positioning mechanism with the photovoltaic controller, but they do not establish that it harvested more energy than a fixed-position photovoltaic system. Independent quantification would require simultaneous or matched testing of fixed and tracking panels under measured irradiance and temperature conditions, together with measurement of the electrical energy consumed by the positioning system.
4.8. Simulation-to-hardware scaling and parameter equivalence
The MATLAB/Simulink model and laboratory-scale hardware prototype were developed at substantially different electrical ratings and for complementary validation purposes. The simulation represents a 10.4 kW photovoltaic (PV) array with a reference open-circuit voltage of 330 V, MPP voltage of 260 V, short-circuit current of 48 A, and MPP current of 40 A. In contrast, the hardware prototype uses a low-power PV panel, with measured open-circuit voltages of 10.68 V and 11.20 V and maximum recorded powers of 3.528 W and 7.718 W during outdoor testing. Therefore, the absolute electrical quantities obtained from the two platforms are not intended for direct comparison; rather, the hardware experiments are used to verify the practical operation and tracking behavior of the proposed control strategy under a different electrical scale.
The simulation was used for controlled quantitative evaluation of conventional P&O, fuzzy PID, and the proposed segmented variable-step MPPT controller. Identical PV, irradiance, temperature, converter, load, initial-condition, sampling, and simulation-duration settings were applied to the controllers, allowing their tracking time, transient power deviation, steady-state oscillation, and operating-point accuracy to be evaluated under consistent conditions.
The hardware prototype, meanwhile, served as a proof-of-concept implementation of the proposed control framework. It verified real-time voltage and current acquisition, PV power calculation, PWM generation, threshold-based controller selection, and transitions between P&O and fuzzy PID modes using an embedded Arduino controller and physical DC-DC converter. Its measured output was affected by outdoor irradiance, panel orientation, converter and load characteristics, sensor limitations, and conversion losses.
Therefore, simulation and hardware results were evaluated according to their respective purposes rather than by direct comparison of absolute electrical values. The simulation established the controller's quantitative performance under controlled conditions, while the hardware demonstrated its real-time functionality and practical implementation. Correspondence between the two platforms was consequently considered in terms of normalized operating variables and control behavior.
5. Conclusions
This study developed and validated a segmented MPPT framework combining large-step P&O for coarse tracking with predictive fuzzy PID control for fine regulation. Based on the findings of the study, the following conclusions were drawn:
1) Under irradiance and temperature step changes, tracking time improved by up to 79.9 % and dynamic overshoot dropped by more than 98 %, relative to conventional P&O and standalone fuzzy PID, while steady-state tracking error stayed below 0.14 %.
2) A sensitivity analysis across four irradiance-temperature extremes confirmed the selected 0.75/0.90 threshold pair achieved 100 % relative tracking efficiency with the fastest or near-fastest convergence, showing the threshold choice was not arbitrary.
3) A hysteresis-based switching enhancement reduced mode-transition chatter by 70.27 % (37 to 11 switches) without changing the final operating point.
4) With bypass-diode protection, the controller sustained tracking efficiencies above 98.8 % under nonuniform irradiance across two partial-shading scenarios.
5) Outdoor hardware trials confirmed real-time, threshold-based mode switching between P&O and fuzzy PID using actual sensor measurements: the morning test validated the lower switching boundary (361.63 J harvested), while the afternoon test validated both boundaries (599.61 J harvested).
Collectively, these results demonstrate that partitioning the MPPT operating range and assigning each region a purpose-built controller effectively mitigates the conventional speed-accuracy trade-off. Although the fuzzy PID controller introduces additional computational operations compared with conventional P&O, its operation is restricted to the selected near-MPP region, while the computationally simpler P&O controller performs coarse tracking outside this region. This selective activation limits the use of the more computationally involved controller while maintaining the demonstrated tracking and convergence performance of the proposed framework.
References
-
M. A. M. Ramli, S. Twaha, K. Ishaque, and Y. A. Al-Turki, “A review on maximum power point tracking for photovoltaic systems with and without shading conditions,” Renewable and Sustainable Energy Reviews, Vol. 67, pp. 144–159, Sep. 2016, https://doi.org/10.1016/j.rser.2016.09.013
-
X. Li, Q. Wang, H. Wen, and W. Xiao, “Comprehensive studies on operational principles for maximum power point tracking in photovoltaic systems,” IEEE Access, Vol. 7, pp. 121407–121420, Aug. 2019, https://doi.org/10.1109/access.2019.2937100
-
M. L. Katche, A. B. Makokha, S. O. Zachary, and M. S. Adaramola, “A comprehensive review of maximum power point tracking (MPPT) techniques used in solar PV systems,” Energies, Vol. 16, No. 5, p. 2206, Feb. 2023, https://doi.org/10.3390/en16052206
-
A. Refaat et al., “Extraction of maximum power from PV system based on horse herd optimization MPPT technique under various weather conditions,” Renewable Energy, Vol. 220, p. 119718, Nov. 2023, https://doi.org/10.1016/j.renene.2023.119718
-
N. Femia, G. Petrone, G. Spagnuolo, and M. Vitelli, “Optimization of perturb and observe maximum power point tracking method,” IEEE Transactions on Power Electronics, Vol. 20, No. 4, pp. 963–973, Jul. 2005, https://doi.org/10.1109/tpel.2005.850975
-
J. Ahmed and Z. Salam, “An improved perturb and observe (P&O) maximum power point tracking (MPPT) algorithm for higher efficiency,” Applied Energy, Vol. 150, pp. 97–108, 2015, https://doi.org/10.1016/j.apenergy.2015.04.006
-
J. Ahmed and Z. Salam, “A modified P&O maximum power point tracking method with reduced steady-state oscillation and improved tracking efficiency,” IEEE Transactions on Sustainable Energy, Vol. 7, No. 4, pp. 1506–1515, 2016, https://doi.org/10.1109/tste.2016.2568043
-
K. Ishaque, Z. Salam, and G. Lauss, “The performance of perturb and observe and incremental conductance maximum power point tracking method under dynamic weather conditions,” Applied Energy, Vol. 119, pp. 228–236, Jan. 2014, https://doi.org/10.1016/j.apenergy.2013.12.054
-
S. K. Kollimalla and M. K. Mishra, “Variable perturbation size adaptive P&O MPPT algorithm for sudden changes in irradiance,” IEEE Transactions on Sustainable Energy, Vol. 5, No. 3, pp. 718–728, 2014, https://doi.org/10.1109/tste.2014.2300162
-
A. Loukriz, M. Haddadi, and S. Messalti, “Simulation and experimental design of a new advanced variable step size incremental conductance MPPT algorithm for PV systems,” ISA Transactions, Vol. 62, pp. 30–38, Aug. 2015, https://doi.org/10.1016/j.isatra.2015.08.006
-
J. Macaulay and Z. Zhou, “A fuzzy logical-based variable step size P&O MPPT algorithm for photovoltaic system,” Energies, Vol. 11, No. 6, p. 1340, 2018, https://doi.org/10.3390/en11061340
-
M. Farhat, O. Barambones, and L. Sbita, “A real-time implementation of novel and stable variable step size MPPT,” Energies, Vol. 13, No. 18, p. 4668, Sep. 2020, https://doi.org/10.3390/en13184668
-
M. Gopahanal Manjunath, C. Vyjayanthi, and C. N. Modi, “Adaptive step size based drift‐free P&O algorithm with power optimiser and load protection for maximum power extraction from PV panels in stand‐alone applications,” IET Renewable Power Generation, Vol. 15, No. 6, pp. 1270–1285, 2021, https://doi.org/10.1049/rpg2.12105
-
M. Mohammadinodoushan, R. Abbassi, H. Jerbi, F. Waly Ahmed, H. Abdalqadir Kh Ahmed, and A. Rezvani, “A new MPPT design using variable step size perturb and observe method for PV system under partially shaded conditions by modified shuffled frog leaping algorithm – SMC controller,” Sustainable Energy Technologies and Assessments, Vol. 45, p. 101056, 2021, https://doi.org/10.1016/j.seta.2021.101056
-
S.-C. Wang, H.-Y. Pai, G.-J. Chen, and Y.-H. Liu, “A fast and efficient maximum power tracking combining simplified state estimation with adaptive perturb and observe,” IEEE Access, Vol. 8, pp. 155319–155328, Aug. 2020, https://doi.org/10.1109/access.2020.3019197
-
N. van Tan, N. B. Nam, N. H. Hieu, L. K. Hung, M. Q. Duong, and L. H. Lam, “A proposal for an MPPT algorithm based on the fluctuations of the PV output power, output voltage, and control duty cycle for improving the performance of PV systems in microgrid,” Energies, Vol. 13, No. 17, p. 4326, Aug. 2020, https://doi.org/10.3390/en13174326
-
P. Manoharan et al., “Improved perturb and observation maximum power point tracking technique for solar photovoltaic power generation systems,” IEEE Systems Journal, Vol. 15, No. 2, pp. 3024–3035, Jul. 2020, https://doi.org/10.1109/jsyst.2020.3003255
-
A. N. Mahmod Mohammad, M. A. Mohd Radzi, N. Azis, S. Shafie, and M. A. Atiqi Mohd Zainuri, “An enhanced adaptive perturb and observe technique for efficient maximum power point tracking under partial shading conditions,” Applied Sciences, Vol. 10, No. 11, p. 3912, Jun. 2020, https://doi.org/10.3390/app10113912
-
C. Hussaian Basha, M. Palati, C. Dhanamjayulu, S. M. Muyeen, and P. Venkatareddy, “A novel on design and implementation of hybrid MPPT controllers for solar PV systems under various partial shading conditions,” Scientific Reports, Vol. 14, No. 1, p. 1609, Jan. 2024, https://doi.org/10.1038/s41598-023-49278-9
-
A. Ghamrawi, J.-P. Gaubert, and D. Mehdi, “A new dual-mode maximum power point tracking algorithm based on the perturb and observe algorithm used on solar energy system,” Solar Energy, Vol. 174, pp. 508–514, Sep. 2018, https://doi.org/10.1016/j.solener.2018.09.013
-
Y.-H. Liu, J.-H. Chen, and J.-W. Huang, “Global maximum power point tracking algorithm for PV systems operating under partially shaded conditions using the segmentation search method,” Solar Energy, Vol. 103, pp. 350–363, Mar. 2014, https://doi.org/10.1016/j.solener.2014.02.031
-
M. A. A. M. Zainuri, M. A. M. Radzi, A. Che Soh, and N. A. Rahim, “Development of adaptive perturb and observe‐fuzzy control maximum power point tracking for photovoltaic boost dc-dc converter,” IET Renewable Power Generation, Vol. 8, No. 2, pp. 183–194, 2013, https://doi.org/10.1049/iet-rpg.2012.0362
-
U. Yilmaz, A. Kircay, and S. Borekci, “PV system fuzzy logic MPPT method and PI control as a charge controller,” Renewable and Sustainable Energy Reviews, Vol. 81, pp. 994–1001, Sep. 2017, https://doi.org/10.1016/j.rser.2017.08.048
-
Q. Guo et al., “Study on Fuzzy-PID control experiment based on prediction model,” Journal of Engineering for Thermal Energy and Power, Vol. 26, No. 3, pp. 343–346, 2011.
-
M. Fannakh, M. L. Elhafyani, and S. Zouggar, “Hardware implementation of the fuzzy logic MPPT in an Arduino card using a Simulink support package for PV application,” IET Renewable Power Generation, Vol. 13, No. 3, pp. 510–518, Dec. 2018, https://doi.org/10.1049/iet-rpg.2018.5667
-
S. Jana, N. Kumar, R. Mishra, D. Sen, and T. K. Saha, “Development and implementation of modified MPPT algorithm for boost converter‐based PV system under input and load deviation,” International Transactions on Electrical Energy Systems, Vol. 30, No. 2, p. 15, 2019, https://doi.org/10.1002/2050-7038.12190
-
C. Ben Regaya, H. Hamdi, F. Farhani, A. Marai, A. Zaafouri, and A. Chaari, “Real-time implementation of a novel MPPT control based on the improved PSO algorithm using an adaptive factor selection strategy for photovoltaic systems,” ISA Transactions, Vol. 146, pp. 496–510, Dec. 2023, https://doi.org/10.1016/j.isatra.2023.12.024
-
S. Farajdadian and S. M. H. Hosseini, “Optimization of fuzzy-based MPPT controller via metaheuristic techniques for stand-alone PV systems,” International Journal of Hydrogen Energy, Vol. 44, No. 47, pp. 25457–25472, Sep. 2019, https://doi.org/10.1016/j.ijhydene.2019.08.037
-
S. Farajdadian and S. M. H. Hosseini, “Design of an optimal fuzzy controller to obtain maximum power in solar power generation system,” Solar Energy, Vol. 182, pp. 161–178, Feb. 2019, https://doi.org/10.1016/j.solener.2019.02.051
-
X. Li, H. Wen, Y. Hu, and L. Jiang, “A novel beta parameter based fuzzy-logic controller for photovoltaic MPPT application,” Renewable Energy, Vol. 130, pp. 416–427, 2018, https://doi.org/10.1016/j.renene.2018.06.071
-
G. W. Hart, H. M. Branz, and C. H. Cox, “Experimental tests of open-loop maximum-power-point tracking techniques for photovoltaic arrays,” Solar Cells, Vol. 13, No. 2, pp. 185–195, Mar. 2003, https://doi.org/10.1016/0379-6787(84)90008-5
-
O. Ibrahim, N. Z. B. Yahaya, and N. Saad, “PID controller response to set-point change in DC-DC converter control,” International Journal of Power Electronics and Drive Systems (IJPEDS), Vol. 7, No. 2, p. 294, 2016, https://doi.org/10.11591/ijpeds.v7.i2.pp294-302
-
M. Khayamy, H. Chaoui, A. Oukaour, and H. Gualous, “Adaptive fuzzy logic control mixing strategy of DC/DC converters in both discontinuous and continuous conduction modes,” Journal of Control, Automation and Electrical Systems, Vol. 27, No. 3, pp. 274–288, 2016, https://doi.org/10.1007/s40313-016-0241-7
-
M. Karuppiah, K. Karthikumar, and A. Arunbalj, “A transformerless buck-boost converter with PID controller (closed loop controller),” in 2017 IEEE International Conference on Intelligent Techniques in Control, Optimization and Signal Processing (INCOS), pp. 1–7, Mar. 2018, https://doi.org/10.1109/itcosp.2017.8303145
-
J. Moreno-Valenzuela, “A class of proportional-integral with anti-windup controllers for DC-DC buck power converters with saturating input,” IEEE Transactions on Circuits and Systems II: Express Briefs, Vol. 67, No. 1, pp. 157–161, Apr. 2019, https://doi.org/10.1109/tcsii.2019.2913336
-
Chihchiang Hua, Jongrong Lin, and Chihming Shen, “Implementation of a DSP-controlled photovoltaic system with peak power tracking,” IEEE Transactions on Industrial Electronics, Vol. 45, No. 1, pp. 99–107, Aug. 2002, https://doi.org/10.1109/41.661310
-
S. Messalti, A. Harrag, and A. Loukriz, “A new variable step size neural networks MPPT controller: review, simulation and hardware implementation,” Renewable and Sustainable Energy Reviews, Vol. 68, pp. 221–233, Oct. 2016, https://doi.org/10.1016/j.rser.2016.09.131
About this article

The authors have not disclosed any funding.
The datasets generated during and/or analyzed during the current study are available from the corresponding author on reasonable request.
Ye Yuan: conceptualization, methodology, software, validation, formal analysis, investigation, data curation, writing-original draft preparation, and visualization. A. Oliver Lexter July Jose: conceptualization, methodology, software, validation, formal analysis, investigation, resources, writing-review and editing, visualization, supervision, project administration, and funding acquisition.
The authors declare that they have no conflict of interest.

