Abstract
Bolt connection failure of transmission towers poses threats to power grid operation safety. Aiming at the limitations of high cost and long cycle for full-scale tower tests, this paper takes a 330 kV dry-type terminal tower as the prototype and develops a 1:25 geometric scale-down test model with a height of 2.2 m according to similarity theory. Comparative tests on bolt loosening are carried out by active excitation via hammering the tower foot. Acceleration amplitude spectrum, sub-band energy ratio and spectral entropy are adopted to analyze vibration signals, so as to explore the variation rules of vibration response before and after bolt loosening. Different from acoustic-based methods that identify loose bolts through high-frequency radiation features and sound-source localization, this paper focuses on low-frequency modal-band vibration signals and realizes quantitative evaluation of the bolt-loosening state. The test results show that after bolt loosening, the spectral pattern within the 40-200 Hz band changes from “single-peak prominent type” to “multi-peak dispersed type”. The vibration amplitude of mid-low frequency rises, and vibration energy migrates from high-order modes to low-order modes. Both sub-band energy ratio and spectral entropy exhibit favorable channel consistency and damage discrimination capability, and can complement each other as quantitative detection indicators for tower bolt loosening. This research can provide experimental references for vibration-based detection of bolt loosening in transmission towers.
1. Introduction
Transmission towers are indispensable components of power grids, supporting overhead power lines and guaranteeing long-distance continuous power transmission. Long-term exposure to wind loads, ice coating, temperature alternation and dynamic conductor tension brings sustained alternating loads that easily cause bolt loosening at connection joints and further reduce joint stiffness [1, 2]. In severe cases, tower deformation or even collapse may occur, resulting in heavy economic losses. Therefore, detection of bolt-loosening status is of practical significance for ensuring safe operation of power grids.
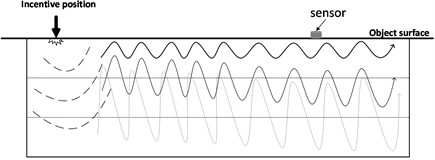
The basic principle of active excitation detection is illustrated in Fig. 1: an external force (impact hammer, shaker, piezoelectric excitation, etc.) generates low-frequency high-energy acoustic-vibration waves that excite transient dynamic responses; as structural conditions change, the corresponding frequency components vary, enabling state identification. Huda et al. [3] diagnosed bolt loosening via non-contact laser excitation. Nicholas et al. [4] verified bolt-loosening measurement feasibility using accelerometer data. Cao et al. [5] identified loosening of composite bolted connections under high-temperature vibration. Liu et al. [6] established detection criteria for a 110 kV tower via wavelet-packet energy-spectrum analysis. Wan et al. [7] proposed a complete-loosening detection method based on correlation-coefficient features. He [8] adopted single-point shock-wave excitation and analyzed low-order response peak positions.
Fig. 1A schematic diagram of active excitation detection principle
The above studies confirm the effectiveness of acoustic-vibration detection for tower bolt loosening. However, most arrange sensors adjacent to loose bolts; for inspection, bolt loosening should be identified using only tower-foot vibration signals. Moreover, existing acoustic-based methods generally aim at detecting the presence of looseness or locating loose bolts via high-frequency noise features, whereas quantitative evaluation of the bolt-loosening state based on low-frequency modal-band vibration signals deserves further investigation.
Full-scale tower tests suffer from high cost, long duration and site constraints. This paper therefore designs a 2.2 m-high 1:25 geometric scale-down model based on dimensional similarity theory, taking a 55-m-high 330 kV dry-type terminal tower as the prototype. Simulated bolt-loosening tests under impact-hammer excitation are analyzed using acceleration amplitude-spectrum, sub-band energy-ratio and spectral-entropy analyses, and the spectrum is found to transform from “single-peak prominent type” to “multi-peak dispersed type” after loosening.
2. Test scheme
2.1. Parameters of scale-down tower model
Transmission towers are high-rise space truss structures whose design relies largely on empirical formulas; their actual bearing capacity and dynamic characteristics need experimental verification. Full-scale loading tests are expensive, time-consuming and site-restricted, whereas scale-down model tests designed by similarity theory reproduce prototype mechanical behaviors at greatly reduced cost and test cycle.
The prototype is a 330 kV double-circuit terminal angle tower of hot-rolled angle steel, a typical space-truss system composed of four tower legs, lower tower body and tower head. Equivalent scaling is implemented: the model is made of Q235 steel with an overall height of 2.2 m, and the main and diagonal members adopt L40×5 and L20×3 angle steel, respectively. The member sections are selected by the equivalent-stiffness principle, because the theoretical sections strictly scaled from the prototype (main members L200×20 and diagonal members L110×10), i.e., L8×0.8 and L4.4×0.4, are unavailable in the market. The model tower has a tapered body with a bottom cross-section side length of about 0.7 m and a top side length of about 0.1 m. The tower feet are fixed through a 10 mm-thick steel base plate bolted to the ground anchors of the test bed to simulate the fixed boundary condition; node plates and non-load-bearing members are omitted, and the main and diagonal members are connected directly by bolts.
2.2. Test procedures
Impact excitation is applied to the No. 2 tower foot, with the striking position 0.15 m above the base surface. Eight piezoelectric accelerometers are deployed on the four tower legs, forming an eight-channel synchronous vibration measurement network in a single-input-multiple-output (SIMO) scheme. Impact onsets are automatically detected by an adaptive threshold based on the background-noise RMS, and the effective 1.5 s vibration segment after each impact is intercepted for frequency-domain analysis. Specific test steps are as follows:
Sensor deployment: Two vibration sensors are installed on each of the four tower legs at heights of 0.3 m and 0.45 m above ground, and their positions remain unchanged throughout all tests. The sensors are fixed with magnetic bases, and the measurement direction of each channel is kept consistent throughout all tests.
Background test: Wind speed, inherent tower vibration and background noise are measured for 15 s at a 65.536 kHz sampling rate. The first 1.0 s of the record contains no impact excitation and serves as the background-noise segment; its RMS value establishes the adaptive threshold for automatic impact-onset detection.
Two bolts connecting main members and diagonal bracing above the No. 1 tower leg at 1.5 m height are completely loosened. The lower part of the No. 1 tower foot (identical to the bolt-loosening tower foot) is struck with a ball-peen hammer, and vibration signals are recorded for 15 s at 65.536 kHz; each condition is tested twice. The broadband transient pulse of each impact excites multi-order modal vibrations, and the intercepted 1.5 s analysis segment covers the main decay process of the scale-down tower (about 1.2 s).
Keeping the bolts loose, the No. 2 tower foot (adjacent to the bolt-loosening tower foot) is struck and Step 3 is repeated.
Keeping the bolts loose, the No. 3 tower foot (opposite to the bolt-loosening tower foot) is struck and Step 3 is repeated.
3. Analysis of test results
3.1. Frequency-domain analysis of bolt loosening based on acceleration amplitude
Impact excitation features simple equipment and convenient operation, suitable for on-site inspection. Its broadband transient pulses excite multi-order modal vibrations, and the local stiffness variation induced by bolt loosening is directly reflected in amplitude changes of corresponding frequency bands. This section extracts frequency-domain features via signal preprocessing, automatic impact-onset detection and amplitude-spectrum calculation.
Frequency-domain analysis converts time-domain vibration signals into amplitude distribution over frequencies, explicitly demonstrating energy magnitudes of different frequency components. Fast Fourier Transform (FFT) is adopted in this work to compute single-sided amplitude spectra. For a discrete time series of length N, the Discrete Fourier Transform (DFT) is defined as in Eq. (1):
where is the frequency index and is the corresponding frequency. FFT is an efficient algorithm for DFT, reducing the computational complexity from to .
Due to conjugate symmetry of DFT for real-valued signals, only the first half of the spectrum is required to retain complete frequency information, and amplitude correction is performed for the single-sided spectrum to satisfy energy conservation.
Such resolution enables clear discrimination of modal frequencies of the scale-down tower.
Since the first six modal frequencies of the scale-down tower fall within 40-200 Hz and bolt loosening mainly affects low-order modal responses in this band, 40-200 Hz is selected as the main analysis frequency range.
Three excitation positions are set: directly below the loose bolt (No. 1), adjacent (No. 2) and opposite (No. 3). Three repeated tests are run under bolt-tight conditions and two under bolt-loosening conditions for each position, and the spectra of both states are compared.
Three repeated impact-excitation tests under bolt-tight conditions show good consistency and similar trends among the three groups, with relatively low amplitude values, verifying the favorable repeatability and stability of the test system.
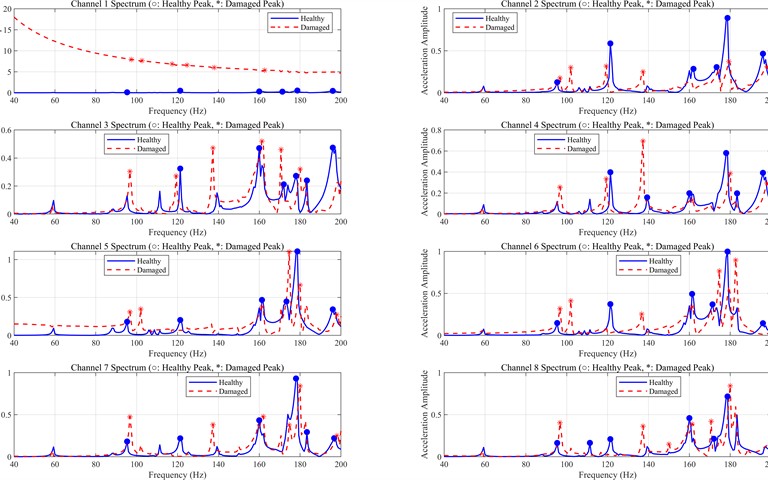
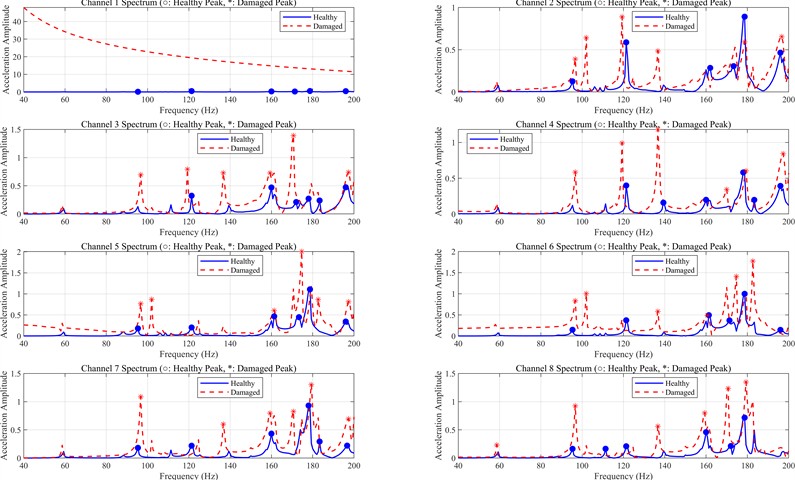
Fig. 2 shows acceleration-amplitude spectra of eight sensor channels under both states. Bolt loosening brings a remarkable increase in response amplitude at the primary excitation position: red (loosening) curves exhibit obviously higher levels within 40-200 Hz across Channel 1 than blue (tight) curves, with similar patterns for other channels and excitation positions.
Bolt loosening notably transforms the amplitude-spectrum morphology: mid-low-frequency (40-160 Hz) amplitude generally rises with more secondary peaks, while the relative amplitude of the dominant high-frequency peak (around 160-200 Hz) decreases, changing the overall spectrum from “single-peak prominent type” to “multi-peak dispersed type”, owing to the dramatic reduction of connection-interface stiffness.
Fig. 2Frequency-domain amplitude comparison between excitation on the tower foot directly below loose bolts and bolt-tight condition
a) Loose bolts
b) Bolt-tight
3.2. Quantitative analysis of frequency-domain features
Qualitative observation of amplitude spectra cannot support automatic identification and quantitative evaluation of bolt-loosening states. Therefore, sub-band energy-ratio and spectral-entropy analyses are carried out on frequency-domain amplitude curves for quantitative characterization.
Distribution of vibration-signal energy across frequency sub-bands reflects variations in structural dynamic characteristics. Bolt loosening alters structural stiffness distribution and triggers energy redistribution over frequency bands. To quantify such redistribution, the 40-200 Hz analysis band is evenly divided into four sub-bands: 40-80 Hz, 81-120 Hz, 121-160 Hz and 161-200 Hz, and the frequency-domain energy of each sub-band is defined as the sum of squared amplitudes of its frequency bins.
Sub-band energy ratios are calculated for all eight channels under both states to quantify the energy redistribution.
Analyses of sub-band energy ratios reveal that under bolt-tight conditions, vibration energy concentrates in the high-frequency band 161-200 Hz (above 80 %), while the three lower bands account for below 20 %. After loosening, the high-band energy ratio drops to approximately 50 % and energy migrates from high-order toward low-order modes, because loosening reduces joint stiffness, making low-order modes easier to excite while high-order-mode energy decays faster.
Spectral-entropy values of the eight channels are calculated under both states together with the loosening/tight ratio.
Spectral entropy rises after bolt loosening: all eight channels increase by 1.3 % to 20 %, with an average increment above 7 %, indicating that loosening complicates and disperses the spectra with richer frequency components and validating the “single-peak prominent” to “multi-peak dispersed” transformation.
The spectral-entropy variation exhibits favorable channel consistency across all channels, showing good stability and damage-discrimination capability and insensitivity to sensor locations.
Sub-band energy ratio and spectral entropy are complementary: the former reflects energy distribution over frequency intervals, while the latter quantifies overall spectral complexity and disorder; jointly, they enable more accurate bolt-loosening identification.
In summary, both indicators effectively capture frequency-domain variations caused by bolt loosening, with clear physical meanings and satisfactory discrimination capability, providing valid feature inputs for subsequent intelligent identification.
4. Conclusions
Taking a 55-m-high 330 kV dry-type terminal tower as the prototype, this paper designs a 1:25 scale-down model of 2.2 m height and conducts simulated bolt-loosening tests using the three frequency-domain analyses. Main conclusions are drawn as follows:
A bolt-loosening identification method based on frequency-domain acceleration amplitude under hammer excitation is established: after loosening, the 40-200 Hz spectrum transforms from “single-peak prominent type” to “multi-peak dispersed type”, with mid-low-frequency amplitude rising and the response amplitude at the primary excitation position growing remarkably.
A quantitative evaluation method based on sub-band energy ratio and spectral entropy is proposed. Under bolt-tight conditions, vibration energy concentrates in the high-frequency band 161-200 Hz (over 80 %); after loosening, the high-band energy ratio drops to approximately 50 %, and spectral entropy of all channels increases with an average increment over 7 %. Both indicators possess favorable channel consistency and damage-discrimination capability and can be combined for quantitative bolt-loosening assessment.
References
-
M. H. N. Izham, M. S. M. Sani, M. N. Abdul Rani, and M. A. Yunus, “Damage assessment on frame structure with bolted joints based on experimental modal analysis,” IOP Conference Series: Materials Science and Engineering, Vol. 469, No. 1, p. 012102, Jan. 2019, https://doi.org/10.1088/1757-899x/469/1/012102
-
J. Yang, Y. Xu, and F. Wu, “Research on loosening mechanism of fixed bolts,” (in Chinese), Mechanical and Electrical Engineering Technology, Vol. 52, No. 9, pp. 187–191, 2023.
-
F. Huda, I. Kajiwara, N. Hosoya, and S. Kawamura, “Bolt loosening analysis and diagnosis by non-contact laser excitation vibration tests,” Mechanical Systems and Signal Processing, Vol. 40, No. 2, pp. 589–604, Jun. 2013, https://doi.org/10.1016/j.ymssp.2013.05.023
-
G. Nicholas, R. Mills, W. Song, H. Lee, and R. Dwyer-Joyce, “Feasibility of using low-sampled accelerometer measurements for bolt joint looseness detection,” IET Renewable Power Generation, Vol. 16, No. 13, pp. 2762–2777, 2022, https://doi.org/10.1049/rpg2.12512
-
Z. Cao, Z. Tan, D. Jiang, and Y. Liu, “Discrimination of bolt-joint loosening under high-temperature vibration environment based on time-frequency analysis,” (in Chinese), Journal of Vibration and Shock, Vol. 38, No. 17, pp. 205–210, 2019.
-
J. Liu, X. Wang, and B. Jia, “Detection method for complete bolt loosening of transmission towers based on wavelet-packet energy spectrum,” (in Chinese), Hebei Electric Power Technology, Vol. 42, No. 1, pp. 84–89, 2023.
-
S. Wan, D. Jia, R. Sun, and Y. Zhang, “Research on complete-loosening detection method for transmission-tower bolt connections based on correlation-coefficient features,” (in Chinese), Chinese Journal of Construction Machinery, Vol. 20, No. 2, pp. 173–177, 2022.
-
B. He, M. Wang, Y. Zhang, and J. Yu, “Research on the detection technology of transmission tower bolt loosening based on vibration signals,” (in Chinese), Journal of Functional Materials and Devices, Vol. 25, No. 3, pp. 214–219, 2019.
About this article

This research was supported by the Shaanxi Provincial Natural Science Foundation of China [Grant Number: 2025JC-YBMS-604].
The datasets generated during and/or analyzed during the current study are available from the corresponding author on reasonable request.
The authors declare that they have no conflict of interest.

