Abstract
This paper presents the results of research carried out on the basis of vibration analysis for propulsion systems of ships used on the same basin. Six propulsion systems, identical in terms of mechanics, placed on three seagoing vessels, have been analyzed. The considered files have been divided into catalogues, separately for each measurement point, each direction, each rotational speed, and separately for usable and unusable shaft lines. Thus, it was possible to obtain vibration time histories of particular shaft lines for every combination point/direction/rotational speed. The mean value and standard deviation have been calculated separately for usable and unusable shaft lines and for each combination and each calculated characteristic. Next, a characteristic of time histories were calculated in the time domain: integral, mean value, energy, mean power (rms squared), simple moment of I order, simple moment of II order, central moment of I order, central moment of II order, normalized simple moment of I order, normalized simple moment of II order, normalized central moment of I order, normalized central moment of II order, an abscissa of the signal square gravity center, variance of the signal square, the signal equivalent diameter. It has been established that the characteristic is of concentrated type for standard deviation lower than 15 % of the mean value. On this basis the abscissa of the signal square gravity center, variance of the signal square and the value of normalized correlation function have been determined. A module and the sum of standard deviations have been calculated from the difference of mean values for usable and unusable objects have been calculated for each combination and characteristic. Basing on this it has been determined whether a given characteristic is reliable, that is, whether the module from the difference in mean values is higher than the sum of standard deviations.
1. Introduction
The tests were performed on base minesweepers of 207 P-type – Fig. 1. The objects of this type are used on the same basin and the research was performed in similar weather conditions with not more than 2. Beaufort at the sea as waves hitting the hull could cause significant changes in values of the recorded vibrations.
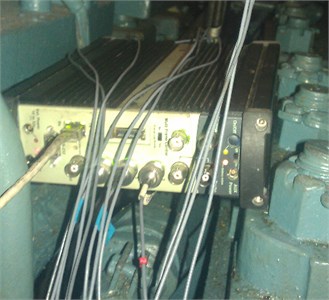
Three identical accelerometers (B&K 4514B) were used for measurements. They were mounted on three mutually perpendicular axes. As there was no possibility to use a threaded joints the converters were fixed to the tested components of the propulsion system by means of glue –Fig. 2. Measurement tracks were calibrated before and after measurements. The whole procedure was carried out according to [3] and branch norm [4]. All the recorded signals were synchronized by means of a four-channel measurement card cage Fig. 3.
Vibration accelerations were recorded in the range of 3.2 kHz band and with sampling frequency 8192.
Before being analyzed the recorded data was divided into catalogues, separately for each measurement point, for each direction, for each rotational speed and separately for usable and unusable shaft lines. In this way, each particular shaft line was provided with vibration time histories, for each combination –point/direction/rotational speed. The mean value and standard deviation were calculated for each combination and each of the calculated characteristics, separately for usable and unusable shaft lines. Next, characteristics of time histories were calculated in the time domain: integral, mean value, energy, mean power (rms squared), simple moment of I order, simple moment of II order, central moment of I order, central moment of II order, simple normalized moment of I order, normalized simple moment of II order, normalized central moment of I order and normalized central moment of II order, abscissa of the signal square center of gravity, variance of the signal square and the signal equivalent mean value. It was established that the characteristic is of concentrated type for standard deviation lower than 15 % of the mean one. On this basis, an abscissa of the signal square gravity center, variance of the signal square and the normalized value of the signal correlation function were determined. A module and the sum of standard deviations were calculated from the difference of mean values for usable and unusable shaft lines for each combination and characteristic.
Fig. 1Research object under tests [5]
![Research object under tests [5]](https://static-01.extrica.com/articles/10066/10066-img1.jpg)
Fig. 2Places on a resistance-carrier bearing where accelerometers were fixed with marking of measurement directions
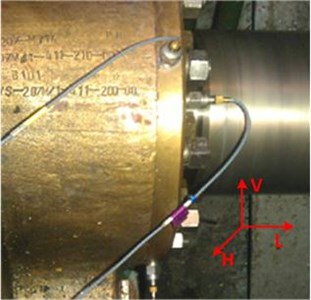
Fig. 3Apparatus used for measurement s B&K 3560-B-120
This provided the basis for inference whether a given characteristic is reliable, that is, whether the module from the difference of mean values is higher than the sum of standard deviations.
2. Analysis of recorded data
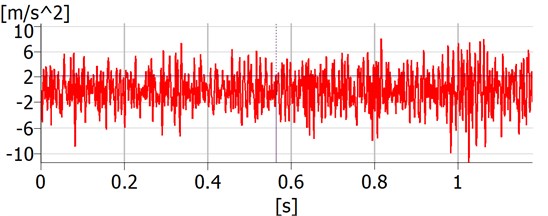
Four time histories of vibration accelerations were recorded for shaft lines of propulsion systems of four vessels in four measurements Fig. 4. Those histories were recorded in csv format files. 150 files were obtained in result of the recording. Since vibrations were recorded on different objects by different research groups the files differed in terms of name, length and content.
The vibration accelerations were recorded for four research objects, two drive shaft lines of three objects and one shaft line for one research object and six measurement points on each shaft line. Measurement points were localized on the most important components of shaft lines, that is, two on the main engine, one on a hydro-kinetic clutch, two on a reverse reduction transmission and one on a resistance – carrier bearing. Additionally, the recording was performed for four rotational speeds and in three axes, separately. Six shaft lines were in the state of usability and one was not.
Fig. 4Fragment of vibration acceleration history recorded during measurements, cursor values – X: 0.564 s, Y: 2.204 m/s2
In order to enable automatic processing of the recorded data all the files were saved in one catalogue under names consistent with the schemesssss_bbb_pp_oooo_d.csv where sssss – name of ship coded on 5 signs (goplo, mamry, mamr2, sniar); bbb – shaft line coded on 3 signs (llw, plw); pp – number of measurement point coded on 2 (01,02,03,04,05,06) numbers for the left board were changed like for the right board that is 07→01, 08→02, 09→03, 10→04, 11→05, 12→06; oooo – rotational speed coded on 4 signs 0850, 1100, 1300, 1500; d – symbol of axis coded on 1 sign on v, h, l. Next, the files were divided in such a way that each of them included 1024 measured values. After an analysis of the obtained files it turned out that the last files, created in result of division of initial files into groups with 1024 measurements each, contained fewer measurements. These files were not subjected to further analysis. In this way 252 files of usable shaft lines and 68 files of unusable shaft lines were obtained for each combination – measurement point – vibration axis-rotational speed (PP-OD-PO). Each file contained the same number of measurement. Altogether, 27846 files were obtained.
It was found that each time history of recorded vibrations is a discrete signal expressed in the time domain – denoted as . For each of the histories [1, 2] the signal integral [] was calculated, the signal mean value <>, the signal energy , the signal mean power , simple moment of I order , simple moment of II order , central moment of I order central moment of II order , normalized simple moment of I order , normalized simple moment of II order , normalized central moment od I order , normalized central moment of II order , abscissa of the signal square gravity center , the signal square variance and the signal equivalent diameter .
Moreover, it was defined that the characteristic is concentrated if standard deviation of the characteristic value in a group is lower than 15 % of the mean value (1):
where: – the signal characteristic , – group of signals.
It was also accepted that if the analyzed characteristic of signals was to be considered as characteristic unequivocally defining a shaft line reliability state it needs to be a concentrated characteristic and the absolute value of the difference of the characteristic mean values for signals from the group of usable shaft lines and mean values of the characteristic for signals from the group of unusable shaft lines must be higher than the sum of standard deviations of the signals characteristics for the two groups. This characteristic is referred to as an unequivocal one (2):
where: – characteristic of signal , – group of signals of unusable shaft line – group of signals of usable shaft line.
Next, the mean value and standard deviation were calculated for each group of signals PP-OD-PO for both usable and unusable shaft lines.
The number of groups with signals meeting the condition of concentration and the number of groups with signals meeting the condition of unequivocality were defined on the basis of the calculation results. The results are presented in Table 1.
Table 1Calculation results
Characteristic | [] | <> | ||||||
Number of groups PP-OD-PO meeting the condition of concentration total (%) | 0 | 0 | 76,47 | 76,47 | 0 | 0 | 0 | 0 |
Number of groups PP-OD-PO meeting the condition of ununiqality (%) | 1,47 | 1,47 | 58,82 | 58,82 | 0 | 0 | 0 | 0 |
Characteristic | ||||||||
Number of groups PP-OD-PO meeting the condition of concentration total (%) | 0 | 0 | 1,47 | 0 | 98,52 | 76,47 | 0 | |
Number of groups PP-OD-PO meeting the condition of ununiquality (%) | 0 | 0 | 0 | 0 | 0 | 0 | 0 |
3. Conclusions
On the basis of the above presented tables it was found that among the 15 analyzed characteristics it was only the energy and the signal mean power that fulfilled the condition of concentration and unequivocality. Energy and the signal mean power can be considered as characteristics which unequivocally identify the shaft line reliability state.
Both the abscissa of the signal square gravity center and variance of the signal square meet the condition of characteristics concentration which provides the basis for further research on the signal initial processing in sucha way that these characteristics could be used for unequivocal identification of shaft lines reliability state.
The authors predict that further studies on this type of engineering objects will be performed according to the accepted scheme in order to make identification of reliability state for propulsion systems simpler and more efficient.
References
-
Izydorczyk J., Pionka G., Tyma G. Signal Theory. Introduction. Second Edition Revised and Supplemented. HELION, Gliwice, 2006, (in Polish).
-
Szabatin J. Fundamentals of Signal Theory. WKŁ, Warsaw, 2007, (in Polish).
-
PN ISO 10816-1.
-
NO-20-A500-3.
-
www.mw.mil.pl.
-
Grządziela A., Muślewski Ł. High quality simulation of the effects of underwater detonation impact. Journal of Vibroengineering, Vol. 15, Issue 1, 2013, p. 106-117.
-
Dzitkowski T., Dymarek A. Active synthesis of machine drive systems using a comparative method. Journal of Vibroengineering, Vol. 14, Issue 2, 2012, p. 528-543.
-
Martin P., Strutt J. E., Kinkead N. A review of mechanical reliability modelling in relation to failure mechanisms. Reliability Engineering, Vol. 6, Issue 1, 1983, p. 13-42.
-
Szolc T., Tauzowski P., Stocki R., Knabel J. Damage identification in vibrating rotor-shaft systems by efficient sampling approach. Mechanical Systems and Signal Processing, Vol. 23, 2009, p. 1615-1633.
-
Matuszak Z. Problems of reliability testing gym facilities of ocean transport. Autobusy – Busses, No. 6, 2010, p. 1-8, (in Polish).
About this article

