Abstract
This paper presents comparative assessment of operation quality of drive shaft lines for the same type of seagoing vessels used on the same basin. The assessment has been made on the basis of vibration analysis. The considered objects differ from each other in terms of operation range and time. 3 ships with two shafts of lines each, have been studied. Measurements were taken in 6 measuring points: for 4 engine rotational speeds: 850, 1100, 1300 and 1500. A macro has been developed to be used for division of files into axes and time histories, each including 1024 separate measurements for each point, for every direction, each rotational speed and usable and unusable shaft lines. A correlation characteristic of time histories – normalized value of correlation function for signals suitable and unsuitable in reference to a randomly selected suitable signal, has been calculated for each combination. A characteristic of concentrated type has been accepted for standard deviation lower than 15 % of the average. A module and the sum of standard deviations have been calculated from the difference of mean values of usable and unusable for use objects, for each combination of particular characteristics. It has been assumed that the characteristic is reliable if the module of mean values difference is higher than the sum of standard deviations. Since the concentration of value for normalized correlation function of signals for usable and unusable for use units is relatively high it has been assumed that this characteristic can be worked out so as to provide reliable data to be used for assessment of their operation quality in the analyzed period of time.
1. Introduction
The objects to be considered in this research are ships produced in Poland in the years 1980-1991. In 1989-1994 those ships were modernized, though the main structural components of their drive system were not changed. Totally, 17 objects of this type were manufactured, all of them still are in use. Due to the operating characteristics of these ships, it is crucial to provide them with high reliability. Therefore, attempts have been undertaken to determine their characteristics to be used for identification of the reliability state of their propulsion systems.
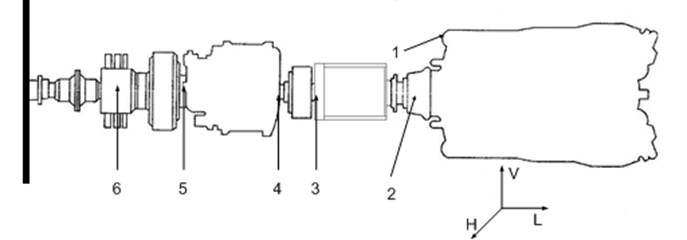
Figure 1 shows a scheme of a propulsionsystem for the ships which are the research objects. Objects of this type have two propulsion systems of this type, situated in a watertight compartment. Both systems are symmetrical to the vessel symmetry plane. The engine fixed on the right board is a right hand rotation engine, whereas the one situated on the left board is a left hand rotation engine. The most important components of the system include:
– Main engine with nominal rotational speed equal to 1550 rev./min and nominal power 736 kW;
– Hydro-kinetic clutch with nominal skid 2 % and skid control range 2-98 %;
– Reverse reduction transmission with ratio 3.5:1;
– Resistance bearing equipped with three rolling bearings.
All the investigations were carried out in similar weather conditions. The Beaufort scale at sea was not more than 2o. Temperature in the marine power plant was about 40°C. [6] Fig. 1 shows a spatial orientation of measurement directions used for measuring.
Fig. 1Scheme of the studied ships drive system: 1 – engine foundation fundament; 2 – power end of engine; 3 – hydro-kinetic clutch; 4 – bearing on the reverse reduction transmission in let; 5 – bearing on the reverse reduction transmission outlet; 6 – resistance carrier bearing
2. Description of the research method
Time histories of drive shaft lines vibrations of four vessels were recorded for the purpose of this research. Those recordings were made in files of cvs format and in this way 150 files were obtained. As the vibrations were recorded on different objects and by different research groups the files were different in terms of name, length and content.
The records of vibrations were performedfor four research objects, two drive shaft lines and six measurement points on each of the shaft lines. Additionally, the recordings covered four rotational speeds and three axes, separately. Six of the shaft lines were usable, whereas one was not.
In order to provide the possibility of the recorded data processing all the files were saved in one catalogue under names consistent with the following scheme: sssss_bbb_pp_oooo_d.csv wheresssss – name of the ship recorded on 5 signs (goplo, mamry, mamr2, sniar); bbb – shaft line coded on 3 signs (llw, plw); pp – number of a measurementpoint coded on 2 signs (01,02,03,04,05,06) numbers for the left board were changed to fitthose on the right board, that is 07→01, 08→02, 09→03, 10→04, 11→05, 12→06; oooo – rotational speed coded on 4 signs 0850, 1100, 1300, 1500; d – symbolof axis coded on one sign v, h, l. Next, the files were divided in such a way that each of them included 1024 measured values. The successive number of the created file was added to the end of the file name and coded on three signs. After an analysis of the created files it appeared that the final files, obtained by dividing the content of the initial filesinto groups with 1024 measurements each, contained only 1011 measurements. Those files were excluded from further analysis. In this way, 252 files for the line of usable shafts and 68 files for the line of unusable shafts were obtained for each combination –measurement point-vibration axis-rotational speed (PP-OD-PO). Each file contained the same number of measurement results.
3. Analysis of experimental tests results
It was established that the time history of recorded vibrations was a discrete signal expressed in the time domain. These signals assume non-zero values only in the finite interval of time axis, thus, beingby definition impulse signals [1]. By computing energy of the signals [2] they were defined to be impulse signals with limited energy. Thus, they can be considered as points of function space where is time which corresponds to the file first measurement and tk corresponds to the last one. This space is defined as a space of impulse signals with limited energy [3]. Extension of the space with a metric, scalar addition and multiplication forms normalized linear Hilbert space [4]. Using the properties of Hilbert space it was defined that a normalized correlation coefficient is a measure of similarity for impulse signals with limited energy.
The value of the normalized correlation coefficient depends on the shift of signals in relation to each other along the time axis. In the case of vibration time historythe signal shift should be of no significance. In connection with this, the value of normalized function of signals correlation was accepted as a measure of similarity for the considered signals.
Time histories of vibration values are real signals. For such signals, a conjugate signal is equal to the prime signal. Hence, the normalized correlation function of time histories for the recorded vibrations assumed the form as follows [5]:
The measure accepted for signals similarity defines the distance of time histories in space, depending on their relative shift along the time axis. When the purpose is to determine the highest similarity of signals, regardless of their shift in time, it is advisable to take the maximum value of the normalized correlation function as a measure of similarity. An analysis of the recorded time histories aims at defining a measure of their distance in space , but this measure should increase along with a growth of the signals distance. For this reason, the following expression was accepted as a measure of distance:
where: – distance of signals , in space .
Next, one of the signals recorded for a given shaft line, was chosen a reference signal for each group of signals PP-OD-PO. On this basis, the signals distance from their reference signal, was calculatedfor each group, according to Eq. (2) then the mean value was calculated from the obtained results as well as a standard deviation.
It was established that the condition necessary for treating the introduced distance of signals as a characteristic unequivocally defining the shaft line reliability stateneeds standard deviation of signalsin one group from their reference signal to be lower than 15 % of the distance mean value. This kind of characteristic is referred to as concentrated characteristics.
It was also accepted that if the introduced distance is to be taken into consideration as a characteristic unequivocally defining the shaft line reliabilitystate it must be a concentrated characteristic and that the absolute value of the difference of signalsmean values in the group of unusable shafts line must be higher than the sum of standard deviations of the signal distances for these two groups. Such characteristic was named an unequivocal one. The obtained results are shown in Table 1. In brackets it can be seen how much the calculated value exceeds the assumed condition for unequivocality.
On the basis of the results contained in the above table it was established that:
– The signals distance determined on the basis of normalized correlation function of the recorded time histories meets the requirements of a concentrated characteristic in more than 90 % of the analyzed cases-thus it can be considered as a characteristic that identifies unequivocally reliability state of drive system shaft lines.
– The distance of signals determined on the basis of normalized correlation function of the recorded time histories does not meet requirements of an unequivocal characteristic as it exceeds the characteristic unequivocality condition by averagely 14 %.
Table 1Calculation results
Number of the measurement point | 01 | 02 | 03 | 04 | 05 | 06 |
Number of groups PP-OD-PO – for usability state | 12 | 12 | 12 | 8 | 12 | 12 |
Number of groups PP-OD-PO meeting the condition of concentration – for usability state | 10 | 11 | 12 | 8 | 10 | 10 |
Number of groups PP-OD-PO –for unusability state | 12 | 12 | 12 | 8 | 12 | 12 |
Number of groups PP-OD-PO meeting the condition of concentration – for unusability state | 10 | 11 | 12 | 8 | 10 | 10 |
Number of groups PP-OD-PO meeting the condition of concentration total (%) | 83 % | 92 % | 100 % | 100 % | 83 % | 83 % |
Number of groups PP-OD-PO meeting the condition for unequivocality | 0 (15 %) | 0 (14 %) | 0 (15 %) | 0 (13 %) | 0 (16 %) | 0 (12 %) |
4. Conclusions
The distance of signals determined on the basis of a normalized value of correlation function of recorded time histories can be considered as a characteristic unequivocally identifying the reliability state of propulsion system shaft lines – however, its application for this purpose needs further research – it is being considered to remove from the recorded signals values exceeding adouble value of the signal standard deviation or to accept the proposed distance assuming an averaged vibration time history of usable shaft lines to be a reference point instead of a randomly chosen one.
References
-
Zieliński T. P. Digital signal processing. From theory to applications. WKŁ, Warszawa 2009, (in Polish).
-
Izydorczyk J., Pionka G., Tyma G. Signal Theory. Introduction. Second edition revised and supplemented. Helion, Gliwice, 2006, (in Polish).
-
Szabatin J. Fundamentals of signal theory. WKŁ, Warszawa 2007, (in Polish).
-
Górniewicz I., Roman S. Mathematical analysis for physicists. Scientific Publishing Nicolaus Copernicus University, Toruń, 2000, (in Polish).
-
Stefański T. Control Theory. Volume II. Discrete systems, nonlinear, stochastic processes and optimization of static and dynamic. Kielce University of Technology, Kielce, 2001, (in Polish).
-
PN ISO 10816-1.
-
Gupta A., Zhou X. Damage quantification using modal parameters. Journal of Vibroengineering, Vol. 9, Issue 2, 2007, p. 263-283.
-
Grządziela A., Kluczyk M. Comparative analysis of vibration characteristics of external shafting in project 767 vessel. Scientific Journal of Polish Naval Academy, Vol. 190, Issue 3, 2012, p. 15-24.
-
Grządziela A., Muślewski Ł. High quality simulation of the effects of underwater detonation impact. Journal of Vibroengineering, Vol. 15, Issue 1, 2013, p. 106-117.
-
Martin P., Strutt J. E., Kinkead N. A review of mechanical reliability modelling in relation to failure mechanisms. Reliability Engineering, Vol. 6, Issue 1, 1983, p. 13-42.
About this article

