Abstract
More and more attentions are paid to the potential effect of graphene oxide (GO) in environment and human beings. In order to evaluate the effect of GO on plant, tobacco BY-2 suspension cells were employed as material, and the physiological effect of GO on tobacco BY-2 suspension cells and its immigration were investigated. The results showed that low concentrations of GO (25 and 50 μg/mL) promoted cells growth (increased by 11.22 % in 50 μg/mL GO), while higher concentrations of GO (100 and 200 μg/mL) induced inhibition in cell growth (decreased by 9.68 % in 200 μg/mL GO). GO caused an increment in activity levels of SOD, POD and CAT, but the activity levels decreased with the extension of culture time in higher concentration. The results showed that GO could make cell nuclei fragment and loose in a higher concentration. These results imply that there is an adverse effect of GO on plant cells, and suggest that nano pollution should be paid attention to.
1. Introduction
Graphene oxide (GO) is one of the most important graphene derivatives and has been extensively studied in recent years [1]. As a “new favorite”, GO has been applied into every aspect of our life, especially in biomedical field, such as biosensor, photothermal therapy and drug delivery due to its good solubility compared to graphene [2]. The forecasted huge increase in the manufacture and the increasing use of GO in industrial and the household applications makes it likely that increasing human and environmental exposure to GO will occur [3].
The interaction between GO and biological systems is developing into a research topic of high importance. So far, the studies on influence of GO mostly focused on mammalian cells. In the SH-SY5Y cell line, GO had no obvious cytotoxicity at low concentration (< 80 μg/mL) for 96 h, but the viability of cells exhibited dose- and time-dependent decreases at high concentration (> 80 μg/mL) [4]. The result in cytotoxicity of different oxidation degrees (GO-high, medium and low) on mouse embryo fibroblasts cells found that lower oxidation degree of GO induced stronger toxicity and a higher level of oxidative stress [5]. The above results on the effect of GO on mammalian cells are still controversial and need further to be researched.
However, the papers of GO-plant cells are few. Only one correlated study reported that 25-100 mg/L GO treatment resulted in shorter seminal root length of Brassica napus L. and the GO treatment had no significant effect on the malondialdehyde (MDA) content [6]. While other studies on carbon nanomaterial-plants interactions showed that root growth of Brassica Juncea was evidently enhanced up to 138 %, 202 % and 135 %, respectively, in the treatment of carbon nanotubes with concentrations of 10 μg/mL, 20 μg/mL and 40 μg/mL [7]. These reports about carbon nanomaterial-plant cell interaction can provide valuable reference to study the impact of GO on plant cells. The BY-2 suspension cell line is a widely used plant model in plant biosciences [8]. In this study, physiological effect of GO on the suspension cell, such as cell growth and vitality, morphology of nuclei and activities of antioxidant enzymes were analyzed.
2. Experimental procedure
2.1. Materials
Tobacco BY-2 suspension cells are obtained from Prof. Zhang from laboratory of plant physiology in Shanghai University. The BCA assay kit, SOD assay kit, POD assay kit, CAT assay kit and LDH assay kit were obtained from Nanjing Jiancheng Bioengineering Institute (Jiangsu, China). Trypan blue dye, 4, 6-diamidino-2-phenylindole (DAPI) were purchased from Sigma-Aldrich (Dt. Louis, USA). Other chemicals were purchased from Guoyao Chemical Reagent Company.
2.2. Preparations and characterization of GO
GO was prepared from natural graphite powder by the modified Hummers method [1]. In brief, graphite (2 g, 500 meshes) and sodium nitrate (1 g) were added to a 250 mL flask and concentrated H2SO4 was added slowly with stirring. Then KnMO4 (7.3 g) and 90 mL of water were added with stirring and at room temperature. Then it was further treated with a mixture of H2O2 (30 %, 7 mL) and water (55 mL). The resulting suspension turned into bright yellow. The obtained solution was centrifuged and the sediment was washed with 3 % aqueous HCL (150 mL) for three times, followed by drying at 40 for 24 h in vacuum. Finally, GO was dispersed in ultra-pure water for 1 h to prepare the stock solution (1.0 mg/mL). The stock solution was sonicated for 1 h (40 kHz, 50 W) and diluted to different concentrations with cell culture medium just prior to the cell exposure.
The GO solution was characterized by X-ray powder diffraction (XRD, SMART APEXII Germany), transmission electron microscope (TEM, 200CX, Japan), atomic force microscopy (AFM, 5500 AFM/SPM, America) and Fourier transform infrared spectroscopy (FTIR, VERTEX70, German).
2.3. Effect of GO on the proliferation and vitality of tobacco BY-2 suspension cells
To characterize the growth and proliferation of cells, tobacco BY-2 suspension cells were grown in liquid MS medium according to the method of Kim [9] under constant shaking (150 rpm) at 27 °C in the dark in 250 ml Erlenmeyer flask. The pH of cultivation media was adjusted to 5.8 with KOH. GO samples were introduced to the cells with a final concentrations of 25 μg/mL, 50 μg/mL, 100 μg/mL and 200 μg/mL after cells were incubated for 3 d. Cells without GO were taken as the control. The cell density of suspension culture was determined by using a Spectrophotometer (BioPhotometer, Germany). Three independent experiments were performed for each condition. The specific growth rate () is defined as the increase in cell mass per unit time, which was calculated using the following formula according to the methods of Ledezma [10]. production rate of cells (cells ) / total number of cells.
The cell vitality was calculated from the cell mortality, which was performed as described by Rujanapun [11]. Before examination, cells were collected and washed twice with 0.1 mol/L phosphate saline buffer (PBS, pH 7.4) and then 400 μL of trypan blue (0.4 %) was added. After 5 min staining, cells were counted using cytometer under a light microscope (CKX31, Japan). The dead cells were stained with blue color. Over 500 cells were counted for each treatment. Each experiment was conducted in triplicate. Cell vitality is expressed as percentage of the live cell number/the total cell number. Three independent experiments were performed for each condition in three times.
2.4. Effect of GO on activities of SOD, POD and CAT in tobacco BY-2 suspension cells
The activities of SOD, POD and CAT were all determined by using assay kits. One unit of SOD activity was defined as the amount that reduced the absorbance at 550 nm by 50 % in per mg tissue protein react with 1 ml reaction liquid. One unit of POD was defined as the enzyme amount that per mg tissue protein catalysis 1 μg substrate. One unit of CAT was defined as the amount that per mg tissue protein decomposes 1 μmol/L H2O2 per second. Cells were collected every day during the culture period and then were homogenated by ultrasonic, after that cell homogenate (20 %) was centrifuged at 3500 rpm for 10 min, the supernatant was used as crude enzymes to be measured. All reagents were introduced following the instructions of the kit. Activities of POD and CAT were measured at the absorbance of 420 nm and 405 nm respectively by using a UV-vis spectrophotometer (U-3900H, Japan). Three independent experiments were performed for each condition.
2.5. Effect of GO on nucleus variation of tobacco BY-2 suspension cells
Cell nucleus morphology was observed using a fluorescence microscope (LBD-65, Germany) by staining the cells with a DNA-binding fluorescent dye, DAPI. After exposed in medium containing different concentrations of GO for 0, 24, 48 h, the cells were collected and centrifuged at 10, 000 rpm for 30 s. Cells were fixed briefly in 70 % (v/v) ethanol, stained with DAPI (10 μg/mL) in 0.1 mol/L PBS (pH 7.4) at room temperature for 15 min in the dark, and then subsequently rinsed twice with PBS. Then cells were observed by a positive fluorescence microscope, and cell images were taken by a charge-coupled device camera equipped with the microscope.
3. Results and discussion
3.1. Characterization of GO
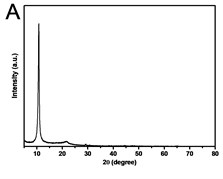
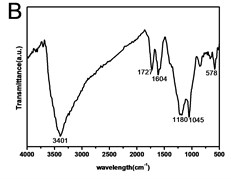
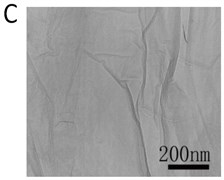
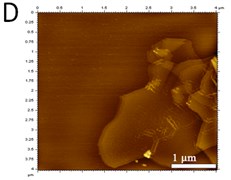
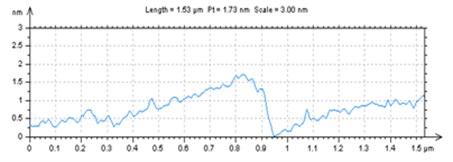
X-ray powder diffraction (XRD) pattern of graphene oxide was shown in Fig. 1(a). The diffraction peak of exfoliated GO was found at 2~10.8° with crystalline orientation of (002) and interlay space (d-spacing) of ~0.82 nm. FTIR spectrum of GO showed that these distinctive peaks of O-H at 3401 cm-1, C=O at 1727 cm-1, C=C at 1604 cm-1, and C-O at 1045 cm-1 (Fig. 1(b)). The fold and lamella structure of GO was characterized by TEM, the dimension of lamella showed thin and basically reached the nanometer size. GO had a crude surface, and the edges exhibited a cascade pattern, which was due to more oxygen-containing functional groups on the surface of GO (Fig. 1(c)). Fig. 1(d) showed the representative AFM images of GO. Most of the GO sheets existed as single or few layers. The thickness of the GO layer was around 1.0 nm. These results confirmed that GO had been successfully obtained.
Fig. 1a) XRD patterns of GO; b) FTIR spectrum of GO; c) TEM image of GO; d) AFM images of GO
3.2. Effect of GO on cell growth and vitality of tobacco BY-2 cells
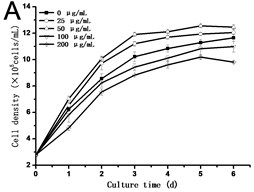
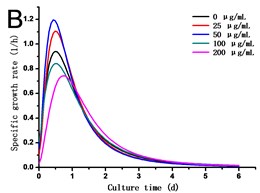
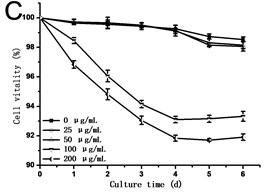
Fig. 2(a) showed that cell density in all experimental groups increased gradually. Low concentrations of GO (25 and 50 μg/mL) promoted cells growth, which was different from the opinion that nanoparticles are always toxic to organisms. However, a dose of higher concentrations of GO (100 and 200 μg/mL) induced inhibition in cell growth. Cell density in the 200 μg/mL GO experimental group was 90.31 % of the control, while it was 1.11 folds of control exposed to 50 μg/mL GO. The specific growth rate () calculated depending on cell density can lively demonstrate the proliferation ability of cells. From Fig. 2(b), a steady increase in was caused along with the culture time, which reached a maximum and then dropped. The maximum specific growth rate () appeared at about 12 h except in the highest concentration of GO group (200 μg/mL), which reaches the at the time of 24 h. The obtained from cells treated with 25 and 50 μg/mL of GO was more than 1.18 and 1.29 folds respectively compared to the control. Fig. 2(c) showed the results of the cell vitality with the treatment of GO. In the case of lower concentrations of GO (25 and 50 μg/mL), cell vitality showed hardly changed in the first four days and slightly less than the control after the fourth day. While cell vitality exhibited a steady decrease during the first four days in the higher concentrations of GO (100 and 200 μg/mL) and then had a tendency to slow down after the fourth day. The similar results were also observed in the research of carbon nanotubes [12, 13]. To the best of our knowledge, it is the first research reported that GO can also stimulate plant cells growth in the lower concentration.
Fig. 2a) Effect of GO on the growth, b) specific growth rate (μ) and c) vitality of the tobacco BY-2 cells. The data was expressed as mean ± standard deviation (S.D.) of three-independent experiments
3.3. Effect of GO on the activities of SOD, POD and CAT in tobacco BY-2 suspension cells
In order to know the response of cells exposed to GO, the activities of SOD, POD and CAT are assessed. As shown in Fig. 3, the activities of SOD, POD and CAT exhibited a similar trend, which rose with the culture time, and reached the highest value in the third day or fourth day, and then dropped. In all of the experimental groups treated with 200 μg/mL GO, the activities of SOD, POD and CAT in cells decreased rapidly after reaching its highest value. In comparison to the control, the highest value in the activity of SOD increased from 42.54 U/mg.prot to 105.57 U/mg.prot on the third day (Fig. 3(a)), and the activity of POD increased from 25.77 U/mg.prot to 69.88 U/mg.prot (Fig. 3(b)), and the activity of CAT increased from 18.22 U/mg prot. to 71.36 U/mg prot. on the fourth day (Fig. 3(c)). The maximum values of SOD, POD and CAT were 2.3, 3.4 and 4.8 folds compared to the control in the 200 μg/mL GO group, respectively. The same results were also discovered in Ni’s studies [14]. Hypersensitive response is one of the most important strategies developed by plants to defend themselves against exogenous stimuli involving all kinds of nanomaterials [15]. The activity variations of SOD, POD and CAT can be attributed to the hypersensitive response. Some studies have the similar opinions [16].
3.4. Effect of GO on nucleus variations of tobacco BY-2 suspension cells
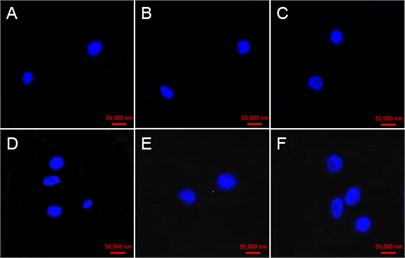
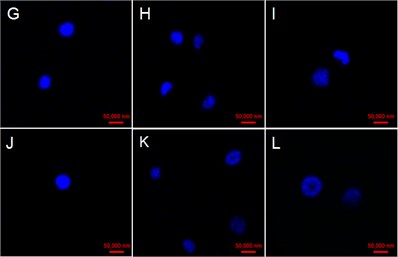
The cell Nucleus at 0 h were round with very high and uniform electronic density with the addition of GO in four concentrations (Fig. 4(a, d, g, j)). Some cell nucleus hollows appeared at 48 h in the case of 25 μg/mL GO treatment (Fig. 4(c)). While some faint nucleus emerged at 24 and 48 h in cells exposed with 50 μg/mL GO (Fig. 4(e) and (f)). Fragmented and serious diffusion cells nuclei were observed at 24 and 48 h with the treatment of 100 μg/mL GO (Fig. 4(h) and (i)). The outline of cell nucleus became unobvious, and the larger hollow area was observed with the treatment of 200 μg/mL GO after 24 h exposure (Fig. 4(k) and (l)).
Fig. 3a) Activities of SOD, b) POD and c) CAT in tobacco BY-2 cells with GO treatment. The cells were exposed to GO for different days. The concentration of GO was 0, 25, 50, 100 and 200 μg/mL. The data was expressed as mean ± standard deviation (S.D.) of three-independent experiments
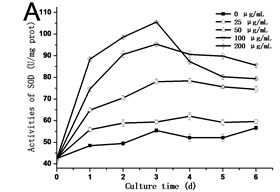
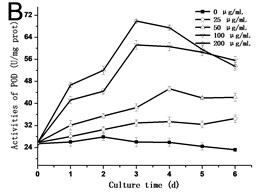
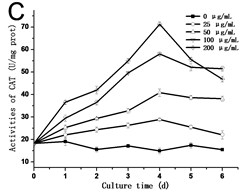
Fig. 4Effect of GO on nucleus variations in tobacco BY-2 suspension cells. The cells were exposed with a)-c)25 µg/mL GO, d)-f) 50 µg/mL GO; g)-i) 100 µg/mL GO; and 200 µg/mL GO j)-l). Time of the four experimental groups is 0, 24 and 48 h
4. Conclusions
From these experimental results, a conclusion can be made that lower concentrations of GO (25 and 50 μg/mL) can promote cells growth, however, GO as a stimuli in higher concentrations can cause a rise in SOD, POD and CAT activity levels by leading to cell apoptosis and inhibit cells growth. It implies that the environmental pollution caused by carbon nanomaterial should be paid high attention to.
References
-
Wang K., Ruan J., Song H., Zhang J. L., Wo Y., Guo S. W., Cui D. X. Biocompatibility of graphene xide. Nanoscale Research Letters, Vol. 6, 2011, p. 1-8.
-
Chong Y., Ma Y. F., Shen H., Tu X. L., Zhou X., Xu J. Y., Dai J. W., Fan S. J., Zhang Z. J. The in vitro and in vivo toxicity of graphene quantum dots. Biomaterials, Vol. 35, 2014, p. 5041-5048.
-
Nowack B., Bucheli T. D. Occurrence, behavior and effects of nanoparticles in the environment. Environmental Pollution, Vol. 150, 2007, p. 5-22.
-
Lv M., Zhang Y. J., Liang L., Wei M., Hu W. B., Li X. M., Huang Q. Effect of graphene oxide on undifferentiated and retinoic acid-differentiated SH-SY5Y cells line. Nanoscale, Vol. 4, 2012, p. 3861-3866.
-
Zhang W. D., Yan L., Li M., Zhao R. S., Yang X., Ji T. J., Gu Z. J., Yin J. J., Gao X. F., Nie G. J. Deciphering the underlying mechanisms of oxidation-state dependent cytotoxicity of graphene oxide on mammalian cells. Toxicology Letters, Vol. 237, 2015, p. 61-71.
-
Cheng F., Liu Y. F., Lu G. Y., Zhang X. K., Xie L. L., Yuan C. F., Xu B. B. Graphene oxide modulates root growth of Brassica napus L. and regulates ABA and IAA concentration. Plant Physiology, Vol. 193, 2016, p. 57-63.
-
Ghodake G., Seo Y. D., Park D., Lee D. S. Phytotoxicity of carbon nanotubes assessed by Brassica Juncea and Phaseolus Mungo. Journal of Nanoelectronics and Optoelectronics, Vol. 5, 2010, p. 157-160.
-
David K. M., Perrot-Rechenmann C. Characterization of a tobacco bright yellow 2 cell line expressing the tetracycline repressor at a high level for strict regulation of transgene expression. Plant Physiology, Vol. 125, 2001, p. 1548-1553.
-
Kim J. H., Jeong M. S., Kim D. Y., Her S., Wie M. B. Zinc oxide nanoparticles induce lipoxygenase-mediated apoptosis and necrosis in human neuroblastoma SH-SY5Y cells. Neurochemistry International, Vol. 90, 2015, p. 204-214.
-
Ledezma P., Greenman J., Ieropoulos I. Maximising electricity production by controlling the biofilm specific growth rate in microbial fuel cells. Bioresource Technology, Vol. 118, 2012, p. 615-618.
-
Rujanapun N., Aueviriyavit S., Boonrungsiman S., Rosena A., Phummiratch D., Riolueang S., Chalaow N., Viprakasit V., Maniratanachote R. Human primary erythroid cells as a more sensitive alternative in vitro hematological model for nanotoxicity studies: toxicological effects of silver nanoparticles. Toxicology in Vitro, Vol. 29, 2015, p. 1982-1992.
-
Hu W. B., Peng C., Lv M., Li X. M., Zhang Y. J., Chen N., Fan C. H., Huang Q. Protein corona-mediated mitigation of cytotoxicity of graphene oxide. ACS Nano, Vol. 5, 2011, p. 3693-3700.
-
Yuan H. G., Hu S. L., Huang P., Song H., Wang K., Ruan J., He R., Cui D. X. Single walled carbon nanotubes exhibit dual-phase regulation to exposed Arabidopsis Mesophyll cells. Nanoscale Research Letters, Vol. 6, 2011, p. 44-52.
-
Ni L. X., Jie X. T., Wang P. F., Li S. Y., Wang G. X., Li Y. P., Li Y., Acharya K. Effect of linoleic acid sustained-release microspheres on Microcystis aeruginosa antioxidant enzymes activity and microcystins production and release. Chemosphere, Vol. 121, 2015, p. 110-116.
-
Almagro L., Ros L. V. G., Belchinavarro S., Bru R., Barceló A. R., Pedreno M. A. Class III peroxidases in plant defence reactions. Journal of Experimental Botany, Vol. 60, 2009, p. 377-390.
-
Lin C., Fugetsu B., Su Y. B., Watari F. Studies on toxicity of multi-walled carbon nanotubes on Arabidopsis T87 suspension cells. Journal of Hazardous Materials, Vol. 170, 2009, p. 578-583.
About this article

