Abstract
The subject matter of the paper is an analysis of the results of acceleration signals measurement obtained from the prototype of Rail Vehicle and Rail Track Monitoring System. The prototype of the system measures acceleration signals on some elements of electric multiple unit, such as bogie frames, wheels and railway vehicles body. The results of measurement were converted to values of statistical parameters, e.g.: an amplitude, a root mean square, a kurtosis coefficient, an interquartile range. The values of diagnostic parameters, when compared with the permissible values, allow to monitor the typical dynamic behaviors of rail vehicle and track condition and to determine a condition of a rail vehicle construction. The main purpose of the analysis described hereby was to determine the usefulness of various diagnostic parameters and to identify the direction of further research connected to condition monitoring and diagnosing of rail vehicles and track.
1. Introduction
Condition monitoring of railway tracks, vehicles are essential in ensuring the safety of railways [1, 2]. Rail Vehicle and Rail Track Monitoring System is one of developed solutions. Monitoring of dynamic behavior of rail vehicles (problem of rail vehicle suspension fault detection) and state of track and diagnose of them are among the main aspects and aims of the system. These actions are realized as result of vibroacoustic signal (values of momentary acceleration signals) measured in determined places in means of transport (such as: railroad cars, segments of electric multiple units and other kinds of rail vehicles), which are explicitly indicated in the patent obtained by the design-research team [3]. The system monitors temperature of axel boxes as well, however it is not subject of discussion in hereby paper. In view of the proper functioning of the system at the stage of its supervised operation, the data obtained from measurements during runs of a rail vehicle (with prototype system installed on a vehicle) were analyzed. Previously, the system was examined on the test track in Żmigród [4].
One of the basic sources of information for the diagnostics of mechanical systems of rail vehicles are vibroacoustic signals, mainly velocity or acceleration. The subject of this paper is an analysis of selected results of acceleration measurement in axle boxes, wheel-set frames and bodies of rail vehicle: electric multiple unit (EMU) ED-74 0001. The prototype of the system was installed on this type of vehicle. Analyses were made on the example of selected routes of Polish railway network. The analysis of signals recorded by the system on selected routes, under supervised operating conditions, concerned diagnostic indicators such as: amplitude, root mean square, kurtosis coefficient and interquartile range.
There are variety of experimental studies, that use methods of analyzing vibroacoustic signals for railway diagnostics. Author of [5] discusses the system for detecting flat spots on a railroad car wheel using accelerometers located on rails. Authors of [6] present similar system (to the one described in this paper) to ensure the safe operation of high-speed electric trains. However, authors propose different sensors locations and their total number as 44:5 points on the current collecting device in two positions which correspond to extreme heights of the catenary, 12 points on car body, 5 points on each bogie frame, 3 points on each wheel set. Masinovic (2017) presents a system that consist of 4 accelerometers. Meanwhile, in the system described hereby, one sensor is mounted on a body, above each bogie, and 2 sensors are on each bogie frame and they are used in order to monitor secondary suspension condition (Fig. 1). As far as the track condition is concerned, acceleration signals are registered by accelerometers located on wheel-set bearings – 4 per one bogie. And the temperature of axles bearing is considered on signals recorded by temperature places located on wheelset bearings – 4 per one bogie.
Fig. 1Sensors location in the system source: figure is compatible to the one given in [3]
![Sensors location in the system source: figure is compatible to the one given in [3]](https://static-01.extrica.com/articles/18958/18958-img1.jpg)
As part of research in the literature presented over the last twenty years and considered the problem of rail vehicle suspension fault detection, few more systems and methods can be mentioned. To mention only some of them, they are as it follows. First of all, methods based on Kalman filter are described in the literature, as in [8-10]. Some specific multi-model approach to the problem is presented in [11-15] and method that use dynamical interactions between bogie movements is given in papers such as [16-18]. Nevertheless, no information about implementation of these methods in the real monitoring systems could be found. The one used for this specific research paper can be found.
2. EMU vehicle state monitoring under supervised operating conditions
The vehicle and track monitoring and diagnostics system enables vehicle state monitoring through acquisition and data pre-analysis (understood here as processed vibroacoustic signals). Measured data are subjected to digital processing and validation. If an error is detected, the information is sent, via a GSM modem, to external server as a control packet. Also measured data are sent to a server as data packets. Monitoring of state of rail vehicles is carried out on-line and signals collected by sensors are continuously processed, analysed and stored in system server databases.
The concept of rail vehicle state monitoring system assumes the use of acceleration signals recorded at selected points of a vehicle. Acceleration signals recorded on bogies and bodies of vehicles are used to evaluate the performance of rail vehicles. Two of tested basic parameters characterizing the acceleration signals used in this evaluation are root mean square value and maximum value also known as amplitude (according to the recommendations in [19], the amplitude of the signal is determined through its 99.85 % percentile). The permissible values for these parameters are contained in the documents for the approval tests of rail vehicles in terms of the dynamics of the gear system such as [19, 20]. The permissible amplitude and root mean square values are the same for driving bogies and rolling bogies.
As part of the supervised operation, the rail vehicle run on in particular routes (some of the selected routes between the following marginal cities were different as it is given in bracket): Warsaw – Poznań, Warsaw – Terespol, Warsaw – Kraków (via Łódź, Radom or Kielce), Kraków – Wroclaw, Warsaw – Łódź.
3. Analysis of individual diagnostic indicators
The analysis of signals recorded by the system on selected routes, under supervised operating conditions, concerns four diagnostic indicators such as: amplitude, root mean square, kurtosis coefficient and interquartile range. Amplitude and root mean square parameters were discussed in more detailed way in [21]. It was found that amplitude indicator due to strong susceptibility to changes in the rail-track vehicle set is not an effective determinant to monitor and diagnose a vehicle state.
According to [19, 20] permissible value of root mean square in case of acceleration signals is 0.5 [m/s2]. Due to the lower number of exceeds of the permissible value, in comparison to amplitude indicator [21], the root mean square could be subjected and quoted in more detailed analysis.
In Fig. 2, a graph of acceleration in transverse direction in A-body of vehicle (first segment of EMU vehicle while route passing) is given. It is featured in the form of a root mean square values on June 11th, 2012 and June 15th, 2012. It is sample route to express the potential of system analysis and the milage of route is as it follows:Kraków – Lewin Brzeski near Opole (for data packages number 1-99),Wroclaw – Krakow (for data packages number 100-290).
Fig. 2Comparison of acceleration in transverse direction on A-body, in the form of root mean square values (RMS) on June 11th and 15th, 2012
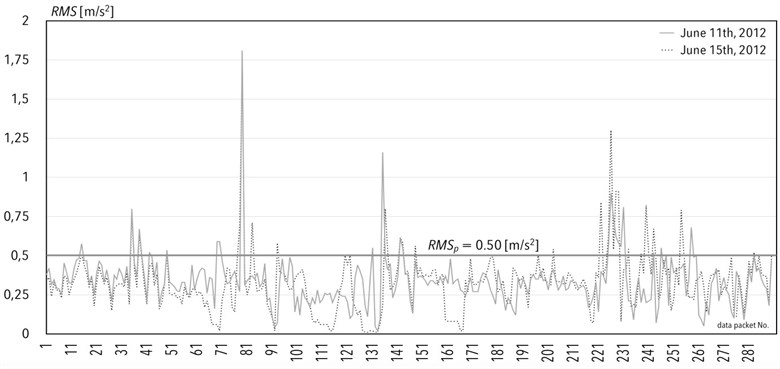
Based on the similarity of the route that the rail vehicle was passing by, it was decided to select of runs on June 11th and 15th, 2012 to be taken into account in the analyses. For this reason, there were comparisons of the excited values of the root mean square value on these routes. Pearson correlation coefficient in case of the pair of measurements is equal to 0.51. In Fig. 2, between Opole and Krakow, the state of the track on this route was not the best quality, which is the reason of numerous exceeds of . Consequently, the results of computing the track quality indicator confirmed the presumption.
Kurtosis coefficient does not always accurately describe the analyzed data. Interpretation of a kurtosis coefficient is not trivial and it is not possible to compare its value with other values without taking into account data distributions, sharpening of data distributions, thickness of falling shoulders. Therefore, it is postulated to remove a kurtosis coefficient from the cluster of diagnostic indicators or to develop significant changes in the diagnostic algorithm for the comparison of the coefficient value. Sample results are discussed in [21].
Before analyzing of interquartile range indicator diagnostic indicator, it had to be attempted to determine its limit values (the previous indicators permissible values were predefined beyond this part of research).
A method based on the distribution of the diagnostic parameter was chosen to the reason. It is because the determination of the limit value based on the distribution of the diagnostic parameter is used when there is no pre-failure mean value of a diagnostic parameter, i.e. when a test was not carried out to damage the object (here: a rail vehicle), which is to be dealt with under supervised operation considered hereby.
In order to determine the permissible values for interquartile range, for each data packet the values of elementary interquartile range were calculated. In this way, the sample of data (consisted of interquartile range values) were determined and a mean value and a standard deviation of each sample were computed. Then the limit (permissible) values were computed. Two kinds of these values were identified: a fixed permissible value and a floating permissible value. A fixed permissible value is understood herein as a limit value in the form of a real, single number, to which the values of the elementary interquartile range should be compared. Work on its determining is still continued. A floating permissible value, in turn, is such a limit that has been defined within one day of passing a rail vehicle. Examples of limit values are shown below, with additional assumption that these values are determined for three different velocity ranges of a rail vehicle: 40-80 [km/h], 80-120 [km/h], 120-160 [km/h].
On the basis of the received floating limit values, it can be stated which of the values of interquartile range calculated for specific data packages and specific days of travel of a rail vehicle are considered to be exceeded.
The graph in Fig. 3 shows the values of the interquartile range for individual data packets registered on July 2nd, 2012. The horizontal lines are the determinants of permissible levels divided into velocity ranges (see table 1.): Radom – Kielce route: 120-160 [km/h]: velocity values not reached in case of this route, 80-120 [km/h]: 0.48 [m/s2], 40-80 [km/h]: 0.45 [m/s2].
Fig. 3Interquartile range values (IQR) on July 2nd 2012
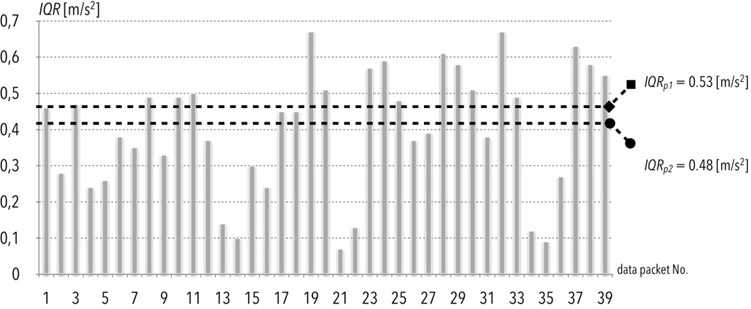
As a result of the analysis of this diagnostic indicator, it was found that the exceed was mainly due to quality of the track. Exceptions include situations where there is an unfortunate failure of the sensors.
4. Conclusions
The analysis convinced to the impossibility of treating each of the diagnostic indicators separately. Diagnostic indicators should be treated collectively. In order to determine algorithm in this case, additional analyses are needed (covering a wider spectrum of results than just the selected routes of the rail vehicle). However, before an algorithm that leads to a composite view of all diagnostic indicators is prepared, the importance of each diagnostic indicator must be evaluated. At the same time, it is necessary to specify explicitly acceptable levels of other diagnostic indicators, i.e. a kurtosis coefficient (if applicable), an interquartile range. These works (in the course of implementation) will allow for permanent and unambiguous determination of usefulness of diagnostic indicators.
As indicated in section 3, the simultaneous analysis of a root mean square value and a kurtosis coefficient does not produce satisfactory results. Exceed of permissible root mean square values occur sporadically, and most often they are suspected to be related to the crossing of a rail vehicle by rail crossing, turnouts or switches. Thus, this diagnostic indicator as such cannot be evaluated independently of other diagnostic indicators.
There were no significant similarities between the diagnostic indicators in case of a root mean square value and a kurtosis coefficient. For other pairs of diagnostic indicators, it was noted that when a root mean squared value exceeds its limit, a value of an interquartile range is exceeded. And this part of research will be continued.
References
-
Goodall R. M., Roberts C. Concept and techniques for railway condition monitoring. The International Conference on Railway Condition Monitoring, 2006, p. 90-95.
-
Bruni S., Goodall R. M., Mei T. X., Tsunashima H. Control and monitoring for railway vehicle dynamics. Vehicle System Dynamics, Vol. 45, Issues 7-8, 2007, p. 765-771.
-
Chudzikiewicz A., Sowiński B., Droździel J., Korzeb J., Opala M., Kostrzewski M., Michalski K., Melnik R. Sensors Arrangement for the System of Monitoring the State and Diagnosis of Rail Vehicles and Track. Patent Number P-399174, 2012, (in Polish).
-
Kostrzewski M., Konowrocki R. Evaluation of selected test track sections using track quality indicator. Pojazdy Szynowe, Vol. 2, 2014, p. 1-17, (in Polish).
-
Cerullo M., Fazio G., Fabbri M., Muzi F., Sacerdoti G. Acoustic signal processing to diagnose transiting electric trains. IEEE Transactions on Intelligent Transportation Systems, Vol. 6, Issue 2, 2005, p. 238-243.
-
Domin R., Domin I., Cherniak G. Estimation of dynamic performances of the safe operation of high-speed electric train. Archives of Transport, Vol. 41, Issue 1, 2017, p. 7-16.
-
Masinovic A. Vehicle fatigue and rail track condition monitoring system. SAE-A Vehicle Technology Engineer – Journal, Vol. 3, Issue 1, 2017, p. 1-10.
-
Goda K., Goodall R. M. Fault detection and isolation system to a railway vehicle bogie. Vehicle System Dynamics, Vol. 41, 2004, p. 468-476.
-
Goda K., Goodall R. M. Fault-detection-and-isolation system for a railway vehicle bogie. 18th IAVSD Symposium Dynamics of Vehicles on Roads and on Tracks, Asugi, Japan, 2003.
-
Li P., Goodall R. Model-based condition monitoring for railway vehicle system control. Control, University of Bath, UK, 2004.
-
Hayashi Y., Tsunashima H., Marumo Y. Fault detection of railway vehicle suspension systems using multiple-model approach. Journal of Mechanical Systems for Transportation and Logistics, Vol. 1, Issue 1, 2008, p. 88-99.
-
Tsunashima H., Mori H. Condition monitoring of railway vehicle suspension using adaptive multiple model approach. International Conference on Control, Automation and Systems, Gyeonggi-do, Korea, 2010.
-
Tsunashima H., Hayashi Y. Hirotaka Mori H., Marumo Y. Condition monitoring and fault detection of railway vehicle suspension using multiple-model approach. Proceedings of the 17th World Congress the International Federation of Automatic Control, Seoul, Korea, 2008.
-
Tsunashima H., Kojima T., Marumo Y., Matsumoto A., Mizuma T. Condition monitoring of railway track using in-service vehicle. International Symposium on Speed-up, Safety and Service Technology for Railway and Maglev Systems, Niigata, Japan, 2009.
-
Tsunashima H., Naganuma Y., Matsumoto A., Mizuma T., Mori H. Condition monitoring of railway track using in-service vehicle. Reliability and Safety in Railway, 2012, p. 333-356.
-
Mei T. X., Ding X. J. Condition monitoring of rail vehicle suspensions based on changes in system dynamic interactions. Vehicle System Dynamics, Vol. 47, Issue 9, 2009, p. 1167-1181.
-
Mei T. X., Ding X. J. New condition monitoring techniques for vehicle suspensions. Proceedings of 3rd IET International Conference on Railway Condition Monitoring, Derby, UK, 2008.
-
Mei T. X., Ding X. J. A model-less technique for the fault detection of rail vehicle suspensions. Vehicle System Dynamics, Vol. 46, Issue 1, 2008, p. 277-287.
-
Testing and Approval of Railway Vehicles from the Point of View of Their Dynamic Behaviour – Safety – Track Fatigue, Ride Quality. UIC 518, 4th edition, 2009.
-
Railway Applications – Testing for the Acceptance of Running Characteristics of Railway Vehicles - Testing of Running Behaviour and Stationary Tests. EN 14363, 2005.
-
Chudzikiewicz A., Kostrzewski M. Analysis of vibroacoustic signals in a process of the condition monitoring of rail vehicle’s suspension and rail track. Pojazdy Szynowe, Vol. 1, 2013, p. 10-17, (in Polish).
Cited by
About this article

The author expresses his gratitude for the financial support by the Polish Ministry of Science and Higher Education for the support of research within the framework of the Project Monitoring of Technical State of Construction and Evaluation of Its Lifespan – MONIT. Action Operational Programme Innovative Economy. Paper is financed by statutory work of Section of Dynamic Modelling of Rail Vehicles in Warsaw University of Technology, Transport Faculty, Division of Transport Means Fundamentals.
