Abstract
The present work is focused on the finite element analysis carried out on special water filter used in the marine application developed by CVRDE. This paper describes specifically on various type of analysis such as structural, shock analysis and modal analysis for the special water filter. The analysis is carried out using finite element method and compared it with the test results. It is observed that the shock test and sine sweep vibration test carried out is in line with the predicted finite element simulation. The filter assembly is designed in such a way that the natural frequency is away from resonance frequency. Thus, the special water filter has been validated through analysis using the finite element technique which help reduce the repeated testing of all the filters.
Highlights
- Finite element simulation of the filter assembly is in line with the test results.
- Filter assembly has been validated through analysis using the finite element technique.
- Importantly this analysis will help reduce the repeated testing of all the filters thereby saving cost and time.
1. Introduction
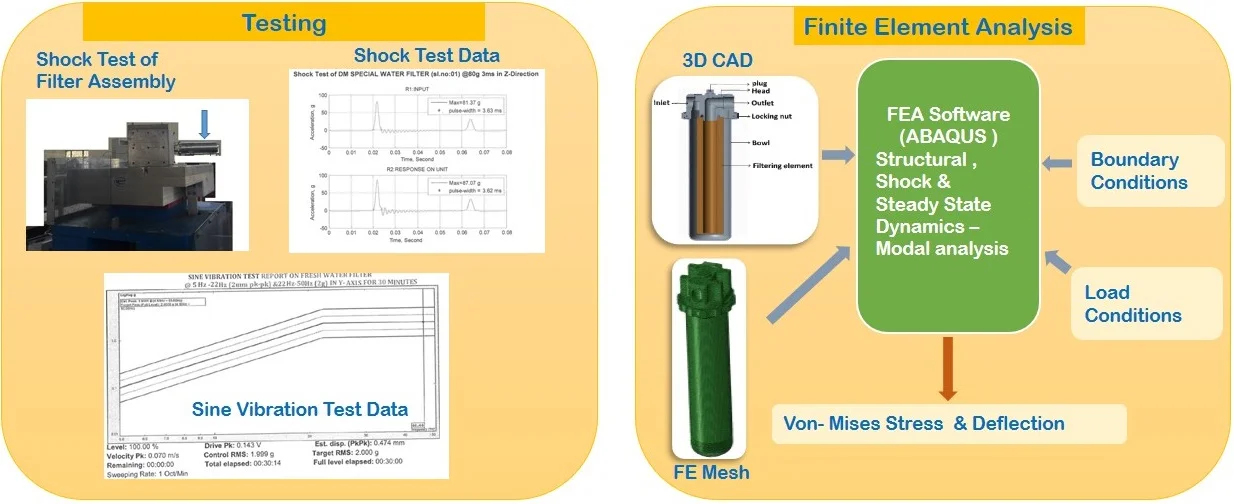
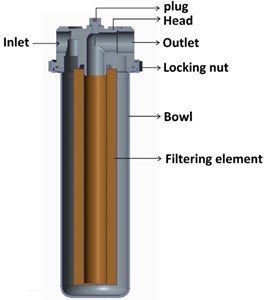
Special water filter is mainly used for marine application to remove solid contaminations of 50 µ and above for cleaning. The filter assembly consists of bowl, head, cartridge type filtering element and locking nut. The working pressure of this filter is 10 bar. CVRDE has developed six types of indigenous filters for different applications. The material used is Stainless Steel AISI 316 and the Fig. 1 shows the solid model assembly of special water filter.
Fig. 1Assembly of special water filter
2. Literature survey
Mechanical Vibration by Singiresu S. Rao [1] has presented the analytical method to find out stress estimation in a structural component subjected to shock load. The various test measurement made by the expert team [2] at ENTEST Lab supported the finite element prediction which help reduce the testing of all the filters. ABAQUS [3] presented the methodology for carrying out the shock analysis on structural component. Toshin Momin and R. P. Chandrasekar [4] has presented the detailed design and finite element analysis of high pressure hydraulic filter for Marine application. V. Devisilov and E. Sharai [5] has presented the combination of hydrodynamic filtration with an additional force mechanism with its advantages and disadvantages.
3. Analysis methodology
3.1. Structural analysis
The finite element model of assembly water filter with the components is shown in Fig. 2. The head bowl along with the locking nut is taken for the structural analysis. The fixed boundary conditions are applied on the head and bowl. For the head the BC is applied on the mounting holes on its top and for the bowl the BC applied on its flange top and bottom. The pressure of 15 bar (1.5 times the working pressure) is applied on the head and bowl. Finite element structural analysis is carried out. From the analysis it is estimated that the maximum von-Mises stress distribution of 28.6 MPa is shown in Fig. 3, is within the limit.
Fig. 2Finite element model of filter assembly
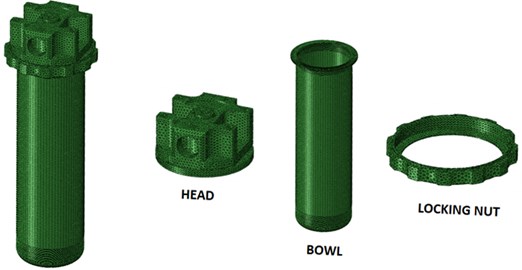
Fig. 3Von-Mises stress distribution on head (for 1.5 times the working pressure)
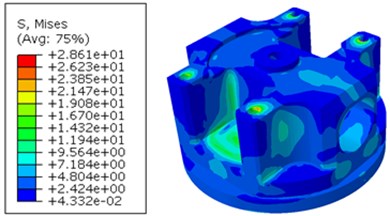
Fig. 4Von-Mises stress distribution on the bowl
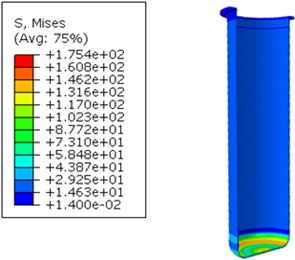
The maximum von-Mises stress distribution on the bowl of the assy. water filter is 175.4 MPa, is also shown in Fig. 4 is within the limit.
3.2. Shock analysis
To carry out the shock analysis, initially frequency (Eigen value) analysis is required to be done. The frequency analysis is carried out with fixed boundary condition. The first two natural frequency obtained is 1193 Hz and 2131 Hz. Following which a shock analysis was carried out on the assembly water filter with the specification of – 120 g ASE or SRS (20 mm; 1.3 ms; 120 g) in all direction. In this assembly all the 3 components, viz., the bowl, the head and the locking nut in assembled condition are taken for this shock analysis.
The frequency obtained for the shock pulse of 1.3 ms to the filter assembly is estimated as 384.62 Hz.
– The following boundary condition and constraints are applied.
– Four mounting holes on the top of the head are with fixed boundary conditions.
– Tie constraints are provided between the threaded portion on the head and the locking nut.
– Tie constraints are provided between the inner slope portion of the locking nut and the top portion of the flange on the bowl.
Fig. 5Von-Mises stress distribution on Head (120 g shock applied in Z-direction )
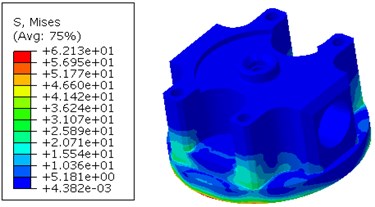
Fig. 6Von-Mises stress distribution on Bowl (120 g shock applied in Z-direction )
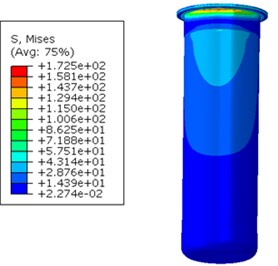
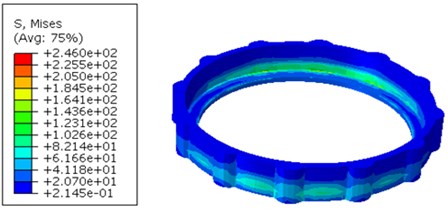
Fig. 7Von-Mises stress distribution on Locking nut (120 g shock applied in Z-direction)
The shock load in three directions (-direction, -direction and -direction) are considered as separate load cases. For the analysis 120 g shock load which is 1.5 times the normal shock load is considered.
From the analysis the von-Mises stress distribution for the shock load spectrum applied on -direction in the filter assembly is shown in Fig. 5, Fig. 6 and Fig. 7 which is within the yield limit of the material. After carrying out the shock analysis, for the three axis (-direction, -direction and -direction) separately, the stress distribution are tabulated.
The Table 1 Shows the von-Mises stress distribution for the filter assembly, when the shock load is applied in three different axis.
Table 1Stress distribution for X, Y and Z-axis
Part name | -Direction | -Direction | -Direction |
N/mm2 | N/mm2 | N/mm2 | |
Head | 69.97 | 0.6 | 62.1 |
Locking nut | 236.9 | 2.34 | 246 |
Bowl | 178.3 | 1.35 | 172.5 |
The maximum stress estimated from this shock analysis is 246 MPa in the direction at locknut is also less than the yield strength (400 MPa) of steel material of this filter.
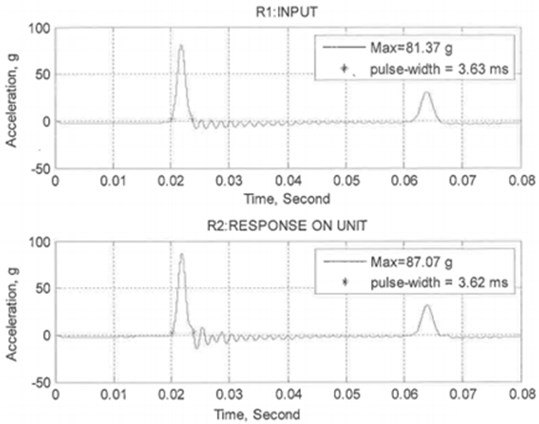
One filter assembly was also subjected to shock testing of 80 g for 3 ms, applied in all direction independently. After the test the filter assembly was inspected and found to be safe without any leak. The details of shock test in -Direction is shown in Fig. 8.
Fig. 8Shock test measurement with 80 g, 3 millisecond applied in Z-direction
3.3. Steady state dynamics-modal analysis
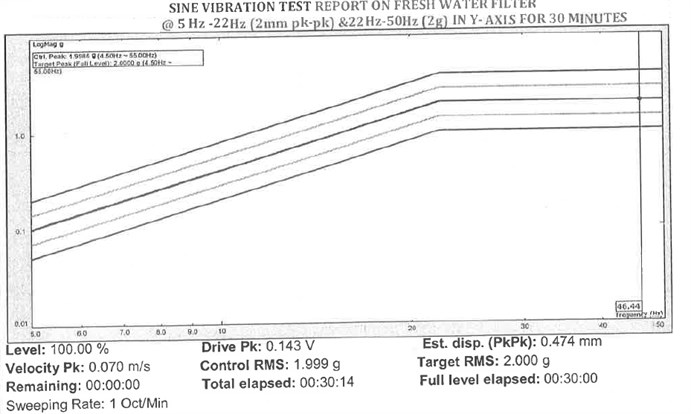
Steady state dynamics-modal analysis is carried out to analyze the sine vibration test shown in Fig. 9 on the special water filter assembly. The sine test load on , and - axis is applied as acceleration base motion with amplitude curve under constrained boundary condition. It is to be noted that the stress distribution through analysis is very low compared to the yield value of the material.
Fig. 9Sine vibration test @ 5-22 Hz (2 mm pk-pk) and 22-50 Hz (2 g) in Y-direction
4. Conclusions
Initially structural analysis of the filter is carried out considering 1.5 times the fluid working pressure and estimated maximum von-Mises stress is 175.4 MPa which is less than yield value of the material. To carry out the shock and steady state dynamics – modal analysis, it is necessary to carry out the natural frequency analysis. Thus, the filter assembly is designed in such a way that the natural frequency is away from resonance frequency. Hence it is observed that the finite element simulation of the filter assembly is in line with the test results. Thus, the filter assembly has been validated through analysis using the finite element technique. More importantly this analysis will help reduce the repeated testing of all the filters saving cost and time.
References
-
Singiresu Rao S. Mechanical Vibrations. 4th edition, Pearson Education, Delhi, 2005, p. 365.
-
Data Measurement – Internal Report, 2017.
-
ABAQUS Tutorial guide – Release 6.142. ABAQUS SYS Inc., 2014.
-
Momin Toshin, Chandrasekar R. P., Balasubramanian S., Basha Junaid A. M. Design and analysis of high pressure hydraulic filter for marine application. IOP Conference Series: Materials Science and Engineering, Vol. 197, 2017, p. 012050.
-
Devisilov V., Sharai E. Hydrodynamic filters in hydraulic fluid cleaning system of hydraulic drive. IOP Conference Series: Materials Science and Engineering, Vol. 492, 2019, p. 012025.
About this article

The authors are grateful to Shri V. Balamurugan, Outstanding Scientist, Director, CVRDE for his guidance, support and encouragement. The authors are also grateful to the contributions made by Divisions of AP, CEAD of CVRDE and ENTEST of RCI.
