Abstract
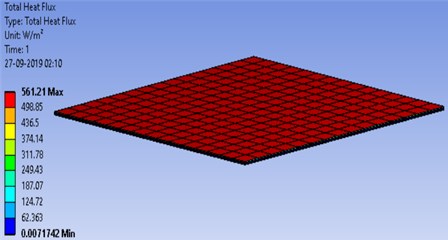
In this paper an attempt has been made to simulate and evaluate the distribution of temperature and heat flux for the hybrid photovoltaic thermal system with CFD (computational fluid dynamics) module in ANSYS 19.1 software. The simulation was carried to determine the temperature and heat flux across the different layers of HPVT (hybrid photovoltaic thermal) system. The temperature and heat flux were found to gradually decrease from the top glass layer to the bottom tedlar layer. The temperature varied from 36.4 °C (ambient) to 26.8 °C across the layers from top glass layer to bottom tedlar layer. The heat flux of (561.2 W/m2) at the glass layer due to solar insolation was also found to gradually decrease with the increasing thickness. The reduction in temperature and heat flux with increasing thickness is attributed to fluid flowing beneath the system. The water flowing beneath the tedlar layer takes the excess heat out of the photovoltaic layer, thereby increasing the efficiency of the hybrid photovoltaic thermal system.
Highlights
- The temperature varied from 36.4 °C (ambient) to 26.8 °C across the layers from top to bottom. The decrease in temperature is due to heat taken away by water flowing beneath the tedlar layer.
- This will lead to increase in efficiency of the hybrid PVT system.
- The heat flux (800W/m2) at the glass layer by solar insolation is gradually decreasing with the increasing thickness of the layers.
- The efficiency of the hybrid PVT system will increase due to decrease in temperature across PV cell layer.
- Also, the heat taken by water flowing beneath the tedlar can be used for heating purpose.
1. Introduction
Hybrid Photovoltaic Thermal System is the most promising emerging solution for current energy scenario. The efficiency of conventional solar PV decreases with increasing temperature. Solar cell efficiency decreases at the rate of 0.45 % per °C for silicon cells. Panel temperature can reach 70 °C in hot summer days. This means panels will produce up to 20 % less power compared to their rated power capacity at 25 °C. To overcome this, hybrid solar technology was developed. The hybrid system has the provision to capture the excess heat rejected by the solar PV and convert it into thermal energy. The efficiency of the hybrid system can reach up to 70 % [1, 2]. Khelifa et al. [3] performed a simulation analysis on a HPVT rectangular system with photovoltaic cells on the outside and air as heat transfer fluid. It was observed that the temperature of solar cells decreased due to convective heat transfer between the cells and the fluid medium and the fluid temperature varied from 20 °C to 40 °C between the inlet and outlet. Waeli et al. [4] modelled PVT system using nano fluid coolant and phase changing materials. The overall PVT efficiency was found to be 85.7 %. Hemmer et al. [5] numerically investigated heat transfer and flow dynamics in inclined PV panels at uniform heat flux of 510 W/m2. The heat transfer was found low for large channel inclination angles. Edgar et al. [6] used a CFD finite element model to investigate the temperature of PV cell using basic material properties. Li and Jing [7] investigated the photovoltaic and thermal system performances of a 3D concentrated PVT (photovoltaic thermal) model using CFD and TRNSYS. The thermal energy efficiency gained its peak value against an optimal flow velocity different solar cell. The total energy efficiency was lower and exergy efficiency was higher for relatively low flow velocities. Zogou and Stapountzis [8] analyzed flow and heat transfer inside a PVT collector for building application. The flowrate and heat transfer characteristics of the backsheet proved to be most important factor for the performance of PV façade based on CFD simulations.
2. System description
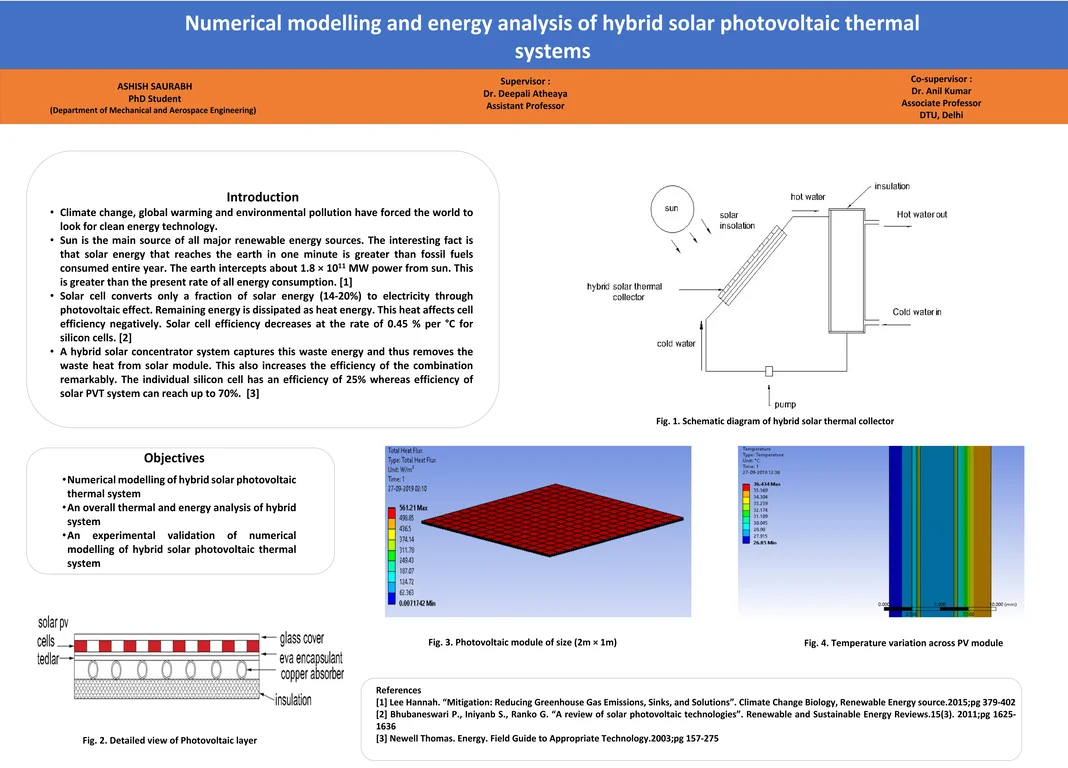
The Fig. 1 shows the cross-sectional view of hybrid PVT. Solar insolation falls to the top glass layer. The heat flux is transmitted indirectly from the back side of solar cells. There is direct transmission of thermal energy from the non-packing area to the metal absorber plate by conduction. Further, there is transfer of thermal energy from absorber plate to fluid (water). The working fluid (water) is supplied from household to the hybrid collector where it gets heated from the thermal heat transferred by absorber plate through convection. The hybrid photovoltaic system helps reducing space, on site electricity generation and thermal heat generation. It also allows for the most efficient utilization of roof space. The various layers across the system are as follows:
1) Glass cover – this provides glazing and transmits radiation to the absorber. It also prevents radiative and convective loss from the surface. Solar insolation is incident on this layer. The thickness and other system properties are given in Table 1.
2) PV cell layer – below the glass cover lies the PV cells which convert solar energy to electricity by photovoltaic effect.
3) eva – eva is acronym used for ethyl vinyl acetate used to protect solar panel from extreme weather condition, moisture and dirt penetration.
4) Tedlar – tedlar is a protective sheet covering PV cells.
5) Absorber – this is composed of copper pipes carrying water to take the extra heat from the PV layer.
6) Insulation – it is done to reduce the heat losses to the surrounding.
Fig. 1Cross sectional view of Hybrid PVT
3. Energy analysis using governing equations
Following assumptions are made for writing the energy balance equations for the hybrid PVT collector system:
1) The system is in quasi steady state.
2) The ohmic losses in solar cells are negligible.
3) There is no temperature variation across thickness of solar cells and glass material.
4) Heat capacity of solar cell and glass cell is negligible.
5) One dimensional heat flow has been considered.
6) Transmittivity of eva is almost 100 %.
CFD i.e. computational fluid dynamics uses the following laws of conservation of mass, momentum and energy [9].
Continuity equation:
Momentum conservation equation:
Navier Stokes equation:
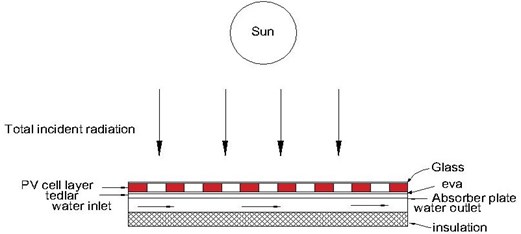
Fig. 1 shows the cross-sectional view of hybrid PVT collector and Fig. 2 shows the corresponding thermal circuit with various resistances across the layers. The energy balance equation for each layer of hybrid PVT collector (Atheaya et al. [7]) is as follows:
– For the PV module:
where – rate of solar radiation available on PV cell layer, – rate of thermal energy loss from PV cell layer to ambient through glass, – rate of thermal energy loss from PV cell layer to absorber plate, – rate of generated electrical energy from PV cell layer.
– For the fluid flowing below the absorber:
where – rate of energy carried away by flowing fluid, – rate of available energy to fluid.
– For absorber tube:
where – rate of solar radiation available on absorber plate through non packing area of PV module, – rate of thermal energy transferred from solar cell to absorber plate, – rate of available energy to the fluid flowing below the absorber.
– The total resistance across the hybrid PVT system as per Fig. 2 will be given by:
Fig. 2Thermal resistance circuit diagram
4. Methodology
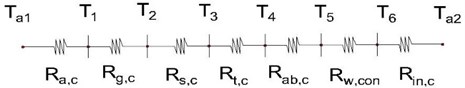
The methodology followed is shown schematically in Fig. 3. The geometric model for the hybrid system is generated using ANSYS software design modeller. The mesh is carried using ANSYS mesh module. The heat transfer phenomenon between different layers of hybrid photovoltaic module is modelled using the system coupling of Ansys transient thermal and Ansys FLUENT software. The fluid solid interface was created in FLUENT and simulated in transient thermal module. The thermal modelling of hybrid PVT system is analyzed with energy balance using the equations 1-8 written above. The temperature and heat flux variation of different layers of the hybrid system can be predicted.
5. Results and discussion
The design and operating parameters for the hybrid photovoltaic thermal system has been shown in Table 1. The meshing of the system was done for optimum value of skewness and aspect ratio. The momentum, continuity and energy equation was solved using Fluent. Simple pressure velocity coupling with laminar flow model was chosen [10].
Fig. 3Flowchart showing CFD simulation
Table 1Design and operation parameters of hybrid PVT
Hybrid solar parameters | Values |
Module type | monocrystalline |
Area of PV module | 1×1 m |
Thickness of glass cover, solar cell, tedlar and back insulation | 0.003 m, 0.0003 m, 0.0005 m, 0.05 m |
Conductivity of glass cover, solar cell, tedlar and back insulation | 0.98 W/m°C, 148 W/mK, 0.333 W/mK, 0.035 w/mK |
Transmittivity of glass | 0.95 |
Absorptivity of tedlar and solar cell | 0.5, 0.9 |
Packing factor of solar cell | 0.9 |
Ambient temperature and solar intensity | 37 °C, 800 W/m2 |
The governing equations for the CFD calculations are energy equations based on laminar model for the fluid flow through the domain. The model was first created in transient thermal and temperature variation was calculated across different layers as shown below in the Fig. 4. For CFD simulation, pressure-based solver was activated. The heat flux of 800 W/m2 on the top layer due to solar radiation was simulated across the hybrid PVT system.
Fig. 4Temperature variation across various layers of hybrid PVT
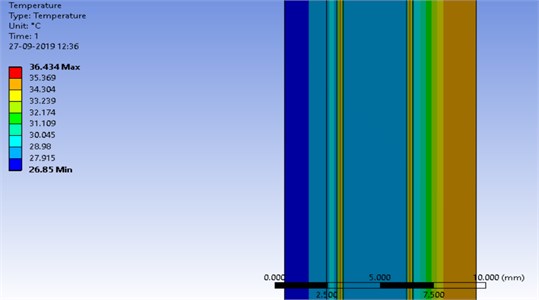
The fluid flow and heat transfer characteristics were studied with the ANSYS 19.1 Fluent through computational fluid dynamics calculations. It was observed that the temperature varied from 36.4 °C (ambient) to 26.8 °C across the layers from top to bottom as shown in Fig. 4. The decrease in temperature is due to heat taken away by water flowing beneath the tedlar layer and conductive heat flow across the various layers. Similarly, the variation of heat flux across the hybrid photovoltaic thermal system is shown in Fig. 5. The heat flux was found to gradually decrease with the increasing thickness across the layers, reaching the minimum value at the bottom layer (tedlar). The gradual reduction in heat flux distribution is attributed to conductive resistances of different layers and convective resistance of fluid.
Fig. 5Heat flux distribution across the hybrid PVT
6. Conclusions
Based on present studies following conclusions have been made.
1) The temperature varied from 36.4 °C (ambient) to 26.8 °C across the layers from top to bottom. The decrease in temperature is due to heat taken away by water flowing beneath the tedlar layer and conductive heat flow across the various layers. This will lead to increase in efficiency of the hybrid PVT system.
2) The heat flux (800 W/m2) at the glass layer by solar insolation is gradually decreasing with the increasing thickness of the layers. reaching the minimum value at the bottom layer.
3) The efficiency of the hybrid PVT system will increase due to decrease in temperature across PV cell layer. Also, the heat taken by water flowing beneath the tedlar can be used for heating purpose.
References
-
Brooks Adria E. Solar energy: photovoltaics. future energy (second edition). Improved, Sustainable and Clean Options for our Planet, Vol. 4, Issue 3, 2014, p. 383-404.
-
Abdulyan M., Chiasson A. Thermal study of hybrid photovoltaic-thermal (PVT). Energy Procedia, Vol. 141, Issue 3, 2017, p. 102-108.
-
Khelifa A., et al. Analysis of a hybrid solar collector photovoltaic thermal (PVT). Energy Procedia, Vol. 74, 2015, p. 835-843.
-
Al-Waeli A. H. A., et al. Modelling and experimental validation of a PVT system using nanofluid coolant and nano-PCM. Solar Energy, Vol. 177, Issue 1, 2019, p. 178-191.
-
Hemmer C., et al. Early development of unsteady convective laminar flow in an inclined channel using CFD: Application to PV panels. Solar Energy, Vol. 146, 2017, p. 221-229.
-
Edgar R., et al. A computational fluid dynamic study of PV cell temperatures in novel platform and standard arrangements. Solar Energy, Vol. 144, Issue 1, 2017, p. 203-214.
-
Li Yang, Jing Dengwei Investigation of the performance of photovoltaic/thermal system by a coupled TRNSYS and CFD simulation. Solar Energy, Vol. 143, 2017, p. 100-112.
-
Zogou Olympia, Stapountzis Herricos Flow and heat transfer inside a PV/T collector for building application. Applied Energy, Vol. 91, Issue 1, 2012, p. 103-115.
-
Versteeg Malalasekra An introduction to Computational Fluid Dynamics. Pearson, 2009.
-
Atheaya D., et al. Analytical characteristic equation for partially covered photovoltaic thermal (PVT) compound parabolic concentrator (CPC). Solar Energy, Vol. 111, 2015, p. 176-185.
Cited by
About this article

