Abstract
The laser speckle contrast imaging allows the determination of the flow motion in a sequence of images. The aim of this study is to combine the speckle contrast imaging and machine learning methods to recognition of physiological fluids flow rate. Data on the flow of intralipid with average flow rate of 0-2 mm/s in a glass capillary were obtained using a developed experimental setup. These data were used to train a feed-forward artificial neural network. The accuracy of random image recognition was quite low due to pulsations and the uneven flow set by the pump. To increase the recognition accuracy, various methods for calculating speckle contrast were used. The best result was obtained when calculating the mean spatial speckle contrast. The application of the mean spatial speckle contrast imaging together with the proposed artificial neural network allowed to increase the fluid flow rate recognition accuracy from about 65 % to 89 % and make it possible to exclude an expert from the data processing.
1. Introduction
Analysis of changes in the properties of physiological fluids, in particular blood, can be used to diagnose various diseases. It is shown in the works [1-3] that changes in blood viscosity are associated with the regulation of immune responses. It is demonstrated in paper [4] that an increase in blood viscosity is associated with a number of diseases, such as acute nonlymphocytic leukemia, chronic lymphocytic leukemia, chronic myeloid leukemia, sickle cell disease. The study of the rheological and kinematic properties of physiological fluids is an actual task, and of particular interest are minimally invasive and non-invasive diagnostic methods. The laser Doppler flowmetry (LDF) and the laser speckle contrast imaging (LSCI) methods make it possible to carry out studies in the “in vivo” conditions to evaluate microcirculation in biological tissues [5-7]. LSCI is used in rheumatology, dermatology, ophthalmology, neurology, and many other areas of medicine [8-10]. LSCI is an effective method for full-scale monitoring of particle dynamics in heterogeneous media However, there is a problem in the determination of blood flow quantitative parameters. The blood vessel visualization using multispectral optoacoustic tomography is considered in Ref. [11]. As an alternative to manual segmentation of the obtained images, the authors propose the use of “sparse-UNET”. The test accuracy in the form of the “Dice” estimate is 0.88. The stenosis of coronary arteries by coronary angiography were considered by M. Zreik and coauthors [12]. The authors propose the use of coronary CT angiography to reduce invasive procedures. The application of a convolutional neural network for segmentation and a support vector machine for classification is used. The classification accuracy according to the “ROC” estimate is 0.74.
This paper deals with the application of artificial neural networks (ANN) to the recognition of the average flow rate. The physiological fluid flow images obtained using the LSCI method are under study. In the future, the developed method is expected to be used as a part of the viscosity measurement procedure [13].
2. Experimental setup and methodology
The aim of the study is a combination of the determined and stochastic factors including the flow rate, the intralipid concentration, the camera exposition time, and the camera positioning for the following feature extraction using an ANN and several experts to compare their accuracy.
The study was implemented with the experimental setup that combines the fluid flow circuit and the LSCI equipment (see Fig. 1), designed earlier [6, 8, 9]. The enforced fluid flow through the medical glass capillary of 1.6 mm in diameter was investigated. The studied fluid is 20 % intralipid (Fresenius Kaby, USA). The electric pump DSh-08 (Visma, Belarus) provides a flow rate of a known value while the UI-3360CP-NIR-GL Rev.2 (IDS GmbH, Germany) CMOS camera combined with the extension adapter and MVL25TM23 lens (Thorlabs, Inc., USA) records the intralipid flow illuminated by a 785 nm laser (LDM785, Thorlabs Inc.).
Fig. 1The experimental setup: a) schematic and b) photograph
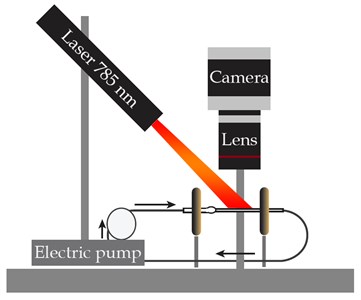
a)
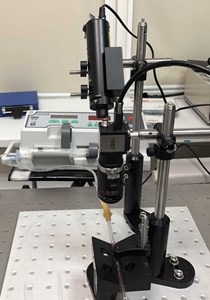
b)
The plan of the study consisted of 225 tests including 5 parallel tests at each combination of the factors. The tests were performed in random order. Each test lasted 1 minute. The camera recorded the flow with the resolution of 2048×512 pixels at the frequency of 30 FPS. The flow rate was of 0, 0.5, 1, 1.5, and 2 mm/s. The intralipid was diluted to concentrations of 4, 8, and 12 %. The camera exposition time was 5, 15, and 33 ms.
3. Data processing
In LSCI, the image of dynamic inhomogeneities is obtained by analyzing the local speckle contrast in the image plane [14]. If a scattering object is illuminated by the coherent light, the randomly changing light intensity pattern, produced by random interference inside the medium and on its surface, appears. This granular structure of light intensity is widely known as the speckle pattern. Movement of particles inside the illuminated medium causes the fluctuations in the position of speckles and results in a blurred image due to the averaging during the exposure time of the detector. Further, temporal and spatial statistics of the speckle pattern can be used for obtaining information on the motion of scattering particles The spatial speckle contrast (SSC) uses a small square domain of several pixels in an image for the calculations. The optimal domain is a 7×7 pixels window. The calculation convolves the input image to the SSC image by moving the window along the image vertically and horizontally and computing the speckle contrast using:
where is the calculation domain size; is the intensity standard deviation; is mean intensity.
The ranges from 0 to 1 (see Fig. 1). To calculate the temporal speckle contrast (TSC), the value of one pixel intensity in several frames is used. The spatio-temporal speckle contrast (STSC) combines both methods discussed above.
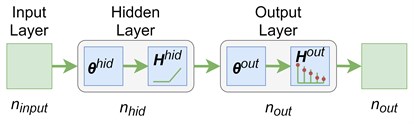
The images obtained with the LSCI are subjected to further processing by a feed-forward ANN. The ANN receives contrast values of all pixels in an image. An input matrix of elements represents images with the size of each. The matrix also includes the unit column as a bias. An output matrix of elements represents values of the flow rates that correspond to images. The available data helps to build the classification model that predicts the flow rate in the capillary based on the image of this flow. The classification model is a complex parametrized function which approximates the class prediction probabilities. A feed-forward ANN is used to implement this model (see Fig. 2). The input layer has ( neurons that correspond to the size of the images. The number of neurons in the hidden layer is a hyperparameter. The number of layers in the output layer is 5 that corresponds to the number of flow rate levels (see Section 2). The weight matrices of the input and output layers are and , respectively. The “ReLu” function is the activation function in the hidden layer. The hidden layer neurons output the following values:
The output layer has the “softmax” activation function. The output values are:
So, the probability of belonging to each class is approximated by the ANN shown in Fig. 2. The cross-entropy loss with the -regularization is used as an error function:
where is a column matrix with the size of and with the components corresponding to the logic equation , given for each image.
Fig. 2A 3-layers feed-forward neural network for a multiclass classification
The gradient methods are applied to minimization of the loss function Eq. (4) and finding the weights. The “Adam” algorithm is one of the most popular [15].
4. Results
This section deals with the experimental results obtained for the intralipid concentration of 8 % and the camera exposition time of 15 ms (see Section 2). A set of speckle contrast images was generated using the SSC method (see Fig. 3). Then the 5-classes classification problem was studied. At the first stage, a subset of speckle contrast images was used to estimate the accuracy of visual pattern recognition by 6 experts. Their average recognition accuracy was 59 % and the highest accuracy was 65 %.
Fig. 3Fluid flow visualization: a) an initial image and b) the corresponding speckle contrast image obtained with the SSC method
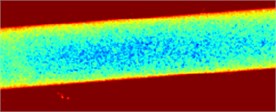
a)
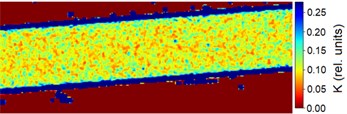
b)
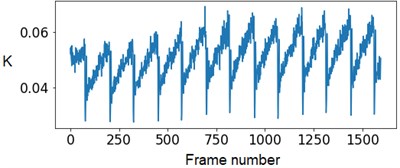
Experts’ low accuracy can be explained by the fact that the pump of the experimental setup has some flow rate fluctuations when operating. Fig. 4 demonstrates this periodical fluctuation.
Fig. 4The SSC values in the capillary central part domain of 40×40 pixels. The flow rate is 1.5 mm/s
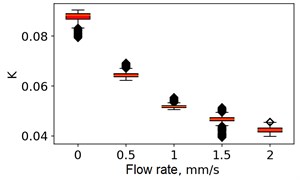
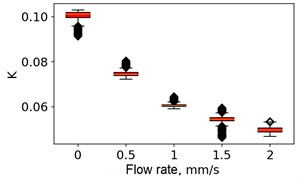
At the next stage, the newer sets of TSC and STSC images were calculated with the depth parameter of 120 frames, as well as the mean SSC across the 120 frames (see Fig. 5).
Fig. 5Speckle contrasts calculated in the the capilary central part domain of 40×40 pixels at the different fluid flow rates: a) SSC, b) TSC, c) STSC, and d) mean SSC
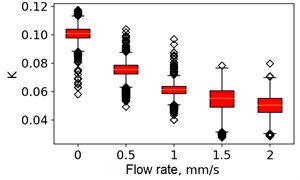
a)
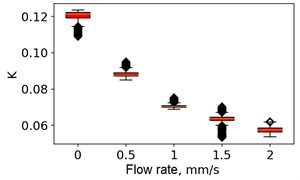
b)
c)
d)
All plots demonstrate outliers. This may be caused by the presence of a transient flow regime in the first few seconds of the video recording. Such data was removed from the data set.
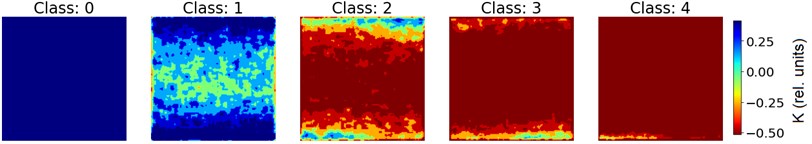
The dataset of 38000 images was divided into 3 parts in proportion of 0.55:0.23:0.25 for training, validation, and test, respectively. Fig. 6 demonstrates examples of images for each class. Standard scale normalization was applied.
Fig. 6Training images represent the capillary central part domain of 128×128 pixels
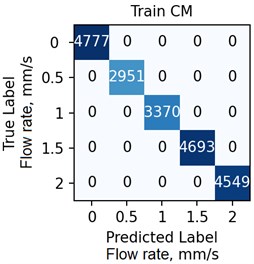
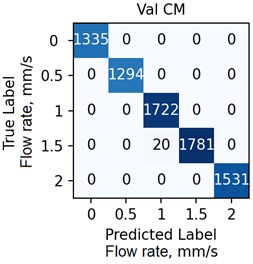
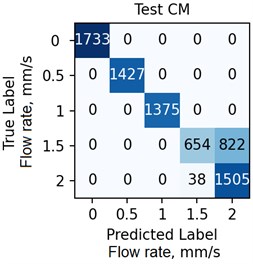
The ANN was trained with different number of hidden neurons: = [8, 16, 32, 64]. The number of classes and the regularization parameter value (see Eq. (4)) were also varied. The parameters were selected based on the validation results. Fig. 7 demonstrates the classifier confusion matrices.
Fig. 7The confusion matrices calculated for the mean SSC images
Quantitative analysis of the ANN and the accuracy of 6 experts depending on the data preprocessing method are presented in Table 1.
The Table 1 demonstrates that the ANN accuracy is higher than the accuracy of the experts at approximately 10 %. The best ANN accuracy of 88.6 % on the test set was obtained for the case of data preprocessing using the mean SSC method. The proposed technic or any of its elements are applicable to the LSCI or LDF methods in the “in vivo” conditions. For example, when studying soft tissues microcirculation [5-7] and when the obtained data samples can be represented in form of one- or multi-dimensional sequences of 102-103 elements. For the bigger samples, the deep neural networks should be met.
Table 1The ANN results versus the results of 6 experts
Images preprocessing method | ANN accuracy | Experts opinion/best accuracy | ||
Training | Validation | Test | ||
SSC | 0.759 | 0.877 | 0.697 | 0.59 / 0.65 |
TSC | 0.999 | 0.997 | 0.872 | 0.71 / 0.74 |
STSC | 0.999 | 0.994 | 0.838 | 0.76 / 0.79 |
Mean SSC | 1.0 | 0.998 | 0.886 | 0.80 / 0.81 |
5. Conclusions
The proposed approach demonstrated that the mean spatial speckle contrast calculation allows highlighting important features and decreasing the negative effect of pulsations that helps to prepare images for the following flow rate recognition. The best ANN settings, e.g. the number of hidden neurons, were determined in the training and validation cycles. The trained ANN demonstrated high accuracy up to 90 % and exceeded the accuracy of 6 experts by about 10 %. The combination of the mean spatial speckle contrast imaging and machine learning methods to the physiological fluids flow study is promising in many applications including health monitoring.
References
-
J. Xu, G. Vilanova, H. Gomez, “Phase-field model of vascular tumor growth: Three-dimensional geometry of the vascular network and integration with imaging data,” Computer Methods in Applied Mechanics and Engineering, Vol. 359, pp. 1–19, 2020.
-
A. N. Semenov, et. al, “Applying methods of diffuse light scattering and optical trapping for assessing blood rheological parameters: erythrocytes aggregation in diabetes mellitus,” Izv. Saratov Univ. (N.S.), Ser. Physics, Vol. 17, No. 2, pp. 85–97, 2017, http://doi.org/10.18500/1817-3020-2017-17-2-85-97, (in Russian).
-
N. Yeow, R. Tabor, G. Garnier, “Atomic force microscopy: From red blood cells to immunohematology,” Advances in Colloid and Interface Science, Vol. 249, pp. 149–162, 2017, http://dx.doi.org/10.1016/j.cis.2017.05.011
-
Morie A. Gertz, “Acute hyperviscosity: syndromes and management”, Blood, Vol. 132, No. 13, pp. 1379–1385, 2018, https://doi.org/10.1182/blood-2018-06-846816
-
V. V. Dremin, et al., “Laser Doppler flowmetry in blood and lymph monitoring, technical aspects and analysis,” Proceedings of SPIE, Vol. 10063, pp. 1006303, 2017, http://doi.org/ 10.1117/12.2252427
-
E. Potapova, et. al., “Laser speckle contrast imaging of blood microcirculation in pancreatic tissues during laparoscopic interventions,” Quantum Electronics, Vol. 50, pp. 33–14, 2020, http://doi.org/10.1070/QEL17207
-
S. A. Sdobnov, A. Bykov, G. Molodij, et. al., “Speckle dynamics under ergodicity breaking,” Journal of Physics D: Applied Physics, Vol. 51, No. 15, pp. 155401, 2018, https://doi.org/10.1088/1361-6463/aab404
-
I. Mizeva, et al. “Wavelet analysis of the temporal dynamics of the laser speckle contrast in human skin,” IEEE Transactions on Biomedical Engineering, Vol. 67, No. 7, pp. 1882–1889, 2020, http://doi.org/ 10.1109/TBME.2019.2950323
-
V. Dremin, et al. “Monitoring oxidative metabolism while modeling pancreatic ischemia in mice using a multimodal spectroscopy technique,” Laser Physics Letters, Vol. 11, No. 17, pp. 115605, 2020, http://doi.org/10.1088/1612-202X/abbefa
-
W. Heeman W. Steenbergen, et al. “Clinical applications of laser speckle contrast imaging: a review”, Journal of Biomedical Optics, Vol. 24, No. 8, pp. 1–11, 2019, http://doi.org/10.1117/1.JBO.24.8.080901
-
N.-K. Chlis, et. al., “A sparse deep learning approach for automatic segmentation of human vasculature in multispectral optoacoustic tomography”, Photoacoustics, 2019, https://doi.org/10.1101/833251
-
M. Zreik, et. al., “Deep learning analysis of the myocardium in coronary CT angiography for identification of patients with functionally significant coronary artery stenosis,” Medical Image Analysis, Vol. 44, pp. 72–85, 2018, http://doi.org10.1016/j.media.2017.11.008
-
E. Kornaeva, et al., “Theoretical premises of a vibro-inertial method of viscosity measurement,” Vibroengineering Procedia, Vol. 8, pp. 440–445, 2016.
-
M. Draijer, E. Hondebrink, T. van Leeuwen, W. Steenbergen, “Review of laser speckle contrast techniques for visualizing tissue perfusion,” Lasers in Medical Science, vol. 24, No. 4, pp. 639–651, 2009, http://doi.org/10.1007/s10103-008-0626-3
-
D. P. Kingma, J. L. Ba, “A method for stochastic optimization,” in 2015 ICLR Conference, 2015, pp. 1–15, https://arxiv.org/abs/1412.6980
Cited by
About this article

This work was supported by the Russian Science Foundation under the Project 20-79-00332.
