Abstract
In coaxial powder feeding laser cladding, the morphology of the powder flow field is crucial for the forming quality. Therefore, this study utilizes high-speed imaging technology and an Image Super Resolution algorithm to create a laser cladding powder flow field detection system that is capable of detecting and tracking powder particles in the laser cladding environment. The experiment shows that the optimized algorithm has significant improvement in structural similarity indicators, with an improvement rate of nearly 11 %. For powder particle tracking, the distance accuracy of the optimized model is 1.5 lower than that of the unimproved model. In addition, by combining with the Kalman filtering algorithm, the tracking effect of powder particles has been further improved. This paper also found a relationship between powder transfer rate and powder utilization rate. In summary, the powder flow field analysis based on visual detection and image processing technology designed in this study can effectively reflect and predict the trend of changes in cladding quality.
1. Introduction
With the rapid development of industrial manufacturing, China is facing challenges such as limited environmental resources, shortage of raw materials, and difficulties in manufacturing new materials. Additive manufacturing technology has emerged as a vital technique to address these issues, possessing several advantages such as speedy production of intricate and sizable items, preservation of resources, and eco-friendliness [1-3]. In metal additive manufacturing technology, laser metal deposition is an important method that can directly manufacture high-density and high-performance work pieces. Laser Cladding (LC) technology employs high-energy lasers to rapidly liquefy metallic substances and integrate them with the underlying material, serving for the restoration and reinforcement of metal surfaces. To enhance the strength, wear resistance, and biological adaptability of materials, Parida S P et al. utilized manual lamination technology to prepare bidirectional woven E-glass fiber epoxy composite laminates. The performance of four new materials following joint replacement surgery was also scrutinized and laminated composite plates based on layered patterns was created. As a result, the application effect of the materials was significantly improved in corresponding scenarios [4-6]. Sahoo S. et al. designed a hybrid beam made of glass epoxy composite material mixed with fly ash and graphene. Simulated experimental results showed that the designed material had significantly improved stiffness compared to traditional materials [7-8]. Compared to traditional methods, LC technology has wider selectivity, smaller thermal deformation, higher coating density, strong adaptability and flexibility, and shorter cost and cycle. Therefore, it has vital application value in heavy machinery, aerospace, steel repair, ocean shipping, and automotive industry. LC technology can use powder presetting method and synchronous powder feeding method. The control of Powder Flow Field (PFF) is crucial for optimizing Process Parameters (PP), improving the quality and Mechanical Properties of the Cladding Layer (CLMP). However, the application of visual detection in the field of PFF is relatively limited, especially for the recognition and tracking of individual powder particles.
Therefore, this paper utilizes high-speed cameras to capture PFF images, study their characteristics, and propose image processing algorithms to achieve powder particle detection. The purpose of this study is to reflect and characterize the forming quality through PFF image detection, providing guidance for in-situ non-contact real-time monitoring of LC forming quality. This paper aims to enhance PP optimization, improve quality and CLMP, foster the application of LC technology in a variety of fields, and attain the objective of efficient, low consumption, eco-friendly, and sustainable manufacturing. The primary focus of this study is recognizing dust tracking through image processing. However, this paper also encounters challenges, including difficulties in tracking and positioning powder particles as well as environmental and light interference.
The whole content mainly consists of four parts. Part 1 is a conclusion of the current research state of LC related experiments. The second part of this study introduces a powder particle detection model utilizing an enhanced version of the Image Super Resolution (ISR) algorithm. This novel approach sets itself apart from previous research. The third part verifies the performance and application effectiveness of the improved algorithm. Part 4 concludes the work of this paper and proposes ideas and reasonable suggestions for the next research objectives.
2. Related works
The research team presents a summary of previous research on PFF morphology and cladding quality, followed by an introduction to the study's necessity and specific research content in the future. During the development of powder feeding LC, researchers have analyzed the level and manner of PFF involvement in the LC process, as well as its effect on the quality of cladding formation. The impact of PFF morphology on the cladding quality has also been investigated.
The following is the literature related to new cladding technology. Le F. et al. synthesized two kinds of powders by blow molding method and sol gel method, and then prepared nanocrystalline glass ceramics by DC electric field assisted hot pressing. The results indicated that nanocrystals made from particles exhibited higher stability [9]. Xie H. et al. successfully manufactured contact surfaces with metallurgical bonding heterostructures through high-speed LC, which had much higher hardness than commercial alloys. The conductivity of the two materials was similar, and the arc erosion rate and wear rate were lower than commercial contact surfaces [10]. Chai Q et al. studied ultrasonic vibration assisted LC technology to improve the CLMP. The results showed that the relative error of the model in calculating the contour of the covered track did not exceed 10 %, and the model could accurately calculate the temperature field. Ultrasonic vibration could refine the grain size of the cladding track, increasing the average microhardness by 19.9 %. [11]. Yuan S et al. prepared a high entropy alloy coating on Q235 steel using LC to improve the surface properties of engineering components. The results indicated that the coating exhibited good corrosion resistance in both NaCl and HCl solutions [12]. Zhou et al. utilized LC technology to deposit a monorail alloy cladding layer onto a stainless steel substrate, developed a prediction method that considers the geometric qualities of the cladding layer, and optimized the PP with a genetic algorithm. These improvements significantly enhanced the geometric quality of the monorail cladding layer [13]. Huang S et al. proposed a thermal metallurgical mechanical model that included the effects of solid-state phase transformation. The simulation results demonstrated the estimation of high residual stress and the alleviation of non-uniform residual stress, providing a laser scanning strategy for practical manufacturing processes [14]. Bai Q. et al. used electron back-scatter diffraction to study the effects of different pass dynamic spinning techniques on micro-structure, wear resistance, and strengthening mechanism. The results indicated that power spinning could effectively improve the performance of coatings, providing a new process for post-treatment coatings [15].
The following are relevant literature on new materials for cladding processes. Liu Y. et al. showed that the average micro-hardness, fracture toughness, and wear resistance of the composite coating increased by 22.1 %, 121.6 %, and 54.2 %, respectively, by adding appropriate amounts of B4C and vanadium to the powder [16]. Wilms M et al. demonstrated the capability of producing iron-based oxide dispersion-strengthened composite materials by utilizing advanced directional energy deposition technology with high-speed LC. This method effectively discouraged nanoparticle aggregation during the melting stage. Compared with similar materials, the sample produced has a smaller dispersion size and correspondingly higher hardness [17].
The following are relevant literature on cladding experiments. Jia T et al. used a new method to calculate the thermophysical parameters of the material and established a three-dimensional numerical model for multi field coupling of disc LC. The calculation results indicated that the influence of sulfur element on temperature and stress fields was very small [18]. Liu Z. et al. explored the influence of PP on LC composite coatings by establishing a prediction model based on response surface methodology. The experimental results showed that the prediction accuracy was very high [19]. Thawari N. et al. used a pyrometer and laser displacement sensor to monitor the temperature and related deformation of multi-layer LC online. It provided an optimal set of parameters for producing uniform surfacing with moderate deformation and temperature for alloy production [20]. Zhang C. et al. conducted a comprehensive experimental study on tungsten carbide/cobalt deposits sprayed from high-speed oxygen fuel using LC. The results were helpful in optimizing the experiment and achieving the structural evolution of the protective layer of traditional handicraft products by LC [21].
In terms of super-resolution image detection and recognition, Hou H. et al. designed a dual channel joint learning neural network algorithm that can effectively denoise and recognize super-resolution images. There were two relatively independent computing networks in this algorithm, which could perform image denoising and recognition in parallel. The experimental results showed that the accuracy of this algorithm in identifying super-resolution images was higher than traditional algorithms, and it had a certain degree of image denoising ability [22]. Yang X. et al. found that the main super-resolution method based on convolutional neural networks was to increase the number of layers of the network through skip connections to improve the nonlinear expression ability of the model. However, after this operation, the network also became difficult to train and converge. To train a smaller but better performing super-resolution recognition model, a new multi attention mechanism image network was constructed in this study. This network included channel attention mechanism and spatial attention mechanism. This model enhanced feature expression ability by learning the relationship between feature map channels and the relationship between pixels at each position in the feature map, making the reconstructed image closer to the real image. Experiments on public datasets had shown that this model outperformed some of the most advanced algorithms in terms of peak signal-to-noise ratio, similarity, and visual effects [23].
The complexity of PFF images makes it difficult to identify and extract powder particles. It leads to relatively limited research on the application of visual detection in the field of PFF, especially insufficient research on the recognition and tracking of individual powder particles. This paper aims to capture PFF images using high-speed cameras, study their image features, and propose corresponding image processing algorithms to achieve powder particle detection.
3. A powder particle detection model based on improved hyper-partition algorithm
The main content of this chapter is to introduce the ISR algorithm and improve it to recognize, locate, and partition the prominent features of the collected high-speed images, and obtain images related to the PFF. During the transmission process, a method for detecting the motion speed and angle of powder particles has been proposed, and a recognition method for the dynamic behavior characteristics of the PFF in space has been provided.
3.1. Image analysis division and improvement of ISR algorithm
Coaxial powder feeding is a commonly used method in LC, which has unique characteristics compared to other methods such as side axis powder feeding. In coaxial powder feeding technology, the laser beam and powder flow are coupled together and output from the same axis, and then they interact and enter the molten pool. This method involves the three-phase flow process of gas phase, solid phase, and liquid phase, as shown in Fig. 1.
Fig. 1Diagrams of coaxial powder feeding cladding experiment and acquisition system
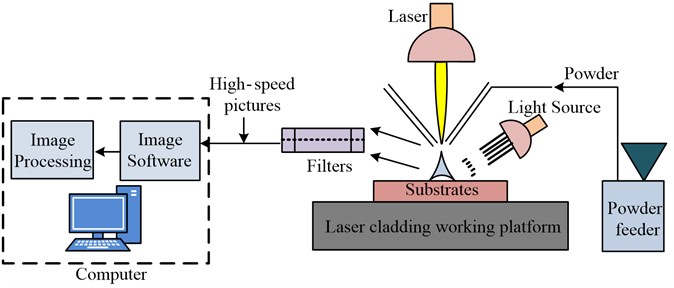
The experimental process in Fig. 1 is carried out from the right to the left. The powder is fed onto the base platform by a powder feeder and heated by a fiber laser light source. High speed cameras are used for image acquisition and filters are taken to filter out environmental light interference. Finally, it is processed and collected by image processing software. To make the image of PFF clearer, ISR algorithm is introduced to improve LC detection, and low resolution in painting is repaired or reconstructed into high resolution image through software processing, and details are optimized. This study uses the Super Resolution CNN (SRCNN) model in learning methods to process images and improve it. Fig. 2 shows the structure of SRCNN.
Fig. 2Structure diagram of the SRCNN network model
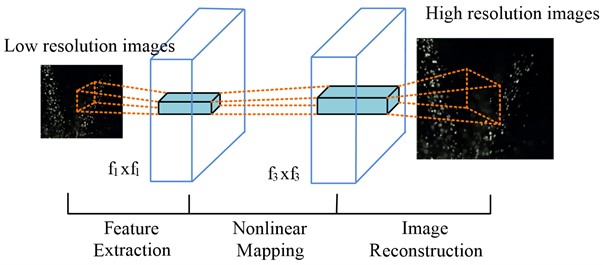
The SRCNN model in Fig. 2 consists of three convolutional layers. The first layer extracts the features of the image and represents the low resolution extracted features as high-dimensional vectors, as shown in Eq. (1):
where, represents the collected low resolution image. and represent filters and biases, respectively. The second convolution kernel is used to map the high-dimensional vector input at the first level to another high-dimensional vector through nonlinear mapping. The calculation process is Eq. (2):
where, is the output high-dimensional resolution image block. and are filters and biases. The function of the third convolutional kernel is to reconstruct high-resolution images, as shown in Eq. (3):
where, is the reconstructed high-dimensional resolution image block, while and are both filters and biases. In this study, cavity convolution is introduced to replace the first layer of convolution, so as to increase the size of Receptive field under the same computing resources. The calculation formula is Eq. (4):
where, is the input dimension, is padding, is the convolutional kernel, is the extension factor, and is the step size. Cavity convolution can lift the receptive field without increasing the training parameters. The method of introducing cavity convolution in SRCNN is listed in Fig. 3.
Fig. 3The introduction of cavity convolution
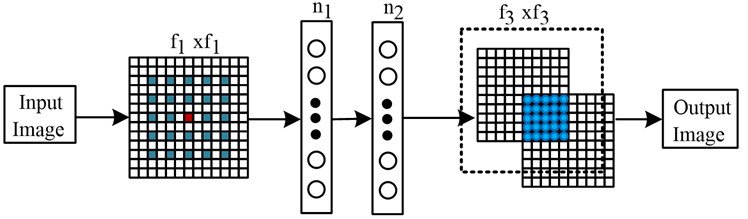
Fig. 3 first performs feature extraction on the input image, and then fills a hole with a value of 0 between adjacent values in the convolutional kernel. The white grid in Fig. 3 represents the input image, the blue grid represents the convolution kernel, and the red grid represents the pixels being processed. In the training process of SRCNN, the model evaluation loss function between the input and the original image is Eq. (5):
where, is the Mean squared error loss function. is the image size. and are the pixel value of original and output image. The loss function is improved by introducing structural similarity and PSNR, which is shown in Eq. (6):
where, are the weight parameter for structural similarity and PSNR, respectively. is the max-grayscale value. and refer to the mean values. and represent the variances, and is the covariance of Figures and . and are constants.
3.2. Optimization processing of powder flow transport image based on combined algorithm
During the coaxial powder feeding LC process, the powder will form defects such as sticky powder and unmelted powder on the melt channel, melt pool, and substrate. To study powder flow and reflect the quality of cladding, it is necessary to analyze the dynamic behavior and transport morphology characteristics of the PFF. Due to the large number of powder particles, to facilitate research and statistics, this paper proposes an image processing algorithm, as displayed in Fig. 4.
Fig. 4Route of PFF image particle processing
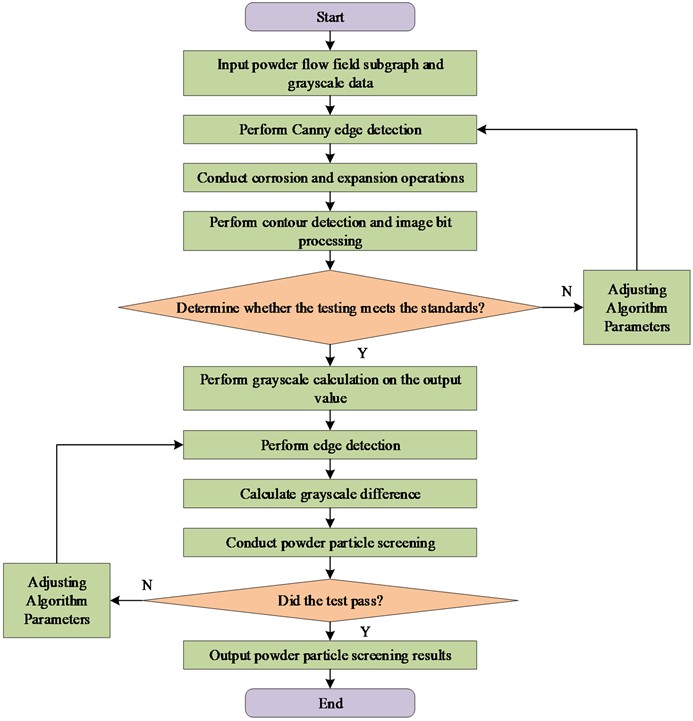
The route in Fig. 4 includes two stages: the original image noise background removal and the focal plane powder particle removal. In the first stage, the image is grayed out and the Canny edge detection algorithm is used to obtain the edge information of the object. Corrosion and dilation operations are performed, and the processing results are obtained through contour detection and logical operations. In the second stage, on the ground of the first stage results, the image is grayed out, contour detection is performed, and calculations are performed. The threshold difference is adjusted to filter the required particles, and the processed image is ultimately obtained. Target tracking uses Distance Precision (DP) to represent the distance between the tracking result and the actual box, with smaller values indicating better tracking performance. The calculation formula is Eq. (7):
where, is the center position of the target tracking result box for the -th image in the -th video. is the center position of the target real box for the -th image in the -video. is the quantity of video frames for video. is the gross of tracked videos. In this manuscript, DaSiamRPN algorithm and Kalman filter algorithm are combined to track discontinuous powder particles in the PFF. This combination can improve the tracking of particles in the PFF, overcome the problems of large number of particles, high similarity and unclear characteristics, and improve the tracking performance. Fig. 5 shows its network framework. As shown in Fig. 5, the data extracted by the DaSiamRPN algorithm will be input into a Kalman filter, which is more suitable for processing data with high similarity. Finally, the final result will be output by the Kalman filter.
Fig. 5Network structure of SiamRPN
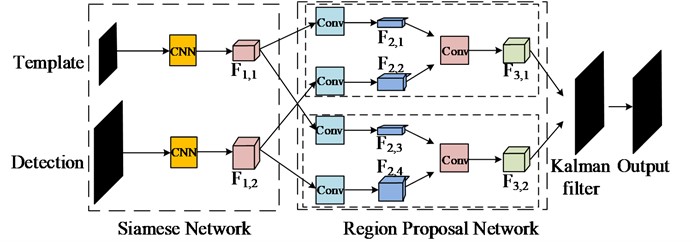
SimaRPN in Fig. 5 is an algorithm used for target tracking. The DaSiamRPN algorithm combines non maximum suppression and the distractor aware function to improve tracking accuracy. The use of DaSiamRPN in PFF images can better track powder particles. In addition, Kalman filter is a Linear filter, which can be used to predict the position of powder particles, especially in the case of disappearance and appearance of powder particles. Eq. (8) is the discrete model of the Kalman filter algorithm:
where, and mean the state variables at time and . means the observed variable. is the control matrix. represents dynamic noise. is the observation noise. and are State-transition matrix and state control matrix. is the observation matrix. Since the Motor system of powder particles has no control input, the equation of state of the final system is Eq. (9):
where, is the measurement noise. The motion of most powder particles within the camera’s field of view can be regarded as a uniform linear motion, and the State-transition matrix is Eq. (10):
where, is the time interval. The system only needs to take the position of the state variable to observe the variables, and its observation matrix is Eq. (11):
During the cladding process, powder is ejected from the nozzle and transported to the molten pool, while some powder particles also sputter from the cladding molten pool area. Therefore, based on the distribution area of the PFF image, the powder transfer ratio index can be defined as Eq. (12):
where, and respectively represent the number of powder particles counted in the powder splashing area and powder flow conveying area in the Figure. The powder utilization rate significantly affects both the effectiveness and quality of the cladding process. This rate is determined by the ratio between the added mass of the melt after cladding and the quality of the cladding powder used. The powder utilization rate calculated based on the weighing method in this paper is Eq. (13):
where, is the mass of the substrate before cladding, is the common mass of the substrate and cladding layer after cladding, and is the mass of the powder material used during the cladding process. The powder transfer ratio and powder utilization rate have the same trend of variation influenced by PP. The linear fitting between the two satisfies Eq. (14):
where, is the fitting function, and 1.1144 and 17.24 are empirical parameters. During the LC process, powder particles splatter and adhere to the cladding layer’s cover, affecting surface roughness. The adhesion of powder particles depends on the collision elasticity and the adhesion force of the melt. Comparing the ratio of these two forces can determine whether there is powder sticking phenomenon, as shown in Eq. (15):
where, is the surface tension, is the performance related constant of the powder material, is the size of the powder particle radius, and is the motion speed of the powder particles.
4. Obtaining dynamic characteristics of powder particle distribution and PFF based on ISR algorithm
The main content of this chapter is to design and conduct a computational experiment to test the performance and practicality of the designed powder particle detection algorithm. This experiment employs grayscale histogram statistics for determining both the grayscale and area range of powder particles in various states. It then applies dual threshold segmentation and area screening techniques to identify and tally the powder particles. By tracking the powder particles, the velocity and angle distribution of the PFF are detected. Finally, the proportion of powder particles splashed at low speeds and angles is analyzed, reflecting the surface roughness of the cladding layer.
4.1. Powder particle recognition detection and statistics
The dataset used in this experiment was obtained in a metal smelting and processing workshop. The research team arranged high-speed cameras in the workshop to continuously capture images of powder movement during the work process for multiple days. Finally, a total of 28665 images were obtained, with a size of 14.26 MB and an image format of jpg. The dataset was divided into a test set and a training set in a 7:3 ratio based on the set aside method. Training sets were used to train the model. The training set data would be input into the constructed model using Python language and various comparison models to complete the training of all models. Then, the original PFF images from the test set would be input into the network for processing, resulting in a higher resolution PFF image for subsequent tracking progress and image quality comparison analysis. Firstly, the research team used the K-Cross Validation method to validate the robustness and stability of the design algorithm. The test results showed that if the sample was divided into 10 points, the ratio of the standard deviation of the loss function calculated for each sample to the average loss function was 0.26 %. This indicated that the designed method had good robustness and stability, and could be used for subsequent experiments and statistics. Fig. 6 shows the results of the training.
Fig. 6Comparison of PFF image evaluation results
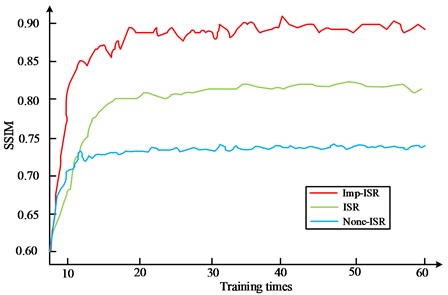
According to the results in Fig. 6, in contrast with the original SRCNN, the improved network showed a significant improvement in the Structural Similarity Index (SSIM) after training more than 50 times, with a stable SSIM value of 0.94. The SSIM values of the models without improved algorithms and without the use of ISR algorithms were stable at 0.83 and 0.74, respectively. This indicates that the reconstructed high-resolution PFF image has not been distorted after magnification, and the details of the powder particles have been enhanced.
To understand the improvement effect of the improved algorithm designed in this study, ablation experiments are now being conducted, and the statistical results are shown in Table 1. In Table 1, “Imp-ISR_SRCNN” represents ISRs constructed based on traditional SRCNN. "Imp-ISR_daSiamRPN” represents ISRs constructed without DaSiamRPN module. “Imp-ISR_Kalman filtering" represents ISRs constructed without Kalman filter conditions. Table 1 shows that the final improved ISR algorithm designed in this study performs the best in SSIM, Peak signal-to-noise ratio (PSNR), and loss function value indicators after training. This indicates that the improvements made in this study are necessary and effective.
After processing the image of the powder flow area, the pixel distribution maps for various grayscale values are obtained in Fig. 7. The legends with white, yellow, and blue filling colors in Fig. 7(b) represent powders with grayscale values ranging from 0 to 75, 75 to 155, and 155 to 255 in the powder flow field.
Table 1Results of ablation experiment
Algorithm scheme | SSIM | Normalized PSNR | LOSS value |
Imp-ISR | 0.94 | 0.85 | 0.75 |
Imp-ISR_SRCNN | 0.86 | 0.72 | 4.36 |
Imp-ISR_DaSiamRPN | 0.88 | 0.81 | 2.01 |
Imp-ISR_Kalman filtering | 0.91 | 0.83 | 1.69 |
Fig. 7Histogram distribution of PFF image
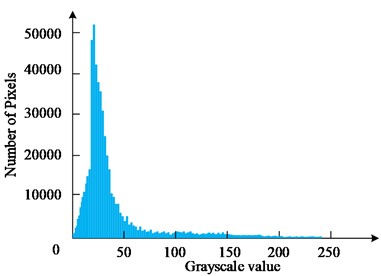
a) Histogram of number of pixels
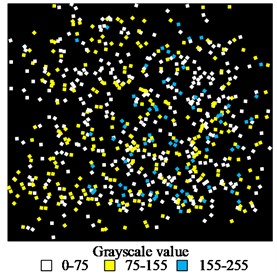
b) Powder flow field simulation diagram
Fig. 7(a) shows the histogram of the pixel numbers, which shows that the grayscale values of the powder flow conveying area and the powder flow splashing area are mainly concentrated around 75 to 155. The grayscale values of 75 to 255 account for a relatively small proportion. Fig. 7(b) is a simulation diagram of the distribution of particle pixels with different grayscale values in space. Based on the manually selected powder particle analysis results, powder particles in different states can be distinguished by differences in grayscale values and pixel areas. For example, the grayscale threshold is represented by white squares at 75. A grayscale threshold between 75 and 155 and a pixel area between 3 and 20 are yellow squares. A grayscale threshold above 155 is a blue square. Yellow squares are most widely distributed in space. To facilitate accurate statistics of powder particle velocity, hierarchical statistics are performed, followed by velocity detection of powder particles in the powder flow conveying area. Fig. 8 shows the results.
Fig. 8Results of velocity distribution in powder splash field
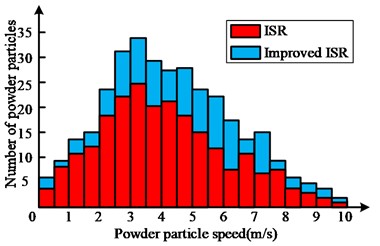
a) Results of velocity distribution in powder splash field
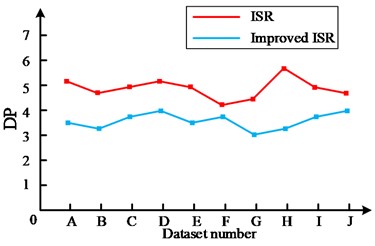
b) DP value in each group
From the results in Fig. 8(a), the powder particle velocity distribution in the powder flow conveying area of different models is relatively consistent, and the velocity changes of each group are small. The traditional ISR model is generally lower in terms of statistical pixel particles compared to the improved ISR model, and the two algorithm models have the highest number of particle velocities in the 2-6 m/s range. This is because in this area, the powder particles are affected by both the protective gas and gravity, and the protective gas parameters remain unchanged. The horizontal axis in Fig. 8 represents the image data of metal smelting powder extracted at different times, which are divided into A, B, C, D, E, F, G, H, I, and J numbers according to the data generation time. From the DP values of different algorithm models in eight datasets A to J in Fig. 8(b), the DP value of the optimized ISR is basically around 3.5. The traditional ISR algorithm is higher than the improved algorithm, with a DP value around 5. Fig. 9 shows the angle detection results of the powder splash zone.
Fig. 9Results of angle detection in powder splash field
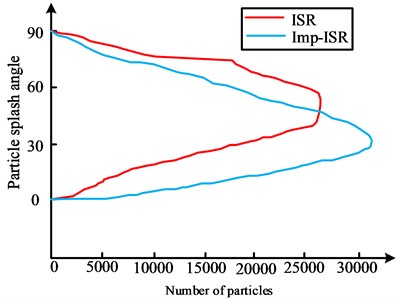
From Fig. 9, the majority of powder particles in the powder splash zone have a relatively small flight angle, concentrated at approximately 30 degrees, as quantified by the improved ISR measurement. This is mainly due to the collision between powder particles and the rebound effect after collision with the solid substrate. However, the majority of particles identified by traditional ISR exhibit larger angles, largely concentrated at around 50 degrees. This is due to the fact that particles with small high-speed deflection angles tend to fall outside the molten pool and thus are not easily captured by the model. Through the detection data of speed and angle, it is discovered that the slower flying powder particles have lower rebound height, smaller angle, and closer distance. Faster splashing powder particles have a larger rebound angle and a longer distance.
4.2. Analysis of the influence of dynamic characteristics of PFF on the quality of cladding
Based on the aforementioned research and analysis, the correlation between PFF morphology characterization indicators in high-speed images and the cladding layer's quality is investigated. In powder feeding LC, the powder utilization rate represents the proportion of powder entering the molten pool in the total powder amount. Table 2 shows the relationship between powder transfer ratio and powder utilization rate in this experiment. As shown in Table 2, the and are calculated from the basic data using corresponding calculation formulas, and the reliability of the calculation results is verified through expert group inspection. This study invites 10 domestic metal smelting experts to participate in the research, assisting in verifying the experimental steps and results. The verification results show that all experts believe that the calculation results in Table 2 are correct.
From Table 2, as the laser power rises, the powder utilization rate also increases. Through analysis, it can be concluded that the influence of powder transfer ratio and powder utilization rate on laser power is consistent. However, if the powder feeding rate outstrips the threshold, the powder utilization rate will decrease. Excessive powder inhibits complete heating and melting of the powder flow by the laser, consequently leading to reduced utilization. In addition, under the same laser power and powder feeding rate, changing the scanning rate will slightly reduce the effective utilization rate of the powder. Therefore, powder transfer ratio based on powder image detection can replace real-time monitoring of powder utilization rate, providing a basis for real-time control of the forming process. Fig. 10 shows the influence of different laser values on the cladding layer’s flatness.
Table 2Calculation results of powder transfer rate and powder utilization rate (%)
Group | Laser power (W) | Powder delivery rate (rad/min) | Scan rate (m/s) | ||
1 | 1000 | 2 | 0.004 | 65 | 61 |
2 | 1200 | 3 | 0.004 | 76 | 65 |
3 | 1000 | 3 | 0.004 | 70 | 60 |
4 | 1200 | 2 | 0.006 | 75 | 65 |
5 | 1000 | 2 | 0.006 | 71 | 64 |
6 | 1200 | 3 | 0.006 | 78 | 70 |
Fig. 10(a) is the statistical results of traditional ISR, where the percentage of influence of laser power is 44.6 %, scanning rate is 23.1 %, and powder transfer is 32.3 %. Fig. 10(b) shows the statistical results of the improved ISR, with a scanning rate impact percentage of 34.2 %, laser power of 41.1 %, and powder transfer of 24.7 %. The variation range of both is relatively small, indicating that the laser power has the most outstanding impact on the roughness of the cladding layer, while the powder feeding rate has the smallest impact. It should be noted that although the powder feeding rate has the smallest impact, the splashed powder particles can also have an impact on the surface roughness of the cladding layer. Fig. 11 shows the distribution data of sticking powder formed by splashing powder particles at different speeds and angles. To reduce the workload of data statistics, only 1 % of all powder particles are randomly sampled for this calculation.
Fig. 10Percentage effect of different laser parameters on the flatness of the molten layer
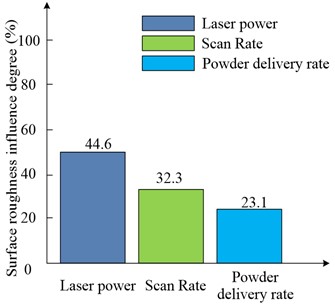
a) Traditional ISR algorithm model detection results
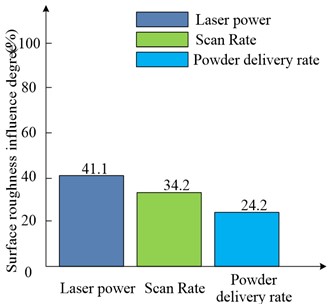
b) Improved ISR algorithm model detection results
According to the results in Fig. 11, the velocity and angle of powder particles have an impact on the number of adhered particles. In Fig. 11(a), as the speed of powder particles increases, the rapid rebound increases the proportion of splashed powder, resulting in a decrease in the number of adhered powder particles. In Fig. 11(b), as the powder angle increases, the number of collisions between most powder particles and the substrate decreases, causing a deduction in the particle numbers that are prone to adhesion. An expert group is invited to validate the data in Fig. 11. The validation results indicate that the expert group members believe that the overall trend displayed in Fig. 11 is correct and in line with industry common sense. Although the overall trend of ISR before and after improvement is consistent, traditional ISR is about 10 % less accurate in counting high-speed and high angle particles compared to improved ISR, so it is not as accurate as the improved algorithm. The improved ISR algorithm utilizes both the DaSiamRPN algorithm and the Kalman filter algorithm to process data, resulting in significant data compression and extraction. This approach allows for the extraction of correlation relationships in high similarity data. This is also the reason and advantage of combining the DaSiamRPN algorithm and the Kalman filter algorithm for powder particle data optimization in this study. In short, splashed powder particles with different speeds and angles will fall at different positions, while splashed powder particles with low speeds and angles are more likely to form surface adhesion.
Fig. 11Sticky powder distribution formed by sputtering powder particles at different speeds and angles
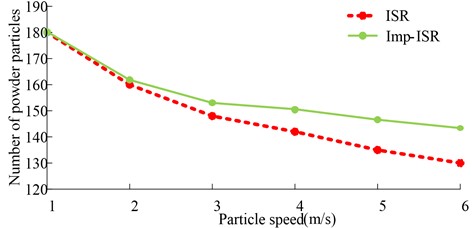
a) Particle adhesion distribution at different speed
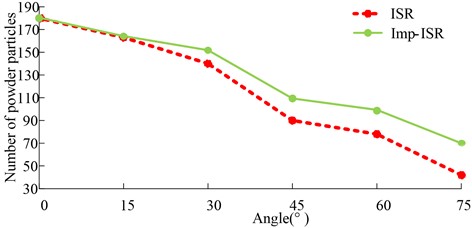
b) Particle adhesion distribution at different angle
5. Conclusions
This study adopted high-speed imaging technology to design a tracking and recognition system for metal smelting powder, and explored the relationship between powder movement and cladding quality. The experimental results showed that the improved ISR algorithm had a SSIM value of 0.91, which was superior to the unmodified algorithm and the model without ISR algorithm. This indicated that the final designed recognition system had stronger dust recognition ability. The improved ISR algorithm mainly focused on the flying angle of powder particles around 30 degrees, while the traditional ISR algorithm focuses around 50 degrees. This indicates that the improved ISR algorithm performed better in capturing high-speed and large angle particles. The experimental data also showed that an increase in laser power could improve powder utilization, but excessively high powder feeding rates and varying scanning rates might lead to a decrease in utilization. Comparing the statistical results of the two algorithm models, it was found that the speed and angle of powder particles have an impact on the amount of adhesion. Specifically, high-speed and rapid rebound reduced adhesion, while large angles reduced collisions. In summary, the improved ISR algorithm model was more accurate than traditional models and more suitable for capturing high-speed and large angle adhesive particles. The obtained research results will help to design a more valuable metal smelting powder recognition final system in the future, which is also the significance of this study for future research. However, this paper is limited to exploring the relationship between the macroscopic quality of cladding and the morphology of PFF. In fact, the influence of PFF on the quality of cladding covers multiple aspects such as porosity, mechanical properties, micro-structure of cladding bonding, and gold. This is a deficiency in this paper, and further research needs improvement.
References
-
G. Wang, C. Ma, T. Hu, and T. Wang, “Ceramic 3D printing via dye-sensitized photopolymerization under green LED,” 3D Printing and Additive Manufacturing, Vol. 10, No. 2, pp. 310–317, Apr. 2023, https://doi.org/10.1089/3dp.2021.0204
-
L. S. O. Pires, D. G. Afonso, M. H. F. V. Fernandes, and J. M. M. de Oliveira, “Improvement of processability characteristics of porcelain-based formulations toward the utilization of 3D printing technology,” 3D Printing and Additive Manufacturing, Vol. 10, No. 2, pp. 298–309, Apr. 2023, https://doi.org/10.1089/3dp.2021.0102
-
S. James and J. Zarate, “Preliminary study on volumetric 3D printing using visible light,” The International Journal of Advanced Manufacturing Technology, Vol. 124, No. 3-4, pp. 1245–1251, Jan. 2023, https://doi.org/10.1007/s00170-022-10603-7
-
S. P. Parida and P. C. Jena, “Multi-fillers GFRP laminated composite plates: fabrication and properties,” Indian Journal of Engineering and Materials Sciences, Vol. 29, No. 6, pp. 817–825, 2022, https://doi.org/10.56042/ijems.v29i6.70296
-
S. P. Parida, P. C. Jena, S. R. Das, D. Dhupal, and R. R. Dash, “Comparative stress analysis of different suitable biomaterials for artificial hip joint and femur bone using finite element simulation,” Advances in Materials and Processing Technologies, Vol. 8, No. sup3, pp. 1741–1756, Oct. 2022, https://doi.org/10.1080/2374068x.2021.1949541
-
S. P. Parida, P. C. Jena, and R. R. Dash, “Dynamics of rectangular laminated composite plates with selective layer-wise fillering rested on elastic foundation using higher-order layer-wise theory,” Journal of Vibration and Control, Vol. 29, No. 23-24, pp. 5598–5615, Dec. 2023, https://doi.org/10.1177/10775463221138353
-
S. Sahoo, S. P. Parida, and P. C. Jena, “Dynamic response of a laminated hybrid composite cantilever beam with multiple cracks and moving mass,” Structural Engineering and Mechanics, Vol. 87, No. 6, pp. 529–540, Sep. 2023, https://doi.org/10.12989/sem.2023.87.6.529
-
X. Zhao, C. Li, and T. Yu, “Effect of B4C on CBN/CuSnTi laser cladding grinding tool,” The International Journal of Advanced Manufacturing Technology, Vol. 119, No. 9-10, pp. 6307–6319, Apr. 2022, https://doi.org/10.1007/s00170-021-08460-x
-
L. Fu, L. Li, Y. Cheng, B. Wang, and H. Wu, “Influences of powder morphology on the densification and microstructure of a ZrO2‐based nanocrystalline glass-ceramic,” Journal of the American Ceramic Society, Vol. 106, No. 1, pp. 722–737, Jan. 2023, https://doi.org/10.1111/jace.18767
-
H. Xie et al., “CuCr/Cu contact material fabricated via high-speed laser cladding,” The International Journal of Advanced Manufacturing Technology, Vol. 124, No. 1-2, pp. 397–410, Jan. 2023, https://doi.org/10.1007/s00170-022-10487-7
-
Q. Chai, H. Zhang, C. Fang, X. Qiu, and Y. Xing, “Numerical and experimental investigation into temperature field and profile of Stellite6 formed by ultrasonic vibration-assisted laser cladding,” Journal of Manufacturing Processes, Vol. 85, pp. 80–89, Jan. 2023, https://doi.org/10.1016/j.jmapro.2022.11.035
-
S. Yuan et al., “FeCoNiCrAl0.6 high-entropy alloy coating on Q235 steel fabricated by laser cladding,” Materials Science and Technology, Vol. 39, No. 6, pp. 705–713, Apr. 2023, https://doi.org/10.1080/02670836.2022.2132734
-
Z. Zhou, Y. Du, G. He, L. Xu, and L. Shu, “Optimization and characterization of laser cladding of 15-5PH coating on 20Cr13 stainless steel,” Journal of Materials Engineering and Performance, Vol. 32, No. 3, pp. 962–977, Feb. 2023, https://doi.org/10.1007/s11665-022-07157-w
-
S. Huang et al., “Study on residual stress evolution of laser cladding low chromium carbon alloy on low-pressure rotor,” Journal of Manufacturing Processes, Vol. 85, pp. 31–42, Jan. 2023, https://doi.org/10.1016/j.jmapro.2022.11.042
-
Q. Bai, Q. Li, J. Zhang, R. Wang, C. Zhao, and Y. Liu, “Effect of power spinning on microstructure and wear resistance of high-speed laser cladding Fe-based coating,” The International Journal of Advanced Manufacturing Technology, Vol. 125, No. 7-8, pp. 3255–3265, Apr. 2023, https://doi.org/10.1007/s00170-023-10917-0
-
L. Yingpeng, L. Yunlong, and F. Hanguang, “Improvement properties of laser cladding Ni45-Cr3C2 coatings by adding B4C and V,” Materials Science and Technology, Vol. 39, No. 4, pp. 443–453, Mar. 2023, https://doi.org/10.1080/02670836.2022.2122175
-
M. B. Wilms, N. Pirch, and B. Gökce, “Manufacturing oxide-dispersion-strengthened steels using the advanced directed energy deposition process of high-speed laser cladding,” Progress in Additive Manufacturing, Vol. 8, No. 2, pp. 159–167, Apr. 2023, https://doi.org/10.1007/s40964-022-00319-1
-
T. Jia, C. Li, S. Jia, Y. Liu, and X. Han, “Influence mechanism of active elements on multi-field coupling in laser cladding Fe60 process,” The International Journal of Advanced Manufacturing Technology, Vol. 124, No. 1-2, pp. 411–428, Jan. 2023, https://doi.org/10.1007/s00170-022-10518-3
-
Z. Liu, G. Lian, C. Zhao, J. Peng, and Y. Zhang, “The forming control method of Ni35A + TiC composite coatings on cylindrical substrate deposited by laser cladding,” Journal of Materials Engineering and Performance, Vol. 32, No. 3, pp. 1333–1346, Feb. 2023, https://doi.org/10.1007/s11665-022-07160-1
-
N. Thawari, C. Gullipalli, J. K. Katiyar, and T. V. K. Gupta, “In-process monitoring of distortion and temperature in multi-layer laser cladding of Stellite 6 and Inconel 718 alloys,” Proceedings of the Institution of Mechanical Engineers, Part B: Journal of Engineering Manufacture, Vol. 237, No. 1-2, pp. 3–15, Jan. 2023, https://doi.org/10.1177/09544054221092937
-
C. Y. Zhang and M. Jean, “Crack evolution and computational model based thermal stress evaluation of laser cladding based on HVOF sprayed WC/Co deposits,” Materials Science, Vol. 29, No. 1, pp. 85–96, Feb. 2023, https://doi.org/10.5755/j02.ms.30876
-
H. Hou, Q. Jin, G. Zhang, and Z. Li, “CT image quality enhancement via a dual-channel neural network with jointing denoising and super-resolution,” Neurocomputing, Vol. 492, No. 7, pp. 343–352, Jul. 2022, https://doi.org/10.1016/j.neucom.2022.04.040
-
X. Yang, X. Li, Z. Li, and D. Zhou, “Image super-resolution based on deep neural network of multiple attention mechanism,” Journal of Visual Communication and Image Representation, Vol. 75, No. 1, p. 103019, Feb. 2021, https://doi.org/10.1016/j.jvcir.2021.103019
About this article

The research is supported by Key scientific research project of Nanjing Vocational College of Science and Technology: Research on Optimization of Processing Parameters of Fe Based Materials Based on Laser Deposition Technology (Fund No.: NHKY-2020-07); Key scientific research project of Nanjing Vocational College of Science and Technology: Numerical Simulation and Experimental Research on Thermal Coupling of Laser Cladding (Fund No.: NJPI-2021-09); Jiangsu Province Higher Vocational Education High Level Professional Group Construction Project (Su Jiao Zhi Han [2021] No. 1: 1-10); The “Research Beidou Plan (Version 2.0)” project of Nanjing Vocational College of Science and Technology (Talent Cultivation Engineering).
The datasets generated during and/or analyzed during the current study are available from the corresponding author on reasonable request.
Yuan Tong: writing-original draft preparation, writing- reviewing and editing, formal analysis, visualization. Hongbo Wang: formal analysis, data curation. Zhaowen Jin: software, data curation.
The authors declare that they have no conflict of interest.
