Abstract
Foundation pit excavation can cause settlement and displacement of surrounding existing buildings and roads. In order to study the influence of soil unloading on the surrounding buildings during pit foundation excavation, the application of a pile-anchor retaining structure in a deep foundation pit was studied, with the deep foundation pit project of Anhui Bright Pearl Mall as the research subject. Through theoretical analysis, field measurements, and FLAC3D numerical simulations, the supporting structure was comprehensively analyzed. A comparison was made between the measured displacement data and the numerical simulation results of the supporting structure and the surrounding environment during the excavation process of the foundation pit. The results indicate that the model results, obtained through the use of the FLAC3D software for numerical simulations, generally align with the field data. This approach can more accurately reflect the evolutionary laws of soil pressure and deformation during the excavation of the foundation pit. The maximum displacement of the horizontal displacement monitoring point in this project's foundation pit is 25.96 mm, which is less than the monitoring alarm value of 30 mm. The horizontal displacement monitoring of the sidewall of the foundation pit is crucial among them. An analysis of the three major causes of numerical deviation provides valuable insights for the design of deep foundation pit supporting structures.
1. Introduction
Deep foundation pits are commonly used in urban construction for high-rise buildings, large underground shopping malls, and subway stations. These projects have been proliferating rapidly, much like bamboo shoots sprouting after spring rain. Consequently, foundation pit engineering is advancing towards larger areas and greater depths [1]. The calculation theory and construction technology for the stability of deep foundation pit engineering have become major research topics in the field of civil engineering academia. Professor Hu [2] from Tongji University described the monitoring of pile foundation engineering of a residential building on Taixing Road in Shanghai and the experience of large foundation pit construction in his book of Soil Mechanics and Environmental Geomechanics. Cao [3] took a deep foundation pit of Beijing Metro Line 10 as an example to summarize the research results of composite soil nailing, and discussed the application of composite soil nailing in deep foundation pit by combining finite element method and numerical simulation with measured structure. Yang [4] optimized the design drawing and reduced the reinforcement of the retaining pile by monitoring data and 3d numerical model supervised by MIDAS/GTS software based on the deep foundation pit project of section 3 tunnel of Beijing Metro Line 15. Academician Qian [5] believed that urban underground space development in China has reached its peak, with foundation pit engineering and monitoring being the primary challenges and focal points of construction. This is due to the diversity and complexity of geotechnical engineering geological conditions, resulting in extended construction periods, excavation challenges, and significant impacts on the surrounding environment [6-7]. Shen [8] utilized Mindlin and Pasternak models to study tunnel displacement caused by deep foundation pit excavation. Xi [9] employed FLAC3D numerical simulation software to investigate the deep foundation pit excavation at Shanghai Hongqiao SOHO, effectively mitigating its impact on the surrounding buildings. Li [10] introduced a finite element calculation method for foundation pit dewatering, resulting in improved accuracy in predicting total water inflow. Ye and Li [11] conducted numerical simulations using Plass3D finite element software, using the Lanzhou deep foundation pit and a large foundation pit as their case studies. Meanwhile, Zhang [12] utilized FLAC3D to perform numerical simulations based on the Jinan Lixia Medical Care Center project, providing valuable theoretical insights into the relationship between foundation pits and subways. Lastly, Xu [13] focused on the Hangzhou Pipe Gallery foundation pit project, applying three-dimensional numerical simulations to study the interactions between foundation pits and adjacent structures, particularly in the context of different retaining structures and large-diameter pipelines. This work provides a theoretical foundation for similar construction projects.
Currently, there is no universally accepted constitutive model and precise quantitative analytical method to accurately assess the impact and evolution of forces, deformations, and stability in foundation pit soils, supporting structures, and neighboring buildings. In practical engineering, information technology is commonly employed to dynamically monitor the entire excavation and support process. Typically, a combined approach that integrates estimated and actual measurements is used to comprehensively evaluate the stability of foundation pit support. This method effectively merges theoretical principles with practical experience [14]. Moreover, there’s a notable absence of an analysis of the typical discrepancies between numerical calculations and excavation monitoring values, as well as the underlying causes of these deviations.
The displacement analysis and numerical simulation of pile anchor support structure in the excavation of deep foundation pit provide valuable insights for improving the stability and safety of construction projects in densely populated urban areas. It is an important resource for geotechnical engineers to design more efficient support structures in scenarios such as tall buildings, underground facilities, and infrastructure development. The study highlights the importance of monitoring, data analysis and simulation, with the potential to improve numerical simulation software and improve safety practices in the construction industry. In conclusion, it contributes to the safety and efficiency of modern urban building and infrastructure development. Please refer to or explain if there is any industrial guideline available for the soil-structure relationship assessment [15].
This article is based on the Anhui Pearl Market Project and employs FLAC3D for studying the foundation pit support structure through numerical simulation. The study integrates theoretical analysis, field measurements, and FLAC3D numerical simulations to comprehensively analyze the supported structure. It compares the measured data and simulation results of the deviation in displacement of the supporting structure during the foundation pit excavation process and its impact on the surrounding environment. The primary focus of the analysis is on the reasons behind the deviation between numerical calculations and on-site monitoring data. This analysis aims to shed light on the evolution patterns of soil pressure and deformation during the foundation pit excavation process and the deviations observed in numerical simulations. By understanding the reasons for these deviations, this study provides theoretical and practical references for optimizing engineering implementation plans.
2. Foundation pit support scheme
The Anhui Bright Pearl Shopping Mall and Office Housing Project is situated in a bustling area, enclosed by Shengli Road, Yan'an Road, and Tiyu Road. It is surrounded by vital establishments such as the Municipal Education Bureau and Bengbu No. 6 Middle School. The nearest distance between these institutions and the pit edge is a mere 5.4 meters, making the situation around the foundation pit exceptionally complex, necessitating a high degree of deformation tolerance. The foundation pit measures 132 meters in length and 39 meters in width, forming a predominantly rectangular shape. The effective support depth ranges from 4.0 to 8.35 meters. The safety rating for the north and south side walls is Level 2, while the remaining side walls are classified as Level 1.
Based on drilling results, the proposed site at a depth of 47.00 meters underground reveals the presence of nine distinct engineering geological layers. The primary soil and rock properties encountered include a mixture of clay, silt, and granite. The soil mechanical properties of the key structural strata are presented in Table 1. Additionally, laboratory tests and empirical soil data have been used to establish the soil mechanical parameters provided in Table 2.
Table 1Table of mechanical indexes of each geotechnical layer
Number and name of rock and soil layers | Characteristic value of foundation bearing capacity / (kPa) | Compression modulus / (MPa) | Base bed coefficient of foundation soil KV (KN/m3) |
2) Layers of silty clay | 220 | 9.80 | 40000 |
3) Layers of silt | 180 | 7.18 | |
4) Layers of clay | 180 | 6.56 | |
5) Layers of silty clay | 210 | 8.69 | |
6) Layers of silty clay | 230 | 10.92 | |
7) Fully weathered granitic mixed rock | 280 | ||
8) Strong weathering granitic mixers | 500 | ||
9) Interbedded weathered granitic melange | 2000 |
Table 2Design soil mechanical parameters of foundation pit
Soil serial number | Name of the soil | Severe (kN/m3) | Triaxial non-consolidation and non-drainage shear | |
Cohesive force (kPa) | Angle of internal friction (°) | |||
2) | Silty clay | 19.9 | 35.6 | 10.7 |
3) | Silty soil | 18.9 | 13.7 | 10.8 |
The design of the supporting structure is based on a comparison of various schemes, taking into account both safety and economic considerations. For this project, the selected supporting system is a combination of bored piles and prestressed anchor cables. To protect the soil between the piles, a layer of 80 mm thick C20 fine stone concrete is sprayed. In different areas of the project, φ1000 mm and φ900 mm bored piles are employed, with varying spacing (2000 mm and 1800 mm) and pile lengths ranging from 9 m to 17.5 m based on the site conditions. On the northern side, a slope and soil nail system is used. In the northeast corner, two prestressed anchor cables are added to the slope system. On the remaining portions of the east side, a combination of slope, soil nail, and one prestressed anchor cable is employed. On the west side, a supporting pile is combined with two prestressed anchor cables. The prestressed anchor cables consist of two strands of φ15.2 mm steel strand, inclined at 15° relative to the horizontal direction, with a 150 mm hole diameter for the anchor cable.
In the calculation of the overall stability of it, the Swedish strip method is adopted, and the width of soil strip in the strip method is 1.00 m. After calculation, the safety coefficient of it stability after the pile-anchor retaining structure is adopted, 1.323 > 1.30, which meets the requirements of the code.
The pile-anchor retaining system:
Resistance to jitter and lateral loading: Pile anchoring systems provide strong vertical and horizontal support and therefore excel in terms of resistance to bounce and lateral loads.
High load-bearing capacity: Pile anchoring systems are often able to withstand large vertical loads, which makes them very advantageous in engineering projects that need to support heavy structures or withstand large loads.
Long life and durability: Due to the use of durable materials such as reinforced concrete or steel, and often buried deep in the soil, pile anchoring systems often have long-term durability and require less maintenance.
3. Field monitoring data analysis
3.1. Layout of monitoring points
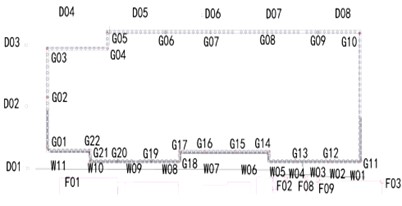
Horizontal and vertical displacements, as well as settlement measurements, are taken at the crown beam of the retaining structure pile and various locations, including roads and walls. Displacement monitoring points are labeled from G01 to G22 in a clockwise direction starting from the northwest corner. Surrounding building monitoring points are designated from F01 to F16. For the roads, monitoring points are arranged clockwise from the exterior of the northwest corner and marked as D01 to D08. The west wall monitoring points are placed from the southwest to the northwest of the foundation pit, numbered W1 to W11, as illustrated in Fig. 1.
Fig. 1Layout map of foundation pit monitoring
Displacement at each point is monitored regularly. Initially, soil observations occur every two days, transitioning to daily measurements when values approach the warning threshold. If any monitoring value exceeds the warning threshold, monitoring frequency increases to twice daily, with immediate alerts for action [16].
3.2. Monitoring data analysis
1) Settlement of the road.
Monitoring points for road settlement were placed in a clockwise arrangement from the northwest corner of the site, with the north and east sides being closest to the city’s main road. These two roads were the primary focus of settlement observation, and monitoring occurred over a 10-month period, from May 2015 to March 2016, totaling 44 monitoring sessions. The monitoring data is plotted as a curve in Fig. 2.
Analysis reveals that monitoring points D01, D02, and D03 were minimally affected by excavation, with settlement amounts accounting for a small proportion. The settlement displacement curves for these three points display a similar pattern over time, characterized by an initial settlement, followed by uplift, and then another phase of settlement.
During the initial excavation phase, there was an increasing difference in stress between the interior and exterior of the retaining structure, resulting in settlement at observation points. As excavation of the foundation pit continued, stress in the soil at the pit’s bottom was continuously released, causing an upward uplift of the pit and subsequent uplift of the surrounding soil. The maximum uplift of the surrounding roads was observed on the 106th day of excavation. With the deepening of the excavation, a plastic deformation area developed at the bottom of the pit, leading to settlement of the roads surrounding the foundation pit due to this plastic deformation. Notably, points closer to the center experienced more significant displacement, while those closer to the pit's corners exhibited smaller displacement, aligning with the spatial effect theory of foundation pits. Horizontal displacement of the top of supporting structure.
Fig. 2Road settlement curve of foundation pit
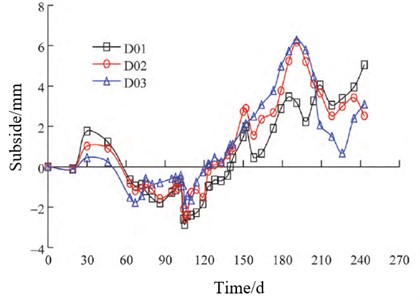
a) On the north side of road
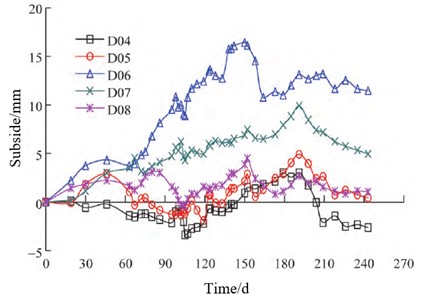
b) On the east side of road
Excessive horizontal displacement of the supporting structure poses a direct risk to the stability of the retaining structure and the potential collapse of the foundation pit. This, in turn, could lead to substantial settlement in surrounding roads and damage to underground pipelines and facilities. Therefore, the central focus of foundation pit support lies in monitoring the horizontal displacement of the side walls. The horizontal displacement monitoring for the top support spanned over 7 months with 41 measurement sessions starting from January 2015. The monitoring data is represented in the curve shown in Fig. 3.
Fig. 3Horizontal displacement curve at the top of foundation pit supporting structure
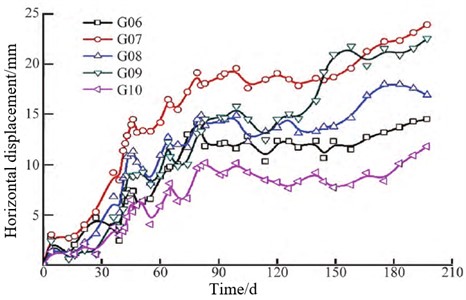
a) Observation point on the east side of foundation pit
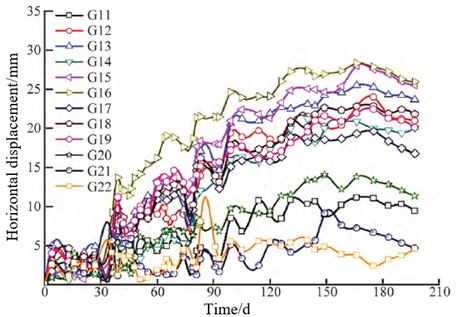
b) Observation point on the west side of foundation pit
On the west side of the foundation pit, neighboring buildings exert additional active earth pressure on the pit's ground. This results in significantly higher horizontal displacement at the top of the structure in this area compared to other sections. The maximum displacement recorded among the 22 horizontal displacement monitoring points in the foundation pit is 25.96 mm, which is below the monitoring alarm threshold of 30 mm.
4. Numerical simulation of foundation pit retaining structure
4.1. Numerical calculation model is established
FLAC3D is a powerful geotechnical modeling software known for simulating the behavior of soils and rocks in three dimensions. It employs the finite difference method to discretize and analyze stress, strain, and displacement within the modeling domain. Geotechnical engineers and researchers use FLAC3D to address a broad spectrum of challenges, including slope stability, excavation support, tunneling, and dynamic loading. The software features customizable material models, boundary conditions, and supports static, dynamic, and coupled analyses. It generates detailed output and offers visualization tools for effective result interpretation.
In this paper, FLAC3D software is utilized for numerical simulations focused on the theme of the supporting structure. The structural units employed include pile units, anchor cable units, and beam units. The structural model post-excavation is depicted in Fig. 4. FLAC3D is employed for the integration of anchor cables, beams, and piles [17].
Fig. 4Support structure model
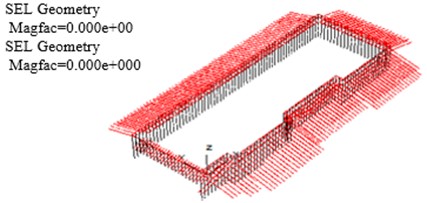
The excavation area of the site measures approximately 123m by 41m with a depth of 8 m. The calculation model extends three times the excavation depth outward from the foundation pit’s edge, covering a range of 171 m by 89 m by 24 m. The model comprises 324,646 units and 344,504 nodes. Boundary conditions for the model include bottom normal constraints, surrounding normal constraints, and top free constraints.
The numerical simulation proceeds through five steps in accordance with the excavation plan.
Step 1: In zones 1 and 2 of the foundation pit, vertical excavation was performed to reach an elevation of –2 m, simulating the crown beam using beam elements. At an elevation of –1.5 m, the simulation included prestressed anchor cable installation, tensioning, and anchoring using anchor elements. The cable length was 18 m, with a 6 m free section and a prestress force of 80 KN.
Step 2: The first, second, and third zones of the foundation pit were excavated to elevations of –4 m, –3.5 m, and –2.5 m, respectively. At an elevation of –2 m, anchor elements were used to simulate the installation, tensioning, and anchoring of prestressed anchor cables.
Step 3: In zone 1 of the foundation pit, excavation of the slope to an elevation of –5.5 m was carried out, and anchor elements were used to simulate soil nails at the elevation of –5 m. In zone 2 of the foundation pit, excavation was conducted, and anchor elements were used to simulate the installation, tensioning, and anchoring of prestressed anchor cables at the elevation of –4.5 m.
Step 4: In zone 1, excavation was carried out to an elevation of –7 m, followed by excavation to an elevation of –6.5 m, using anchor elements to simulate soil nails. In zone 2, excavation reached an elevation of –6.5 m, and at –5.5 m, anchor elements were employed to simulate the installation, tensioning, and anchoring of prestressed anchor cables.
Step 5: Vertical excavation was performed in four areas of the foundation pit, reaching an elevation of –8 m.
The Mulcullen model was utilized to determine the main mechanical parameters of soil based on both laboratory and in-situ tests. Soil weight: 18.0 kN/m-3, cohesion: 50 c/kPa, internal friction angle: 13.0°, elastic modulus: 10.0 MPa. During the simulation, the elastic modulus of each soil layer was chosen as reported and then multiplied by a factor of three, based on empirical data, to determine the elastic modulus for each layer. Furthermore, the volume modulus and shear modulus required by the FLAC3D model were obtained by converting the elastic modulus and Poisson's ratio of each soil layer using a specific formula:
where is the volume modulus, is the elastic modulus, is the Poisson’s ratio, and is the shear modulus. Within the elevation of the foundation pit ranging from 0 m to –8 m, there is one unit per 1 m in the horizontal direction and one unit per 0.5 m in the vertical direction. Other areas are diffused in a ratio of 1.1. Within the elevation of the foundation pit ranging from 0 m to –8 m, there is one unit per 1m in the horizontal direction and one unit per 0.5 m in the vertical direction. Other areas are diffused in a ratio of 1.1.
4.2. Analysis of horizontal displacement of foundation pit
The horizontal displacement of the foundation pit plays a crucial role in determining surface settlement behind the pit and its impact on surrounding safety. Therefore, it's essential to analyze and clearly identify the horizontal displacement of the foundation pit. In construction engineering, typical sections are chosen for analyzing the excavation surface during slope release and pile-anchor support. This allows for a comparison of the horizontal displacement results between these two excavation and support methods.
4.2.1. Horizontal displacement of slope excavation section
The cutting surface of slope excavation was taken as the plane with the crossing point (0, 20, 0), normal direction (0, 1, 0) and value range (–15, 15) for study. This section passed through the monitoring point G02 of canopy beam horizontal displacement, and its horizontal displacement was shown in Fig. 5. Due to the limitation of space, only the displacement cloud image in the direction after the first step of excavation, the third step of excavation and the enlarged cloud image after the fifth step of excavation are selected in Fig. 5.
Fig. 5Cloud chart of horizontal displacement of foundation pit sloping excavation
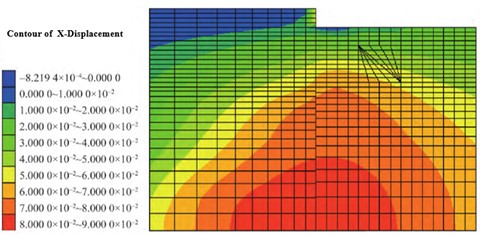
a) Displacement cloud map in horizontal () direction after excavation in the first step
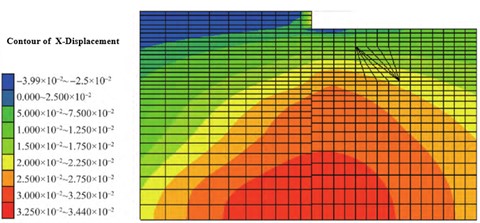
b) The third step is the horizontal () direction displacement cloud map after excavation
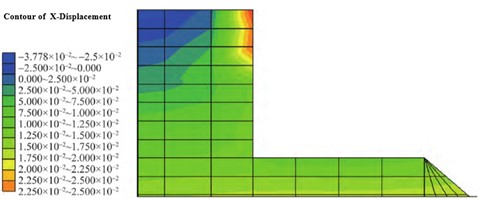
c) The fifth step is the enlarged cloud image of horizontal () direction displacement after excavation
Fig. 6Top horizontal displacement curve
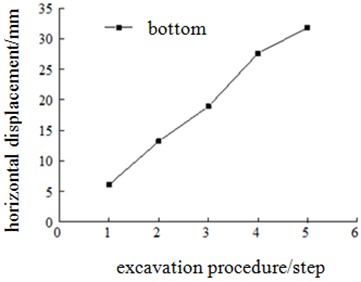
Fig. 6. is the curve of horizontal displacement of the top of vertical excavation along with excavation of it. The horizontal displacement of the top of the vertical excavation varies linearly with the excavation steps.
4.2.2. Horizontal displacement of side wall of pile-anchor support
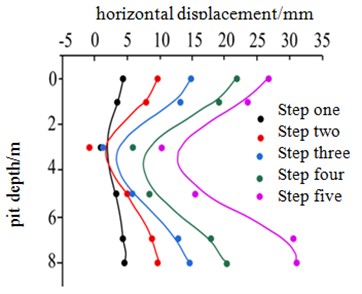
As can be seen from Fig. 7 and 8, with downward excavation, the horizontal displacement of each point moves toward the interior of the foundation pit and increases continuously, and the same working condition is no more than 20 mm. The maximum value of foundation pit wall in foundation pit slope and slope, retaining pile at the bottom of the horizontal displacement, the largest in the retaining pile depth within the scope of the difference in soil level is small, under the same conditions the horizontal displacement of the top-down increase with the decrease of the first point, this is because the pit wall in the middle of two way prestress change the soil pressure, reduces the lateral displacement of foundation pit, The stability of foundation pit is enhanced. The horizontal displacement cloud diagram of the side wall after excavation is shown in Fig. 7, and the horizontal displacement fitting curve is shown in Fig. 8.
Fig. 7Cloud diagram of horizontal displacement of pile-anchor support in foundation pit
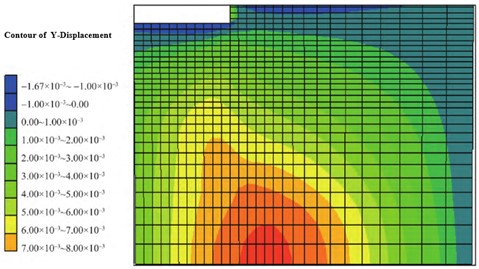
a) Horizontal () direction displacement cloud map after the first step of excavation and support
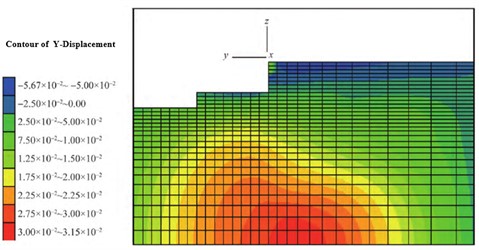
b) The third step is the horizontal () direction displacement cloud map after excavation and support
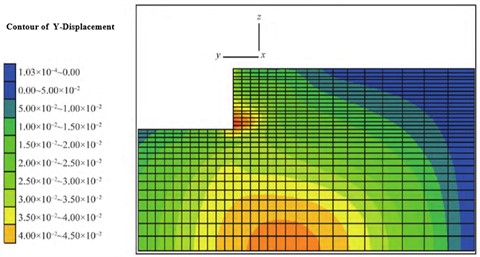
c) Displacement cloud map in horizontal () direction after the fifth step of excavation
Fig. 8Horizontal displacement curve of pile-anchor support in foundation pit
5. Analysis of difference between numerical simulation and monitoring data
The horizontal displacement at the pile top and soil settlement, as monitored during foundation pit excavation, was compared to the simulated theoretical results. Overall, there is a high degree of similarity between the two datasets. However, some local data points show variations.
5.1. Comparison of horizontal displacement of pile top
Table 3 lists in detail the comparison between simulation results and field measured values from monitoring points G11 to G21. The numerical simulation results are basically similar to the field measurement results. But G11, the G20, G21, G22 points or there exists a large gap, and in addition to the G11 point prevalent simulation value is greater than the measured values, causing reason is adopted the tub excavation of foundation pit, with a certain amount of soil around pile after pile of supporting pile soil of active earth pressure decreases, and make the measured relative simulation values.
Table 3Comparison between measured and simulated results of horizontal displacement on pile top
Monitoring stations | Measured horizontal displacement of pile top / mm | Numerical simulation of pile top horizontal displacement / mm |
G11 | 9.43 | 6.4 |
G12 | 20.95 | 23.6 |
G13 | 23.65 | 25.4 |
G14 | 20.01 | 21.4 |
G15 | 25.52 | 26 |
G16 | 25.96 | 26.3 |
G17 | 16.78 | 16.8 |
G18 | 21.83 | 19 |
G19 | 20.10 | 23.5 |
G20 | 11.39 | 23.5 |
G21 | 4.70 | 12.1 |
G22 | 4.62 | 11.8 |
5.2. Soil settlement correlation
Fig. 9 compares the measured and numerical curves of surface soil settlement after the pit. The curves of both simulation results and measured results show a “scoop” distribution in morphology, and the overall law is basically similar.
Fig. 9Contrast map of soil settlement curve
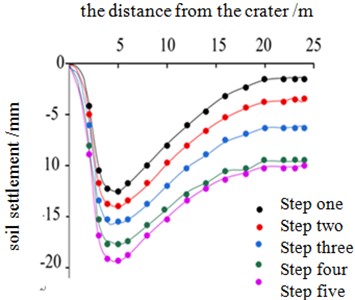
a) Numerical simulation of soil settlement curve after the pit
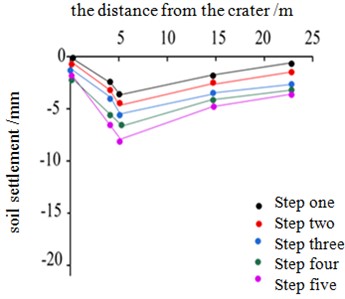
b) The soil settlement curve after the pit was measured on site
5.3. Analysis of difference between numerical simulation and measured data
Although using FLAC3D software can provide good simulation results. However, the results of numerical simulation inevitably deviate from the measured data.
5.3.1. Numerical model
In the calculation of foundation pit and supporting structure using FLAC3D, establishing a scientifically accurate model is of paramount importance. The key factor influencing model accuracy is the selection of soil mechanical parameters specific to the engineering site. The chosen parameter values have the most significant impact on the calculation results. This selection process should involve a detailed examination of the foundation survey report and should also draw from a wealth of literature and practical experience from similar projects in the same area.
The values for parameters such as rebound modulus and compression modulus are typically determined based on empirical experience, often ranging from 3 to 5 times their initial values. In practical geotechnical engineering, the complexity and diversity of soil conditions make it challenging to derive precise reference values from other projects. As a result, iterative parameter adjustments are almost always necessary during numerical calculations to achieve satisfactory results.
5.3.2. There is a gap between simulated working conditions and actual working conditions
This paper employs FLAC3D software to simulate the entire excavation and support process of foundation pits, adhering to the construction organization design for earthwork excavation. The actual construction steps and processes are reflected in 5 steps and 4 zones. However, this regional and step arrangement may not perfectly align with the complexities of the construction site. In practical excavation and support methods, the strength of supporting piles can influence soil deformation, and this is a continuous and gradual process. The evolution of this process is often intricate, and numerical simulation may struggle to fully capture it, leading to some deviation between numerical calculation results and measured data.
5.3.3. Time effect of soil deformation
Time-dependent soil deformation, commonly referred to as creep, holds significant importance in the field of geotechnical engineering. Soils gradually deform over time when subjected to constant stress or load, impacting structures and foundations. Creep phenomena are associated with consolidation, viscoplasticity, and elastic aftereffects, which can lead to long-term settlement or instability. Engineers analyze this time-dependent behavior through a combination of laboratory tests and mathematical models to ensure the safety and sustainability of structures such as tall buildings, dams, and bridges. A comprehensive understanding of the influence of time on soil deformation is essential for mitigating potential hazards and ensuring the long-term performance of civil engineering projects.
In numerical simulation, soil is typically assumed to exhibit instantaneous unloading responses, where soil deformation is considered to occur instantaneously. This approach does not account for the creep characteristics of soil. In practical engineering, after excavation, the soil within a foundation pit often maintains a relatively stable state for a period of time, meaning that immediate deformation does not occur. In essence, the numerical simulations performed using the FLAC3D program do not incorporate the time-dependent aspects of soil deformation. This omission can result in calculated results that are larger than those observed in measurements.
5.3.4. The model elements do not satisfy the harmony and continuity of deformation
In solving problems related to continuous media like soil, FLAC3D program employs relatively large analysis units. As a result, forces generated in each unit become concentrated within the network and may not adequately address the requirements for deformation coordination and continuity. In a sense, this approach neglects the inter-particle shear forces and mutual restraints within the soil. Consequently, the foundation pit deformations obtained through the FLAC program may appear larger than the actual measured values.
Numerical calculations of foundation pits using FLAC3D have become crucial reference tools in foundation pit design. They accurately depict the evolving patterns of pressure and deformation throughout the construction process, demonstrating their scientific value and applicability in engineering practice. However, due to the complexity, diversity, and variability of rock and soil compositions, some deviation between theoretical results and actual data is expected. In general, it is preferable for theoretical data to slightly exceed measured values, as this provides an added margin of safety.
6. Conclusions
This paper is based on the deep foundation pit of the Bright Pearl Shopping Mall in Bengbu city, Anhui Province. It analyzes the monitoring data of the foundation pit and conducts numerical calculations using FLAC3D. The following conclusions can be drawn:
1) The numerical simulation results closely resemble the field measurement results, with a difference of only 8.67 %, which is less than 10 %. Using FLAC3D software for simulation, the theoretical results align well with actual data, accurately portraying the evolution of soil pressure and deformation during foundation pit excavation.
2) The maximum horizontal displacement of the monitoring point in this project's foundation pit is 25.96 mm, which is below the monitoring alarm threshold of 30 mm.
3) The excavation of foundation pits can affect the settlement of buildings, roads, and the horizontal displacement of slope tops. The most crucial aspect is monitoring the horizontal displacement of the foundation pit’s side walls and implementing the necessary measures to reinforce the slope top.
References
-
G. Jiang, Foundation Pit. Wuhan, China: China University of Geosciences Press, 2010.
-
Z. Hu, Soil Mechanics and Environmental Geoengineering. Shanghai, China: Tongji University Press, 2007.
-
T. Cao, Study on composite soil nailing and its mechanism in a deep foundation pit of Beijing Metro line 10. Beijing: China University of Geosciences, 2008.
-
Y. Yang, Study on Support System and Excavation Scheme for Deep Foundation Pit of Metro Tunnel. Beijing: Beijing Jiaotong University, 2010.
-
Q. Qian, “Meet the climax of urban underground space development in China,” Geotechnical Engineering, No. 3, pp. 112–113, 1998.
-
J. Sun, “Summary of the development of foundation pit engineering in China,” Journal of Heilongjiang Water Institute, Vol. 37, No. 1, pp. 50–53, 2010, https://doi.org/10.13524/j.2095-008x.2010.01.029
-
Z. Xu, Experience of Design and Construction of Deep Foundation and Slope Support Engineering. Shanghai, China: Tongji University Press, 2011.
-
M. S. Ismail, O. Ifayefunmi, and S. H. S. M. Fadzullah, “Buckling of imperfect cylinder-cone-cylinder transition under axial compression,” Thin-Walled Structures, Vol. 144, p. 106250, Nov. 2019, https://doi.org/10.1016/j.tws.2019.106250
-
G. Shen, H. Zhao, and K. Zhao, “Hermite difference method for Longitudinal displacement of tunnel due to excavation of deep foundation pit,” Journal of Underground Space and Engineering, Vol. 16, pp. 841–848, 2020.
-
J. Xi et al., “Influence of deep foundation pit excavation in soft soil on surrounding environment in complex environment,” Journal of Henan University of Science and Technology (Natural Science Edition), Vol. 42, No. 1, pp. 68–75, 2021, https://doi.org/10.15926/j.cnki.issn1672-6871.2021.01.011
-
M. S. Ismail, J. Mahmud, and A. Jailani, “Buckling of an imperfect spherical shell subjected to external pressure,” Ocean Engineering, Vol. 275, p. 114118, May 2023, https://doi.org/10.1016/j.oceaneng.2023.114118
-
L. Li, X. Hou, and Y. Li, “A finite element method for calculating the influence radius of foundation pit dewatering,” Geomechanics, No. 2, pp. 1–7, 2021, https://doi.org/10.16285/j.rsm.2020.0742
-
S. Ye and D. Li, “Monitoring and numerical simulation analysis of deep and large foundation pit excavation in complex environment,” Journal of Civil Engineering, Vol. 52, pp. 117–126, 2019, https://doi.org/10.15951/j.tmgcxb.2019.s2.017
-
B. Zhang, W. Lu, and W. Li, “Influence of foundation pit excavation on near by subway tunnels,” Science Technology and Engineering, Vol. 20, No. 35, pp. 14673–14680, 2020.
-
H. Xu et al., “Optimization analysis of the influence of deep foundation pit excavation on adjacent large-diam-eter pipeline,” Science Technology and Engineering, Vol. 21, No. 2, pp. 714–719, 2021.
-
O. Ifayefunmi and M. S. Ismail, “An overview of buckling and imperfection of cone-cylinder transition under various loading condition,” Latin American Journal of Solids and Structures, Vol. 17, No. 8, p. e329, 2020, https://doi.org/10.1590/1679-78256197
-
M. S. Ismail and J. Mahmud, “Comparative evaluation of design codes for buckling assessment of a steel spherical shell,” Latin American Journal of Solids and Structures, Vol. 20, No. 5, p. e494, 2023, https://doi.org/10.1590/1679-78257473
Cited by
About this article

The authors have not disclosed any funding.
The datasets generated during and/or analyzed during the current study are available from the corresponding author on reasonable request.
Xupeng Yin: write the paper; data. Hongmei Ni: write and review the paper
The authors declare that they have no conflict of interest.
