Abstract
Low strain dynamic testing is an important nondestructive testing method in the engineering. However, the pile foundation material is usually assumed as having a uniform elastic modulus in low strain simulations. In this paper, we consider the elastic modulus of concrete as having an inhomogeneous elastic modulus that is described by the Weibull distribution model. An explicit algorithm was adopted in order to solve the model. The finite element method (FEM) was used to simulate the low strain dynamic test of a 3D pile. The response velocity characteristics of different shape parameters were obtained using this method, and the Daubechies wavelet transform was used to analyze the characteristics of the wavelet modulus. The result shows that simulation response velocity has a correlation with the different homogeneity of the elastic modulus.
1. Introduction
Nondestructive testing has become the most important detection method in the project, as it can avoid structural damage. The low strain test method that is portable and has a high detection rate and low cost has been widely used in nondestructive pile testing. With the development of computer technology, numerical methods have been applied to dynamic simulations of pile foundation engineering responses. The finite difference method (FDM) was first used in the numerical simulation of pile dynamic responses. Due to the lack of ability to adapt to the boundary, the FEM has become the numerical simulation method today [1, 2]. As a result of increasing complexity and difficulty, the simulation developed from being one-dimensional to three-dimensional. The soil, the internal pile necking, widening, mud, and other complex factors are considered in the analysis of influences on dynamic responses [3]. For a response to vibration signal analysis, Fourier transform and windowed Fourier transform were used in the past. Then scholars proposed multi-scale analysis of wavelet transform on the basis of Fourier transform [4-6]. Recently, Professor Huang E. proposed the Hilbert-Huang transform, which has self-adaptive characteristics. The methods have been applied in the signal analysis of piles and been used to obtain effective solutions [7, 8].
Piles of concrete are one structural material. Their compositions are complex and diverse. There are usually cracks, damage, and other defects in piles, such unevenness and internal structural defects [9]. For materials such as rock and concrete, their physical properties conform to Weibull distribution based on many statistics. Weibull distribution is successfully used to describe inhomogeneous material, such as rock and concretes [10, 11]. In the pile simulation process, we usually regarded a concrete pile as consisting of homogeneous material, and the effects of random physical property variations in concrete have not been considered. We can achieve analytical solutions of dynamic responses in some cases with homogeneous medium pile soil models, but most models, such as those that consider random elastic modulus distribution, only achieve numerical solutions. Thus, it is necessary to establish the simulation method of low strain testing in the meso-scale, as it can be used to obtain objectively low strain testing responses to pile with complex internal defects. The purpose of the paper studied concrete homogeneity affects the collective signal. Considering the random variation properties of concrete elastic modulus in space is important for the objective simulation of piles for low strain testing, and the guidance of dynamic response signal analysis to accurately determine the quality of a pile is also important.
2. Theory and methodology
2.1. Weibull distribution theory
In Weibull distribution takes the ‘weakest link’ as the basic assumption. Weibull proposes that the structure consists of a number of area or volume unit link, only when all these elements are survival structure will not fail. We know the probability of the statistics describes the inhomogeneity of the material. Weibull distribution rate is set by the threshold of exponential extremes in order to describe material properties. Weibull distribution is widely used in describing the characteristics of inhomogeneous materials [12].
Here is the Weibull density function. It is expressed as follows:
where are random variables (such as elastic modulus, strength, etc.), is the shape parameter, and is the scale parameter, which is relevant to random average.
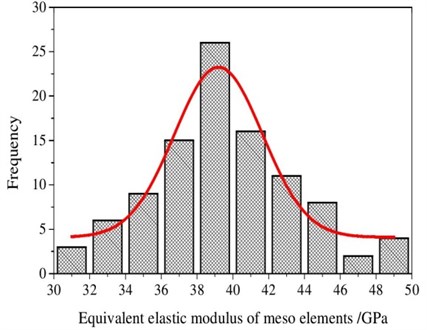
One 150×150 mm two-graded concrete specimen was used as a study in meso-scale level. Mesoscopic element elastic modulus probabilistic statistics was analyzed for random aggregate model. After the concrete model was meshed, mortar and aggregate statistical occupied volume fraction could be calculated, and then equivalent elastic modulus of each unit could be obtained. In the example, the elastic modulus of mortar and aggregate was 50 GPa and 30 GPa respectively, element size was 15×15 cm, and concrete specimens were divided into 100 elements. Equivalent elastic modulus was carried out with mathematical statistical analysis. Elastic modulus of 100 elements was in descending order, and the histogram was shown in Fig. 1 [13]. The frequency histogram of the two-graded concrete elastic modulus conformed to Weibull distribution.
Fig. 1The frequency histogram of the two-graded concrete elastic modulus
2.2. Simulation of low strain dynamic testing
In the low strain detection process, when a hammer excited punching loads at the top of the pile I order to generate stress waves, then stress waves propagate along the pile under pressure. Low strain pile detection is actually a dynamic problem. Equations of motion can use the center of the interpolation method for an explicit time integration solution. The incremental step result is used to obtain the result of the next incremental step.
Based on dynamic equilibrium conditions, when the node force is equal to the product of mass and acceleration, it can be expressed as follows:
where is node mass, is displacement, is an external force, represents damping coefficient, and is internal force.
The initial step time acceleration is expressed by the following equation:
In explicit time integration solution, the most important thing is to set time increment which determines the precision and convergence of the solution. If the time increment is assumed to remain unchanged, the midpoint of this time increment speed can be obtained as follows:
where is time increment with one stability limit, while is determined by the equation as follows:
where is element length, while is the velocity of the elastic wave in the pile:
where is the pile elastic modulus, while is the pile material density.
Eq. (4) provides pile’s top speed in the time domain after the dynamic response. By analyzing the stress wave in the pile bottom, interface changes reflected by the waveform can be drawn. The depth changes in the pile length or pile impedance surface is calculated as follows:
where is the pile length or the distance from the impedance changes surface to the pile top and is the time difference between the incident and the reflected waves.
Simulation analysis of pile dynamic testing can be divided into three main steps: firstly, according to the pile design sketch, draw a three-dimensional, geometric model of the pile foundation and soil; secondly, use the Weibull distribution model to describe the random distribution of pile material parameters, the inhomogeneous elastic modulus distribution field needs be established, and parameters for geotechnical materials need to be set; finally, an explicit algorithm is used to solve the pile model, and the speed response is analyzed at top of the pile. The specific detailed process is shown in Fig. 2.
3. Numerical simulation and response analysis
3.1. Pile geometry model
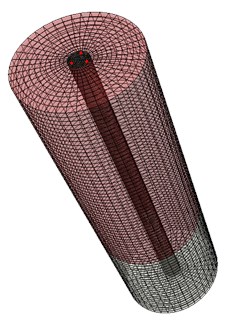
In one pile foundation engineering construction, the pile length is 12 m, and its diameter is 0.5 m. The pile side is in the clay layer, and the bottom of the pile is on strong, weathered bedrock. In the numerical simulation, the bedrock size in the diameter is takes six times the pile diameter, and the bottom bedrock is 0.5 times the pile length (Fig. 3). Pile and soil parameters are shown in Table 1.
Fig. 2Low strain dynamic testing simulation process with the pile foundation
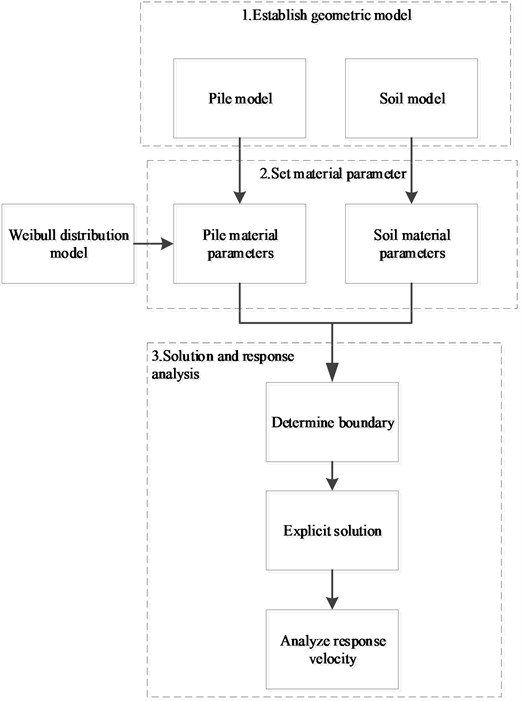
Table 1Parameters used in the pile soil system
Part | Length (m) | Radius (m) | Density (kg/m3) | Elastic modulus (Pa) | Poisson ratio |
Pile: concrete | 12 | 0.5 | 2400 | 3.0×10¹⁰ | 0.17 |
Side: soil | 12 | 3 | 1950 | 2.2×10⁷ | 0.35 |
Bottom: rock | 6 | 3 | 2500 | 2.0×10⁹ | 0.28 |
In the low strain test, the excitation is generated by a hand hammer. The impact load is approximately the same as the sine function:
where is the hammering peak (5000 kN/m2), and is load sustaining time (0.001 s). The speed measurement point is placed on top of the pile, and the distance from the measurement point to the pile center is 0.33 m. The angle between each connection line, which is from the measurement point to the pile center, is 120°. Fig. 3 shows the position of the red points.
Fig. 3Three dimension model of pile and soil in the simulation
3.2. Dynamic numerical simulation
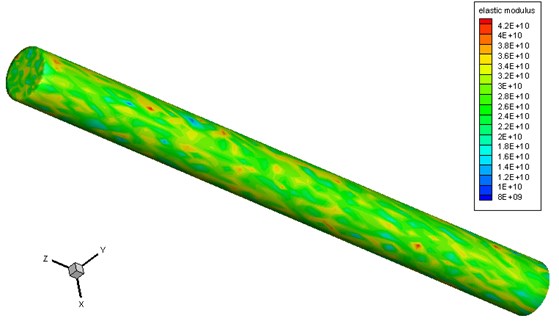
For the low strain test simulation of an inhomogeneous elastic modulus pile, the geometric model of the pile and soil is based the specifications in section 3.1. Concrete material parameters were subject to random variables and shape parameters of Weibull. According to the number of element nodes, a set of nodes were distributed in a series of meeting. Weibull distribution could be obtained by MATLAB library functions “wblrnd”, and then the set of sequences were assigned randomly to each node as the elastic modulus did. Using Weibull distribution, elastic modulus random field of the pile material was simulated. Fig. 4 ( 6.0) shows the distribution of elastic modulus in the pile.
Fig. 4Elastic modulus distribution contour of pile foundation (unit: Pa)
After setting the pile and rock material properties, an explicit time integration algorithm was adopted in order to obtain the velocity field of the inhomogeneous elastic modulus pile. The different time pile velocity fields when 6.0 are shown in Fig. 5. The impact load was on top of the pile at the beginning in order to produce a stress wave. The stress wave began to spread all around (Fig. 5 (a)). Then is propagated gradually downward (Fig. 5(b)). When the stress wave reached the interface of the pile and rock, reflection and transmission phenomena occurred (Fig. 5(c)). However, when the wave reached the pile bottom, Fig. 5(d) clearly shows that the interface echoed upward. Based on Fig. 5, all of the speed fields were not strictly symmetrical because the pile is composed of inhomogeneous elastic modulus. The simulation results clearly show the stress wave propagation characteristics in the pile body.
Fig. 5Velocity field distribution of pile at different time t (unit: s)
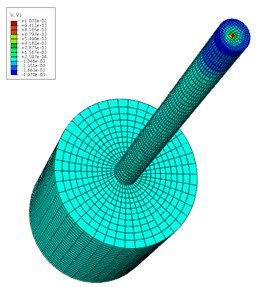
a) 7.25×10⁻⁴
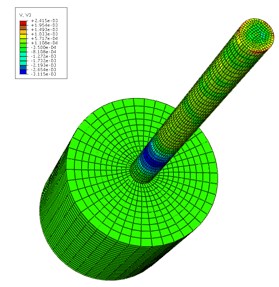
b) 1.725×10⁻³
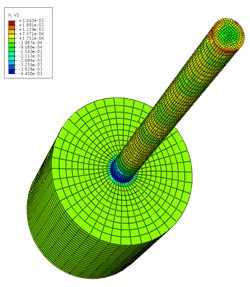
c) 4.425×10⁻³
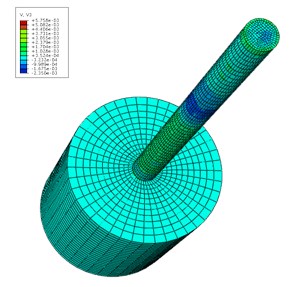
d) 6.875×10⁻³
3.3. Response signal analysis
Geometric parameterdescribes the inhomogeneous degree of the pile material properties. In the circumstance of the same scale parameter of , take the values of to be 1.0, 2.0, and 6.0 in order to analyze the velocity of the response. In the simulation, it is considered that there are three measurement points whose node numbers are 15010, 16210 and 16930 in computational model (red points in Fig. 3). Point 1 is node 15010, point 2 is node 16210 and point 3 is node 16930. By finite element simulation of the pile at different stages of the velocity field value, Fig. 6 shows the results at measurement point 1 (when is 1.0). The figure shows the velocity waveform state.
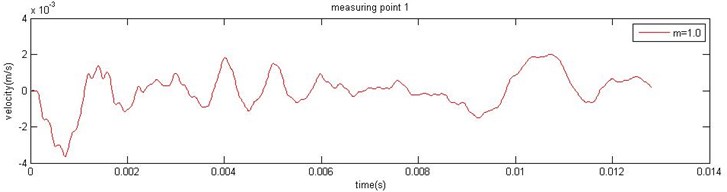
Fig. 6. The velocity history of the measuring point 1 of the pile top
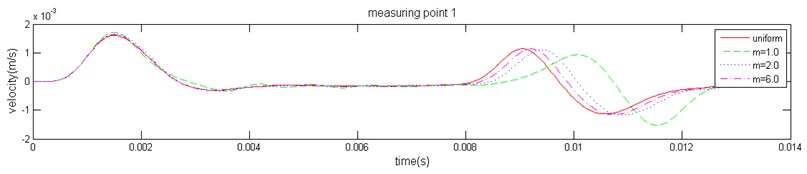
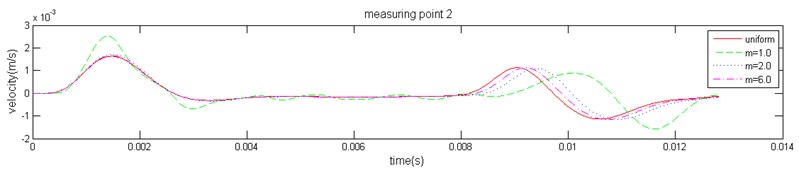
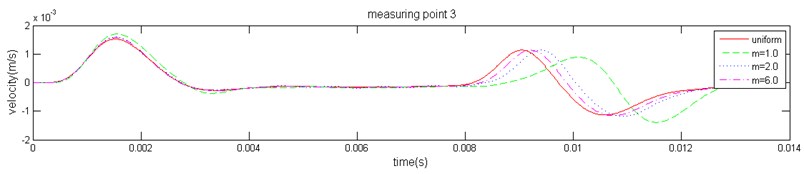
The response velocity at three measuring points (marked in Fig. 3) can be obtained. Because high-frequency interference waves exist in the three-dimensional stress wave propagation, it is difficult to identify the characteristic reflection. In order to eliminate the influence of high-frequency interference components, a Butterworth low-pass filter was used to eliminate interference factors. The filtered velocity waveform is shown in Fig. 7. Based on the analysis results, the vibration waveform at each measuring point follows a consistent law for the same value of ; the pile bottom reflection peak time and amplitude are equal. At same measuring point, the reflecting time decreases gradually with the increase of and ultimately trends toward a homogeneous medium, which is consistent with the homogeneous medium result. When is small, a medium degree of heterogeneity increases and causes the macroscopic speed to decrease; it then leads to an increase in the stress wave reflection time. The results are consistent with the actual situation.
Fig. 7The velocity history of the measuring point of the pile top
a)
b)
c)
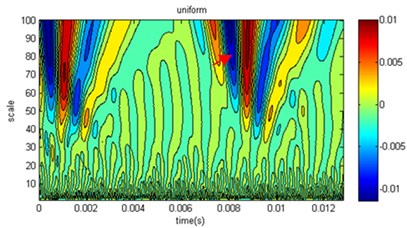
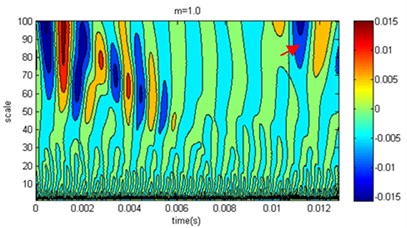
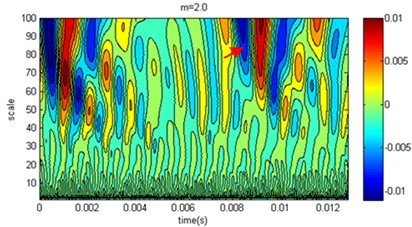
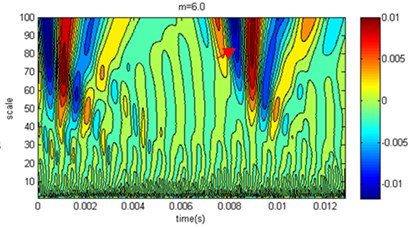
As a common tool for multiscale analysis, wavelet transform can be used to analyze simulation results at different degrees of homogeneity of pile elastic modulus in verifying the simulation method reliability. The speed response time of the measuring point at the top of the pile can be calculated by the numerical simulation. With wavelet transformation, the wavelet coefficients can be obtained at different scales. Because the measuring points have similar characteristics, only one measuring point was used for the study. In the analysis process, we selected limited compactly supported wavelets, Daubechies, and the wavelet coefficients were calculated at the measuring point 1, as shown in Fig. 8.
In the contour map of the wavelet coefficients in Fig. 8, there are more high-frequency interference components below scale ten areas, while there are significantly extreme areas from reflection wave in the large-scale presence of 50 or more. For the relations of wavelet coefficients and , when 2 its value is small. There are many extreme areas in the mesoscale, and the coefficients from reflection wave are relatively small, but the value of the extreme areas corresponding to time great. Generally, as increases, the wavelet coefficient differences decrease compared to those of the homogenous pile. When 6, the difference is very small with homogenous, which coincides with the speed amplitude in Fig. 7. When , it is shown that wavelet coefficients form several complicated extremal regions at different scales due to the elastic modulus under microscopic inhomogeneity. There is a significant difference between homogeneity cases. When the degree of inhomogeneity is higher, the wavelet coefficients distribution is more different between homogeneity cases. Thus, it is concluded that wavelet transform result is strongly correlated with homogeneity degree of elastic modulus.
Fig. 8Wavelet coefficient distribution at measuring point 1 of the pile top
a)
b)
c)
d)
In the pile low strain testing, the most important function of the wavelet transform is to recognize the features of the reflected signal, and the features of the reflected signal can have been shown at different scales to determine the quality of pile. The arrow in Fig. 8 marked the region which was low pile area of the reflected signal. On time axis, when the shape parameters increased, the pile bottom reflection time would decrease with the same regularity in Fig. 7; however, on the scale coordinate, the range of scales became narrow with the increase of shape parameters, and the intensity of the reflected signal were also reduced. The reason was that the pile elastic modulus caused the pile bottom interfacial resistance increasing as the shape parameter increased, and the intensity of the reflected signal increased. Generally, high frequency reflection signal attenuate rapidly in propagation, when the upper and lower interfacial resistances have small difference, so the reflected signal can only occur in a narrow range of scales. Based on the analysis results of wavelet, the simulation results of the proposed method are consistent with the actual situation.
4. Conclusions
Due to the complexity of concrete pile, material damage and cracks may occur. The internal defects are randomly distributed in the pile. So, piles are not homogeneous elastic modulus material in reality, and their elastic modulus is inhomogeneous. One simulation mode is proposed to simulate low strain dynamic testing in view of the inhomogeneity of pile elastic modulus in the meso-scale level. This paper describes the distribution of inhomogeneous elastic modulus using the Weibull distribution model, and a simulation model for low strain testing was established. The explicit FEM was adopted to simulate the responses in a pile’s velocity field. The model successfully obtained the responses in a pile’s velocity in the low strain dynamic testing of pile. The conclusions can be summarized as follows:
1) Weibull distribution is introduced for the description of the pile elastic modulus property, with the focus on the inhomogeneous property of pile elastic modulus in the meso-scale. The random field of the elastic modulus is clearly expressed by the model.
2) In order to objectively simulate the low strain testing response of inhomogeneous elastic modulus pile, low strain test simulation method is established based on Weibull distribution model and explicit FEM. The top of the pile responding speed is effectively simulated.
3) The response speed of the pile models can be obtained with different degrees homogeneity of elastic modulus, using the proposed simulation method. It is shown in the results of the signal filtering and wavelet transform that elastic modulus uniformity has a significant effect on response speed and spectrum changes. Objective simulation results of low strain testing signal are obtained.
Because only the speed of response was simulated in the paper, physical acceleration may be detected in the actual project. Therefore, the proposed method can be used to simulate other physical quantities according to project needs in the future.
References
-
Jiang Jing, Liu, Dong Jia, Lu Zhi Tang, Tao, etc. A study on low strain integrity testing of platform-pile system using staggered grid finite difference method. Soil Dynamics and Earthquake Engineering, 2014, p. 345-352.
-
Cao Maosen, Liu, Jingqiang, Ren Qingwen Detection of small damages in foundation piles using optimal base wavelet. Journal of Vibration and Shock, Vol. 25, Issue 3, 2006, p. 155-58.
-
Ding Xuanming, Liu Hanlong, Kong, Gangqiang, Zheng Changjie Time-domain analysis of velocity waves in a pipe pile due to a transient point load. Computers and Geotechnics, Vol. 58, 2014, p. 101-116.
-
Ni Sheng Huoo, Lo Kuo Feng, Lehmann, Ect Time-frequency analyses of pile-integrity testing using wavelet transform. Computers and Geotechnics, Vol. 35, Issue 4, 2008, p. 600-607.
-
Ni Sheng Huoo, Isenhower William M., Huang Yang Hong Continuous Wavelet Transform Technique for Low-Strain Integrity Testing of Deep Drilled Shafts. Journal of GeoEngineering, Vol. 7, Issue 3, 2012, p. 97-105.
-
Zhang Jing Yi, Chen Long Zhu Sonic echo test for pile integrity testing based on wavelet transform. Journal of Vibration and Shock, Vol. 33, Issue 6, 2014, p. 179-183.
-
Xin Quan Wang, Shi Min Zhang, Liao, et al. Research progress and overview of pile foundation model test. Applied Mechanics and Materials, 2014, p. 85-89.
-
Huang Norden E., Wu Zhaohua A review on Hilbert-Huang transform: method and its applications to geophysical studies. Reviews of Geophysics, Vol. 46, Issue 2, 2008, https://doi.org/10.1029/2007RG000228.
-
Neville, A. M. Properties of Concrete. 4 Th Edition, D Bergy, Vol. 31, Issue 3, 1998, p. 502.
-
Liu Shuang, Ren Qingwen, Chen Junpeng Numerical prediction of unloading in underground caverns excavation based on damage mechanics. European Journal of Environmental and Civil Engineering, Vol. 17, Issue 9, 2013, p. 886-98.
-
Tang Xin Wei, Zhang Chu Han, Shi Jian Jun, et al. A multiphase mesostructure mechanics approach to the study of the fracture-damage behavior of concrete. Science in China, Vol. 51, Issue 2, 2008, p. 8-24.
-
Zhang Z. M., Zhao J. K., Zhi Qiang, et al. Mesomechanical simulation of concrete tension fracture. Journal of Hehai University, Vol. 33, Issue 3, 2005, p. 287-290.
-
Xiu Li D.-U., Liu J. Research on the heterogeneous statistical properties of elastic modulus of a concrete meso-scale unit. Engineering Mechanics, Vol. 29, Issue 10, 2012, p. 106-115.
Cited by
About this article

This research was funded by the Open Research Fund of State Key Laboratory of Simulation and Regulation of Water Cycle in River Basin (Grant No. IWHR-SKL-201518) and the National Natural Science Foundation of China (Grant No. 51209182). Many constructive comments from the anonymous referees and the editors are greatly appreciated.
