Abstract
To reveal the seismic dynamic response of the pile-supported tunnel group in the soil-rock mixture deep backfill region, a three-dimensional finite element model was established based on the engineering conditions of the subway section and three tunnels with close access lines. Subsequently, the seismic dynamic response of the tunnel lining structure was studied. The results show that: Under the action of seismic, the soil-rock mixture stratum presents nonlinear characteristics with shear failure and plastic deformation. In addition, the acceleration and earth pressure of the soil-rock mixture stratum is in a “saturated” state; The seismic dynamic response of the three tunnels influences each other. The bending moments in the and directions of the tunnel lining cross-section are distributed in “X” and inverted “V” shapes, respectively. Meanwhile, the tensile stress and shear stress are distributed in an “X” shape; Under the action of seismic, the main failure form of tunnel lining is tension shear failure, and the most vulnerable position is the left and right arch foot, followed by the left and right arch shoulder; The bending moment of the pile body changes nonlinearly in the height direction. The most significant bending moment value appears at the top 1/5 of the pile length and the junction of different strata. Furthermore, the most significant horizontal displacement of the lining structure occurs at the tunnel vault.
Highlights
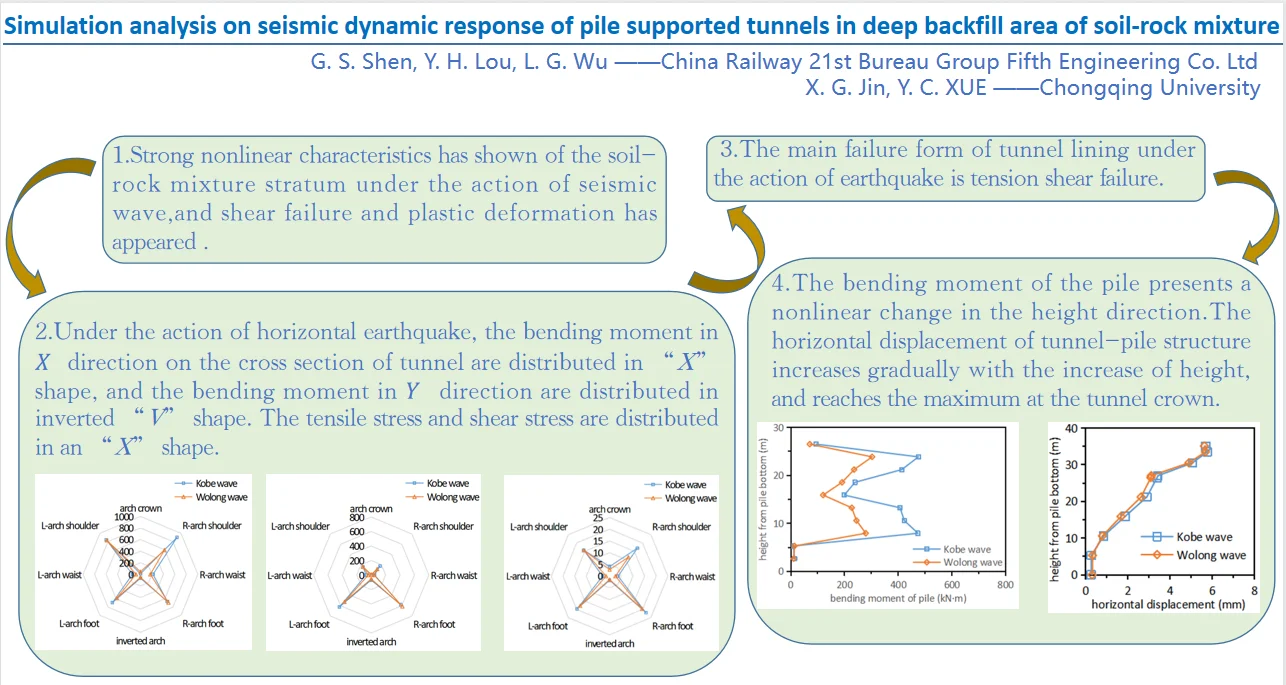
- Strong nonlinear characteristics has shown of the soil-rock mixture stratum under the action of seismic wave, and shear failure and plastic deformation has appeared.
- Under the action of horizontal earthquake, the bending moment in 𝑋 direction on the cross section of tunnel are distributed in “X” shape, and the bending moment in Y direction are distributed in inverted “V” shape. The tensile stress and shear stress are distributed in an “X” shape.
- The main failure form of tunnel lining under the action of earthquake is tension shear failure.
- The bending moment of the pile presents a nonlinear change in the height direction. The horizontal displacement of tunnel-pile structure increases gradually with the increase of height, and reaches the maximum at the tunnel crown.
1. Introduction
In the process of infrastructure construction, due to the leveling of the site, much soil-rock mixture backfill area have been formed in mountainous cities. With the rapid development of urban rail transit construction, some sections of some lines have to pass through the deep backfill area of soil-rock mixture, especially the concealed tunnel passing through the deep backfill area of soil-rock mixture, which has great construction risk and environmental risk.
The research contents and achievements of tunnel seismic dynamic response at home and abroad mainly include four aspects: The first is the seismic dynamic response of tunnel under various adverse geological conditions such as liquefiable foundation, ground crack, soft soil and fault fracture zone [1]-[2]; The second is the seismic dynamic response of complex structural systems such as cross tunnel, small spacing distance tunnel and coupling between tunnel and aboveground structure [3]; The third is the seismic dynamic response of the tunnel under complex loads such as coupling loading of seismic wave and driving load [4]-[5]; The fourth is the reliability of the results is studied by comparing and analyzing with the shaking table test data [6]. At present, research institutions have carried out some research on the characteristics of backfill and tunnel stability in the soil stone mixture backfill area. But there is still a lack of research on the seismic dynamic response of small spacing distance tunnels (groups) crossing the soil-rock mixture backfill area, and there is no report on the seismic dynamic response of pile supported small spacing distance tunnels.
Based on the subway section tunnel (including access line) project, this paper establishes the three-dimensional finite element model of pile supported tunnel group in the deep backfill area of soil-rock mixture. In addition, this paper studies the seismic dynamic response of tunnel lining structure, and determines the unfavorable parts of tunnel (Group) - pile structure. These research results can provide reference for the design, construction, operation and maintenance of similar projects.
2. Establishment of numerical model
2.1. Model size and material parameters
According to the size and mechanical parameters of support project, the section length of the model is 100 m, the maximum height is 71 m, and the longitudinal length along the tunnel is 50 m. The thickness of backfill and sandstone varies slightly. The thickness of sandstone is 27 m-23 m. The thickness of backfill is 48 m-38 m. The height of grouting ring is 14.65 m. The thickness of the tunnel lining is 0.6 m (only the outer contour of the tunnel is shown in the figure), the diameter of the pile is 0.8 m, and the length of the pile inserted into the bedrock is 2.5 m. The specific dimensions are shown in Fig. 1.
Fig. 1Model size (unit: m)
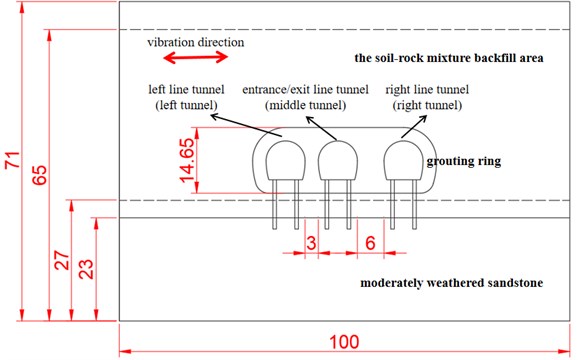
Fig. 2Three-dimensional finite element model
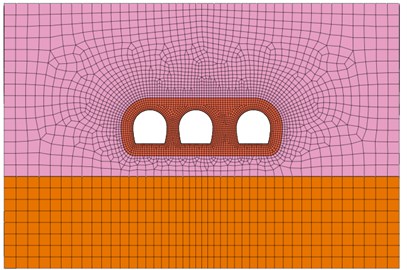
a) Front and side views of the model
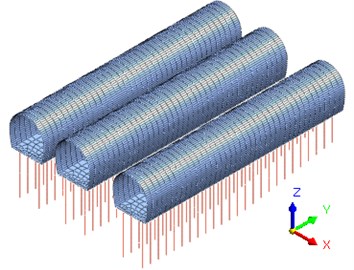
b) Lining-pile structure
The tunnel model established according to Fig. 1 is shown in Fig. 2. The direction is the horizontal direction perpendicular to the tunnel axis, the direction is the tunnel axis direction, and the direction is the vertical direction. The direction of seismic wave application is direction.
The material physical and mechanical parameters of the model are the same as those of the supporting engineering design. As shown in Table 1.
Table 1Mechanical parameters of practical engineering materials
Name | (kN/m³) | (kPa) | (°) | ||
Soil-rock mixture | 18 | 46.8 | 36.1 | 64 | 0.3 |
Grout | 20 | 600 | 35.8 | 280 | 0.28 |
Sandstone | 24 | 4000 | 41 | 5000 | 0.25 |
Lining | 25 | 32500 | 0.2 | ||
Pile | 25 | 32500 | 0.2 |
2.2. Boundary conditions and calculation methods
In the model, the seismic wave is input from the bedrock at the bottom. The free field element is an infinite site. This means that the seismic wave will not be reflected when it propagates around, so that the model avoids the influence of reflected wave. After the model is built, the eigenvalue analysis is carried out first, and the results are shown in Table 2. The periods of the two modes with the largest mass participation coefficient (the periods of the first and second modes) in T1 direction ( direction) are taken as the natural vibration periods of the model and used for nonlinear time history analysis. It can be seen from Table 2 that the effective mass ratio in the horizontal direction of the third and ninth vibration modes is the highest, which is 15.08 % and 14.79 % respectively. Therefore, the natural vibration period of the model takes the natural vibration frequency of these two modes, and the corresponding natural vibration periods are 1.851 s and 1.540 s respectively. The damping ratio of soil is considered as a constant of 0.05.
Kobe wave collected in Kobe earthquake and Wolong wave collected in Wenchuan earthquake are selected for this simulation [7].
Table 2Eigenvalue analysis result
Vibration mode | Characteristic value | Natural vibration period (s) | Effective quality (kg) | Effective mass ratio |
1 | 9.561023e+000 | 2.032019e+000 | 2.034720e-001 | 0.00 % |
2 | 9.561732e+000 | 2.031943e+000 | 2.016868e-001 | 0.00 % |
3 | 1.152710e+001 | 1.850631e+000 | 6.583850e+013 | 15.08 % |
4 | 1.534204e+001 | 1.604125e+000 | 7.881320e+008 | 0.00 % |
5 | 1.597431e+001 | 1.572059e+000 | 3.148831e+007 | 0.00 % |
6 | 1.606576e+001 | 1.567578e+000 | 5.813448e+013 | 13.32 % |
7 | 1.642037e+001 | 1.550559e+000 | 1.135600e+011 | 0.03 % |
8 | 1.665561e+001 | 1.539571e+000 | 7.351908e+012 | 1.68 % |
9 | 1.665615e+001 | 1.539546e+000 | 6.454354e+013 | 14.79 % |
10 | 1.754350e+001 | 1.500105e+000 | 1.488736e-001 | 0.00 % |
Total mode mass | 1.959828e+014 | 44.90 % | ||
Total model mass | 4.365221e+014 |
3. Analysis of simulation results
3.1. Acceleration response characteristics
The selection of acceleration measuring points is shown in Fig. 3. The points are taken along the height direction in the free site layer and the stratum above the three tunnel axes. The measuring points selected in the free site layer are Bedrock1, Bedrock2, A11, A12, A13 and A14.
Sort out the data collected by each measuring point. Then draw the vertical variation curve of acceleration and its amplification factor when inputting different seismic waves (Fig.4). The peak acceleration and acceleration amplification coefficient are small (about 1) in the soil-rock mixture and Bedrock (sandstone), but large in the backfill grouting area, which is approximately distributed in an inverse “Z” shape.
The upper part of the soil-rock mixture is subjected to large seismic load, and serious shear failure and plastic deformation have occurred, which leads to the acceleration of the upper part of the soil-rock mixture is smaller than that of the lower part. As can be seen from Fig. 4(a), when 0.6 g Kobe wave and 0.8 g Wolong wave are applied, the acceleration at measuring points A13 and A14 on the upper part of the soil-rock mixture has no obvious change. At this time, this part of the stratum has undergone obvious plastic failure, and its peak acceleration tends to “saturation”. The soil layers at A11 and A12 are affected by the tunnel pile structure, and their plastic deformation is less than that of the upper soil layer. Therefore, its peak acceleration is greater than that of the upper soil-rock mixture. This also shows that the soil-rock mixture has shown obvious nonlinear characteristics under 0.6 g seismic wave load.
Fig. 3Schematic diagram of model acceleration measuring points
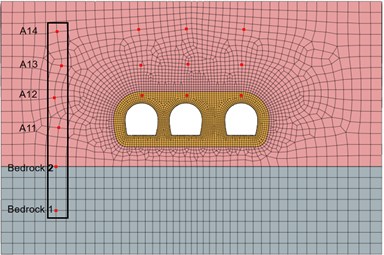
Fig. 4Variation curve of peak acceleration and acceleration Fang along height direction
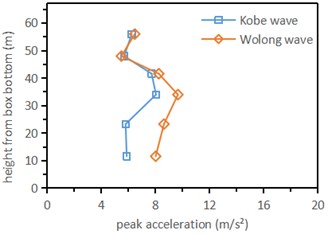
a) Peak acceleration
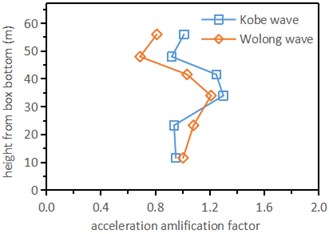
b) Acceleration amlification factor
3.2. Dynamic response of tunnel pile structure
3.2.1. Bending moment of tunnel
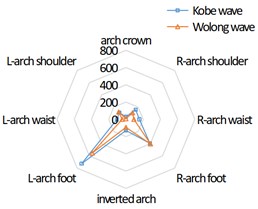
In direction, the bending moment values at the shoulder and arch foot are larger, while the bending moment values at the arch crown, arch waist and inverted arch are smaller; In direction, the bending moment at the arch foot of the tunnel is the largest, and the bending moment of other parts is small. When Kobe wave and Wolong wave are input, the maximum bending moments of lining in direction are 1744 kN·m and 1322 kN·m respectively, and the maximum bending moments in direction are 1387 kN·m and 1012 kN·m respectively. The peak acceleration of Kobe wave is about 0.6 g, while that of Wolong wave is about 0.8 g. Although the peak acceleration of Wolong wave is greater than that of Kobe wave, the lining bending moment caused by Kobe wave is higher than that of Wolong wave. It can be seen that the bending moment of lining is affected not only by the peak acceleration of seismic wave, but also by the type of seismic wave.
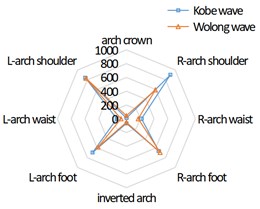
Fig. 5 and Fig. 6 respectively show the bending moment distribution in direction and direction of tunnel cross section under the action of seismic wave.
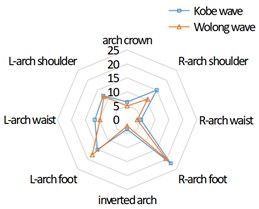
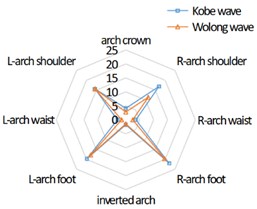
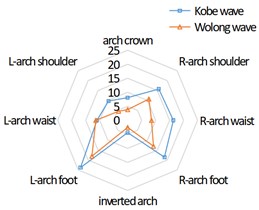
It can be seen from Figure 5 that under the action of Kobe wave and Wolong wave, the bending moment of the left, middle and right tunnel in the direction presents an “X” distribution. In the direction, the bending moment of the left arch shoulder, left arch waist and right arch foot of the left tunnel is greater than that of the right arch shoulder, right arch waist and left arch foot; The bending moment of the right arch shoulder, right arch waist and left arch foot of the right tunnel is greater than that of the left arch shoulder, left arch waist and right arch foot; and there is little difference between the bending moment of the left and right arch shoulders and arch feet of the middle tunnel lining. The three tunnel lining presents symmetrical distribution on the whole.
It can be seen from Fig. 6 that, similar to the direction, the bending moment of the cross section of the 3-line tunnel in the direction is distributed in an inverted “V” shape. The overall distribution conforms to the symmetrical distribution, that is, the bending moment at the arch foot of the 3-line tunnel is much greater than that at other parts, the bending moment at the right arch foot of the left tunnel lining is significantly greater than that at the left arch foot, the bending moment at the left arch foot of the right tunnel lining is significantly greater than that at the right arch foot, and the bending moment at the left and right arch feet of the middle tunnel lining is not different.
Fig. 5Bending moment distribution in X direction of tunnel cross section under earthquake (unit: kN·m)
a) Left tunnel
b) Middle tunnel
c) Right tunnel
Fig. 6Bending moment distribution in Y direction of tunnel cross section under earthquake (unit: kN·m)
a) Left tunnel
b) Middle tunnel
c) Right tunnel
3.2.2. Tunnel stress response
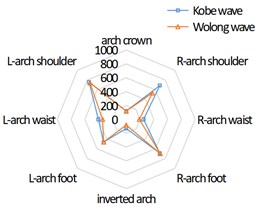
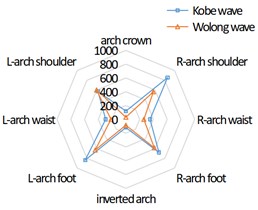
When 0.4 g Kobe wave and 0.4 g Wolong wave are input, the maximum compressive stress of tunnel lining appears at arch crown, arch waist and inverted arch. The maximum tensile stress and maximum shear stress appear at the arch foot and arch shoulder of the lining. Under the action of Kobe wave, the maximum tensile stress is about 21 MPa and the maximum shear stress is about 12 MPa; Under the action of Wolong wave, the maximum tensile stress of lining is about 16 MPa and the maximum shear stress is about 7 MPa. Under the action of two kinds of seismic waves, the maximum stress of the lining is much greater than the ultimate tensile stress and ultimate shear stress that the lining can bear. The same as the lining moment response, the stress dynamic response under the action of Kobe wave (0.6 g) is greater than that under the action of Wolong wave (0.8 g), which shows that the lining stress response is not only related to the peak acceleration of seismic wave, but also related to the shape of seismic wave.
The distribution characteristics of the maximum tensile stress and the maximum shear stress on the tunnel lining cross section under the action of seismic waves are consistent. Take the maximum tensile stress distribution as an example, as shown in Fig. 7. In the left tunnel, the stress at the arch foot is the largest, in which the right arch foot is greater than the left arch foot, and the arch shoulder and left arch waist are about 3/5 of that at the arch foot; The stress distribution of the right tunnel is axisymmetric with that of the left tunnel; The stress of the middle tunnel is the largest at the left and right arch feet, followed by the left and right arch shoulders, and smaller at the arch crown, arch waist and inverted arch, showing an “X” shape distribution as a whole.
Fig. 7Maximum tensile stress distribution of tunnel cross-section under the action of seismic waves (unit: kN·m)
a) Left tunnel
b) Middle tunnel
c) Right tunnel
3.2.3. Moment response of pile
In sandstone stratum, the bending moment of pile body is small. The bending moment of the pile is large at two places from bottom to top: one is at the junction of sandstone and soil-rock mixture, and the other is near the top of the pile. In the actual construction process, not only the bending reinforcement at the top of the pile, but also the reinforcement of the pile crossing different strata should be considered. In terms of numerical value, the maximum bending moment of the pile under the action of Kobe wave is 1706 kN·m, and the maximum bending moment under the action of Wolong wave is 1046 kN·m.
Fig. 8Variation curve of pile bending moment along height direction under earthquake
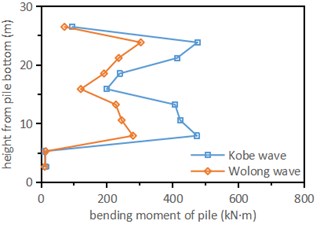
a) Left pile
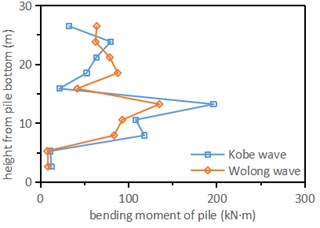
b) Right pile
The change law of pile foundation in the left, middle and right tunnels is similar, so only two piles in the left tunnel are analyzed as an example. Fig. 8 is the bending moment diagram of each point of the pile along the height direction when different peak accelerations are input under the action of Kobe wave and Wolong wave. It can be seen from Fig. 8 that the bending moment of the pile body near the top and the junction of sandstone and soil-rock mixture stratum is large, and the bending moment of the left pile is much greater than that of the right pile.
3.3. Soil pressure distribution law
Under the action of horizontal Kobe wave and Wolong wave, the soil pressure in X direction is relatively small in the soil-rock mixture stratum as a whole, and the soil pressure near the grouting body, especially near the lining, increases significantly; In sandstone stratum, the soil pressure around the pile is large. It shows that the soil-rock mixture stratum has a certain range of shear failure and plastic deformation, which has exceeded the shear strength of the soil-rock mixture.
3.4. Horizontal displacement of structure
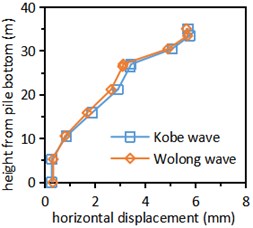
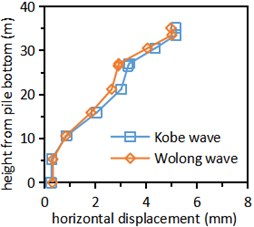
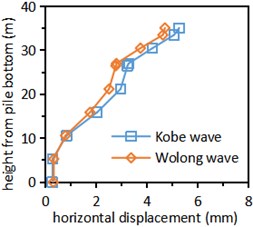
Draw the curve of relative horizontal displacement of tunnel pile structure with height under the action of Kobe wave and Wolong wave (Fig. 9).
It can be seen from Fig. 9 that when different seismic waves are input, the variation trend of the relative horizontal displacement of the tunnel pile structure with the height of the structure is similar, which gradually increases with the increase of the height, and reaches the maximum at the top of the lining arch. Generally speaking, the lateral displacement of the tunnel pile structure is divided into four layers. The first layer is the pile in the sandstone stratum, and its lateral displacement is very small and almost unchanged along the vertical direction. The second layer is the pile in the soil rock mixture stratum, and the horizontal displacement increases linearly along the height direction. The third layer is the pile in the grouting ring, and the lateral displacement along the height is still increasing, but the increase range is much smaller than that in the soil rock mixture stratum. The fourth layer is the lining structure, and the lateral displacement increases linearly along the height.
Fig. 9Variation curve of horizontal displacement of structure along height under earthquake
a) Left tunnel
b) Middle tunnel
c) Right tunnel
4. Conclusions
1) Under the action of seismic wave, the soil-rock mixture stratum has shown strong nonlinear characteristics, and it has appeared shear failure and plastic deformation. Its acceleration response and soil pressure response show a “saturated” state, which does not increase significantly with the increase of input seismic wave peak value.
2) Under the action of horizontal earthquake, the bending moment in direction on the cross section of tunnel are distributed in “X” shape, and the bending moment in direction are distributed in inverted “V” shape. The tensile stress and shear stress are distributed in an “X” shape. The dynamic responses of the left, middle and right tunnels interact with each other. The dynamic responses at the left shoulder, left arch waist and right arch foot of the left tunnel are greater than those at the right shoulder, right arch waist and left arch foot. The right tunnel and the left tunnel show axisymmetric distribution, while the dynamic responses of the left and right shoulder, waist and foot of the middle tunnel are similar.
3) Under the action of earthquake, the main failure form of tunnel lining is tension shear failure. The most vulnerable position is the left and right arch foot, followed by the left and right arch shoulder.
4) The bending moment of the pile presents a nonlinear change in the height direction. The bending moment is the largest near the top 1/5 pile length and the junction between the soil-rock mixture and the sandstone stratum; The horizontal displacement of tunnel-pile structure increases gradually with the increase of height, and reaches the maximum at the tunnel crown. The horizontal displacement of tunnel lining structure gradually flattens with the increase of height.
References
-
L. T. Cabangon, G. Elia, and M. Rouainia, “Modelling the transverse behaviour of circular tunnels in structured clayey soils during earthquakes,” Acta Geotechnica, Vol. 14, No. 1, pp. 163–178, Mar. 2018, https://doi.org/10.1007/s11440-018-0650-9
-
X. Bao, Z. Xia, G. Ye, Y. Fu, and D. Su, “Numerical analysis on the seismic behavior of a large metro subway tunnel in liquefiable ground,” Tunnelling and Underground Space Technology, Vol. 66, pp. 91–106, Jun. 2017, https://doi.org/10.1016/j.tust.2017.04.005
-
H. W. Zuo et al., “Seismic dynamic response characteristics of metro double-arch tunnel lining structure,” (in Chinese), Science Technology and Engineering, Vol. 21, No. 30, pp. 13139–13147, 2021, https://doi.org/10.3969/j.issn.1671-1815.2021.30.047
-
X. Cheng, X. Zhou, H. Liu, Y. Zhou, and W. Shi, “Numerical analysis and shaking table test of seismic response of tunnel in a loess soil considering rainfall and traffic load,” Rock Mechanics and Rock Engineering, Vol. 54, No. 3, pp. 1005–1025, Mar. 2021, https://doi.org/10.1007/s00603-020-02291-0
-
J. Li, Y. Lou, X. Yang, and X. Jin, “Nonlinear seismic analysis of a train-tunnel-soil system and running safety assessment of metro vehicles,” Soil Dynamics and Earthquake Engineering, Vol. 147, p. 106772, Aug. 2021, https://doi.org/10.1016/j.soildyn.2021.106772
-
J. Niu, X. Jiang, and F. Wang, “Stability analysis of rock slope with small spacing tunnel under earthquakes and influence of ground motion parameters,” Geotechnical and Geological Engineering, Vol. 36, No. 4, pp. 2437–2453, Jan. 2018, https://doi.org/10.1007/s10706-018-0475-1
-
G. D. Sun, “Study on dynamic response of pile-supported small spacing tunnel in deep backfill area under earthquake,” Chongqing University, 2022.
About this article

