Abstract
In order to obtain the seismic dynamic laws of the acceleration and displacement of a shallow-buried bifurcated tunnel, the analysis of the numerical simulation was carried out by MIDAS-GTS/NX software. The results of the numerical simulation were verified by a shaking table model test. The results show that: (1) the numerical simulation and shaking table test coincide with each other in terms of variation law and peak value. The results of the numerical simulation are credible. (2) For different tunnel cross-section, the response of acceleration and displacement are significant difference. (3) The seismic response of the small distance tunnel (Section 6) is intense. The seismic response laws of the small distance tunnel are significant difference from other type tunnels. The seismic response of the measuring point at the middle rock column is intense. (4) Along the axis of the tunnel, the displacement of the tunnel firstly increases and then decreases. The displacement of the measuring point at the middle rock column is intense, which is in accordance with the law of the acceleration response. The seismic response laws of the tunnel are significantly affected by the middle rock column. The section structure size has a significant effect on the dynamic response of the tunnel.
Highlights
- Research on dynamic response of tunnels with various cross-section types has been carried out.
- Large-scale shaking table tests were carried out to verify the reliability of the numerical simulation.
- The dynamic response of tunnels with different cross-section types under interaction is studied.
1. Introduction
The seismic performance of underground structures is stronger than that of ground buildings [1-4]. Previously, there are few studies on seismic response of underground structures. In 1995, many tunnels and subway stations were severely damaged by the great earthquake in Japan [5]. The Hanshin Earthquake caused significant damage to several tunnels in Sanyo Shinkansen system [6]. Scholars have realized that underground structures are also vulnerable to damage in earthquake. In recent years, some tunnels have been seriously damaged in several major earthquakes. For example, the 1999 Chi-chi earthquake in Taiwan, the 1999 Kocaeli earthquake in Turkey, and the 2008 Wenchuan earthquake in China [7-10]. Therefore, the importance of dynamic response and seismic performance of underground structures has been gradually attached importance.
In addition, scholars have used shaking table model test, numerical simulation and theoretical research to study the seismic response of underground structures [11-21].
The seismic response of the tunnel has been studied and abundant results have been obtained. However, the current research mainly focuses on the dynamic response of a single type of tunnel. The surrounding rock contains soil and rock medium, which affects the dynamic response of tunnel structure [22-25]. The shallow-buried bifurcated tunnel was less studied. The complicated structure and overlying strata instability cause the significant difference of seismic dynamic response, compared to other type of tunnels. Therefore, the seismic response characteristics, failure mechanism, and dynamic stability of the shallow-buried bifurcated tunnel become the problems that need to be urgently solved by researchers.
The numerical methods (e.g. FEM, FDM and BEM), as the most popular approaches, have been used to study the dynamic response of tunnels. According to the engineering example, a series of numerical simulation was carried out to obtain the seismic dynamic response characteristics of the tunnel. Furthermore, a few experimental works have been reported. The results obtained by the numerical method were credible and reasonable, based on the comparison between the shaking table test and the numerical method. This study aims to perform a systematic experimental work followed by means of an extended numerical simulation study to elaborate some dimensions of the problem. The seismic dynamic response of the tunnel, including acceleration, and dynamic displacement was investigated in the present study. The research results can provide reference for seismic research of complex multi-type tunnels.
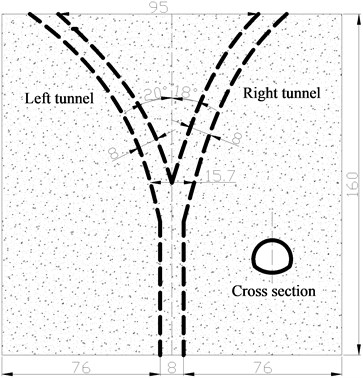
2. Engineering example
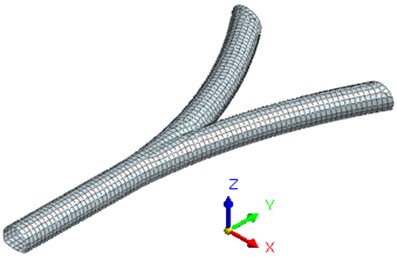
The length of a bifurcated tunnel is 2.19307 km. The length of the left tunnel is 249.551 m, and the length of the right tunnel is 1137.454 m. The length of the southern terminal is 272.546 m, and the length of the North terminal is 783.07 m. The shallow-buried bifurcated tunnel is been shown in Fig. 1.
Fig. 1Shallow-buried bifurcated tunnel (unit: m)
a) Top viewport
b) Front view
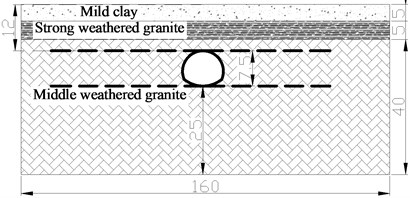
The geomorphic units, along the tunnel, belong to the stump and hilly areas. The slopes are undulating, and the elevation along the tunnel is 28-135.11 m. The tunnel is excavated under a city park. The mountain, along the tunnel, has a high and steep slope, the natural slope angle is between 20-40°, and some sections are more than 50°. The mountains are dense with grass and shrubs, and made up of tuff. There are no geological disasters, such as collapse, debris flow, landslide, ground fissure, karst collapse, and other geological hazards in the construction site.
There is no surface water passing along the proposed tunnel. The overall groundwater will not cause significant harm to the tunnel construction. The upper and lower layers of the rock and soil are miscellaneous fill, mild clay, tuff stump subclay, stump subclay, fully weathered tuff, fully weathered granite, strongly weathered granite, and middle weathered granite, respectively. The tunnel section selected in this paper is a case study of the bifurcation section with shallow depth. In order to simplify the complexity of research work, the surrounding rock is divided into three layers, which are mild clay, strongly weathered granite, and middle weathered granite. The physical and mechanical parameters of surrounding rock are given in Table 1.
Table 1Parameters of surrounding rock
Surrounding rock | Elastic modulus (MPa) | Poisson ratio | Bulk density (kN·m3) | Internal friction angle (°) | Cohesion (kPa) |
Mild clay | 6000 | 0.25 | 23 | 39 | 700 |
Strongly weathered granite | 1300 | 0.21 | 20 | 27 | 200 |
Middle weathered granite | 15600 | 0.23 | 25 | 40 | 1500 |
3. Numerical simulation
MIDAS-GTS/NX is a general finite element analysis software developed for geotechnical engineering. It supports not only linear or non-linear static analysis, linear or non-linear dynamic analysis, seepage and consolidation analysis, slope stability analysis and construction stage analysis, but also seepage-stress coupling, stress-slope coupling, seepage-slope coupling and non-linear dynamic analysis. In this paper, MIDAS-GTS/NX is used to simulate the dynamic response of the tunnel.
The structural dynamic time history analysis refers to the process of calculating the structural response (displacement, velocity, internal force, etc.) at any moment when the structure is subjected to dynamic loads. The dynamic equilibrium equation is used in the dynamic time history analysis of the MIDAS-GTS/NX, which is as follows:
where is the mass matrix, is the damping matrix, is stiffness matrix, is dynamic loading, is relative acceleration, is relative velocity, is relative displacement.
In nonlinear dynamic time history analysis, the direct integration method is adopted. Direct integral method is a method of time as the integral parameter solution of dynamic equilibrium equation. Analysis of dynamic time history using Newmark method with better convergence in MIDAS-GTS/NX. The basic integral method is as follows [26]:
can be obtained by the Eq. (3). It is got into Eq. (2), and is calculated to obtain the relationship between displacement, velocity, and acceleration of the current stage and that of last stage:
Getting Eq. (4) into Eq. (5), and the present displacement can be obtained. The present velocity, acceleration can be obtained by present and last displacement:
, are integral parameter of Newmark ( 0.5, 0.25). is integral time interval.
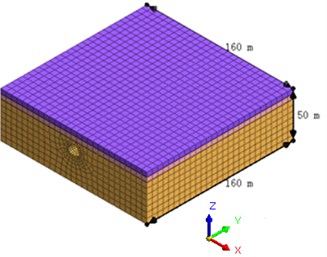
3.1. Establishment of numerical model
In order to avoid the boundary effect in numerical simulation, more than five times the model size is adopted. Therefore, the three-dimensional dimensions of the numerical model are 160 m (length), 160 m (width), and 50 m (height), respectively.
For the accurate representation of wave transmission through a model, the element size , must satisfy the following formula [27]:
where is wave length.
According to the actual situation and computer performance, the total number of nodes is 14.503, and units is 22.682. The solid element is used to simulate the surrounding rock and the lining. The elastic-plastic constitutive model and the Mohr-Coulomb yield criterion are used in numerical simulation. In the computational model, the free field boundary and Rayleigh damping are used. The critical damping ratio of 5 % is considered. The numerical simulation is shown in Fig. 2.
Fig. 2Calculation model of the surrounding rock and tunnel
a) Surrounding rock model (unit: m)
b) The lining model
3.2. Boundary condition of numerical simulation
In the process of seismic wave propagation, the generalized structure or rock mass structural plane will encounter and interfere with the incident wave. A complex wave field is formed. When a simulated seismic wave is propagated in a medium, it is necessary to consider the effect of the dynamic influence of the infinite domain. For underground structures, if the fixed boundary is adopted, the error of the calculation results will occur. Therefore, the artificial boundary should be introduced. Artificial boundaries will not affect the seismic waves of the outsider or limit the energy to the limited discrete area. The accurate results can be obtained. In order to avoid the scattering wave to reflect on the artificial boundary, the elastic recovery performance of the medium is simulated. In the numerical analysis, the free field boundary conditions are used around the surrounding rock. The free field boundary can simulate the elastic recovery performance of the semi-infinite medium with artificial boundary. The seismic wave will not be reflected. In the numerical model, a fixed boundary is used at the bottom of the tunnel and surrounding rock.
3.3. Seismic wave and measurement point
The Wenchuan wave is used as the excitation wave in the numerical simulation. The loading mode is -direction, -direction and -bidirectional loading, and the code names are WC-X, WC-Z, and WC-XZ, respectively. The test loading scheme is shown in Table 2. The seismic intensity of the experimental study is VII-X. The corresponding acceleration peaks are adjusted to 0.1 g, 0.2 g, 0.4 g and 0.6 g according to the standard [28, 29]. The time history curve and Fourier spectrum of the Wenchuan wave is shown in Fig. 3. The loading scheme of seismic waves is shown in Table 2.
Fig. 3Time history curve of acceleration of Wenchuan wave and its Fourier spectrum
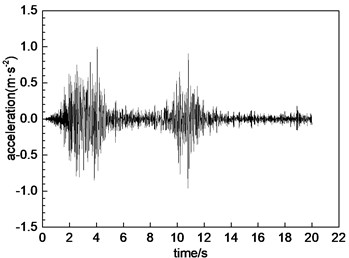
a) Time history curve of acceleration
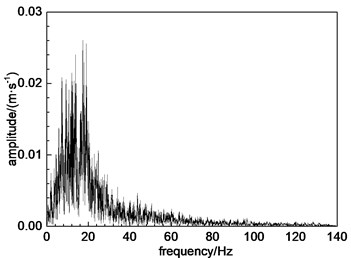
b) Fourier spectrum
Table 2Parameters of ground motion of input earthquakes under simulation condition
Number | Code | Acceleration peak/m·s-2 | |
-direction | -direction | ||
1 | WC-X | 0.1 | – |
2 | WC-Z | – | 0.067 |
3 | WC-XZ | 0.1 | 0.067 |
4 | WC-X | 0.2 | – |
5 | WC-Z | – | 0.133 |
6 | WC-XZ | 0.2 | 0.133 |
7 | WC-X | 0.4 | – |
8 | WC-Z | – | 0.267 |
9 | WC-XZ | 0.4 | 0.267 |
10 | WC-X | 0.6 | – |
11 | WC-Z | – | 0.400 |
12 | WC-XZ | 0.6 | 0.400 |
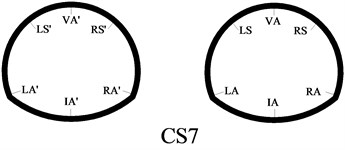
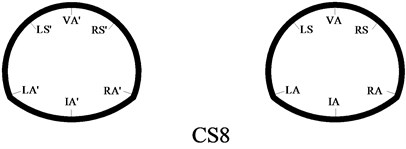
In order to better study the seismic dynamic response characteristics of the bifurcated tunnel, six measuring points are arranged at the cross-section of the tunnel. Those are VA-vault, LS-left spandrel, LA-left arch springing, IA-inverted arch, RA-right arch springing, RS-left spandrel. Fifteen measuring points are evenly arranged along the axial direction of the tunnel. The V1-V15 are in the right tunnel. The V1-V15’ are in the left tunnel. The specific point layout is shown in Fig. 4. Because the bifurcated tunnel is in different positions, the cross-section of the tunnel is different. In order to better show the cross-section of the tunnel in different positions, a series of research on the cross-section of the key parts is carried out in this paper. The cross-sections are CS1-CS8. The cross-section 1, 2 and 3 are a common single tunnel. The cross-section 4 and 5 are extended section tunnel. The cross-section 6 is multi-arch tunnel. The cross-section 7 is small distance tunnel. The cross-section 8 is a separate tunnel. The specific section situation is shown in Fig. 5.
Fig. 4Axial section of tunnel
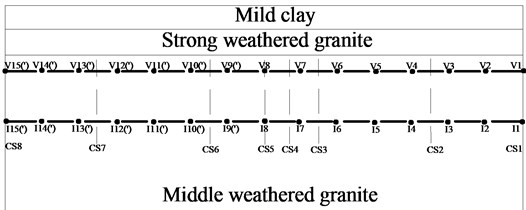
Fig. 5Cross-section of tunnel at different position
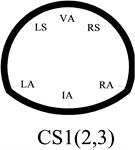
a) Cross-section 1, 2 and 3
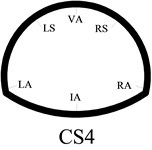
b) Cross-section 4
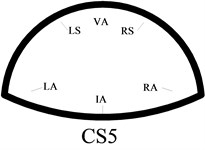
c) Cross-section 5
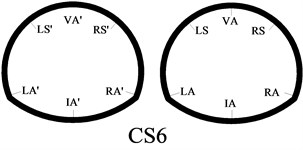
d) Cross-section 6
e) Cross-section 7
f) Cross-section 8
4. Results and analysis
4.1. Verification of shaking table test
In order to study the dynamic characteristics of the bifurcated tunnel under the earthquake action, a large shaking table model test was carried out. The test was carried out in the National Engineering Laboratory of the construction technology of the high-speed railway in Central South University. The dimensions of the test model are 3.0 m (length), 1.8 m (width) and 2.2 m (height), respectively. Different proportioning mortar is used to simulate the rock stratum, and it is divided into three layers in the rigid model box. The acceleration sensor is used in the experiment. The sensor is all arranged at the key point position of the tunnel inside the tunnel, which is used to measure the acceleration response of the tunnel [30-32].
In order to verify the simulation effect of MIDAS-GTS/NX, the acceleration response data obtained from the test condition were compared with those of the numerical simulation. The comparison results between the numerical simulation and the shaking table test are shown in Table 3. The acceleration response time curve of the test point VA is compared to Fig. 6 under the condition of 10 conditions at cross-section 1.
Table 3Comparison of acceleration response peak value (unit: m·s-2)
Measuring points | Shaking table test | Numerical simulation |
IA | 0.2 | 0.19 |
LA | 0.15 | 0.13 |
LS | 0.06 | 0.05 |
VA | 0.05 | 0.05 |
RS | 0.07 | 0.05 |
RA | 0.17 | 0.16 |
Fig. 6Comparison of acceleration response time history curve
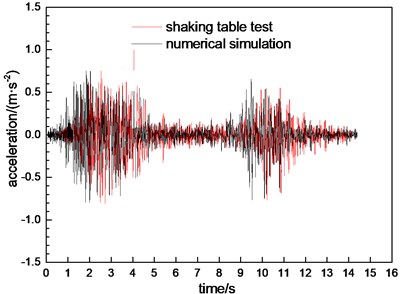
According to Table 3, the peak acceleration obtained by numerical simulation is close to the result of the shaking table test. According to Fig. 6, the time history curve of the numerical simulation is similar to the time history curve of the shaking table. Table 3 and Fig. 6 illustrate that the results of the numerical simulation which are in good agreement with the shaking table test. The results obtained by the numerical simulation are reliable. The dynamic response characteristics of the bifurcated tunnel can be further studied by the method of numerical simulation.
4.2. Analysis of lining mode
The mode of the tunnel can be obtained by the finite element numerical analysis software MIDAS GTS/NX. The modes from one to four of a bifurcated tunnel are analyzed. The modal deformation of the tunnel lining is shown in Fig. 7.
The modes and natural frequencies of the tunnel are obtained through eigenvalue analysis. The natural frequency of the mode 1 is 6.26 Hz. The natural frequencies of mode 2 to mode 4 are 6.34 Hz, 6.36 Hz, and 6.38 Hz, respectively. The higher the mode, the higher the corresponding natural frequency. The deformation of the left lining is more severe than the right lining in the mode 1. The red area indicates that the deformation is serious in Fig. 7. However, the deformation of the right lining is more severe than the left lining in the modes 2, 3, and 4. For high frequency seismic action, the right lining may be significantly damaged. Bifurcated tunnels are more vulnerable to seismic damage than single tunnels.
Fig. 7Modal deformation of the tunnel lining
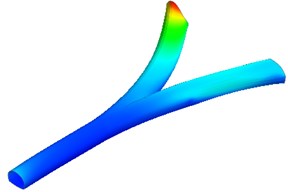
a) Mode 1
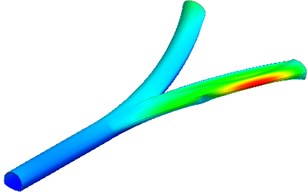
b) Mode 2
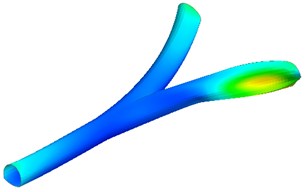
c) Mode 3
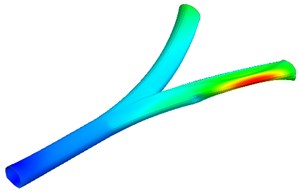
d) Mode 4
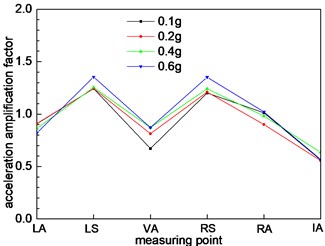
4.3. Acceleration response
The acceleration response characteristics of shallow bifurcated tunnels are described by using the acceleration amplification factor. The acceleration amplification factor is calculated by the Eq. (10):
where is the acceleration peak value at the measuring point; is the acceleration peak value maximum of loading earthquake.
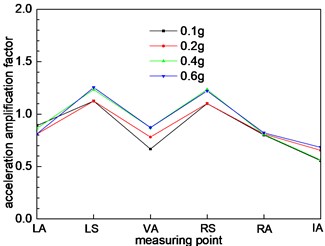
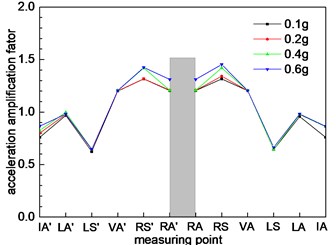
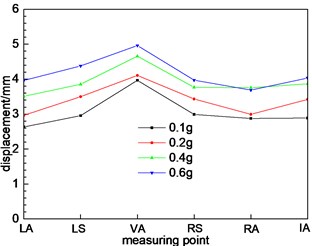
Under the condition 1, the acceleration response laws of the different cross section of the tunnel are shown as shown in Fig. 8.
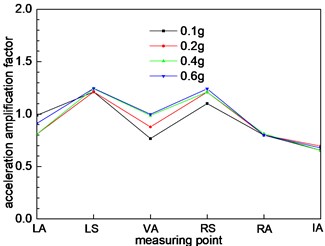
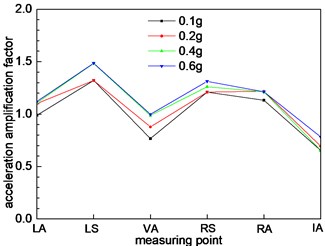
From Fig. 8(a), the acceleration response of the left and right shoulders are stronger than other measuring points. The acceleration magnification factors are more than 1, which indicates that the location has a significant effect on the seismic wave. In the seismic design of the tunnel, the strength of this position should be strengthened. The anti-seismic performance should be enhanced. The acceleration magnification factors are less than 1 at other points, which has a certain weakening effect on the seismic waves. The variation trend of acceleration amplification factor presents the “M” type. The acceleration magnification factors are the least at the inverted arch, which indicates that the inverted arch is not easily damaged by the earthquake. With the increase of the loading peak, the acceleration magnification factor increases to a certain extent. It is shown that the loading peak has a significant effect on the acceleration amplification factor. As the section 1 and section 2 and 3 are in the same geometrical size, the dynamic response of the section 2 and 3 is similar to that of the section 1, and the trend of variation is basically the same. There is a slight difference in numerical value.
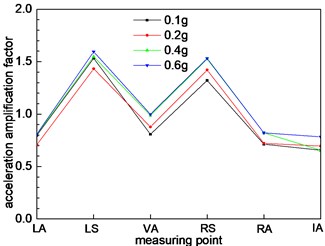
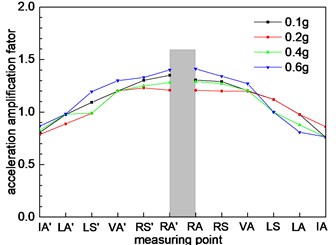
As shown in Fig. 5, the size of the interface 4 of tunnel is larger than the section 1, 2, and 3. It can be seen from Fig. 8(d) that the acceleration amplification factor increases at the measuring point on the 4 section of the section. It is shown that the size of the tunnel cross section has a significant effect on the dynamic response of the tunnel. The variation trend also shows an “M” shape. The largest value is the left arch shoulder, and the acceleration amplification factor is 1.5. The smallest value is the inverted arch, and the acceleration amplification factor is 0.6. The cross-section of section 5 is a larger than section 4, and it belongs to large section tunnel. Under the action of seismic waves, the dynamic response of the acceleration is further strengthened. The overall trend of change is similar to that of section 4, and there is only a weak difference in the size of the numerical value.
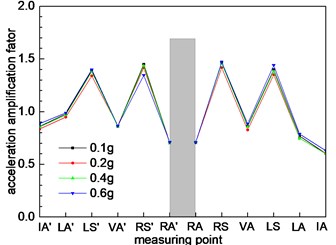
Fig. 8Different cross sections at different positions
a) Cross section 1
b) Cross section 2
c) Cross section 3
d) Cross section 4
e) Cross section 5
f) Cross section 6
g) Cross section 7
h) Cross section 8
As shown in Fig. 5, section 6 is a small distance tunnel. Due to the interaction between the left and right holes, the seismic response is intense. The dynamic response characteristics are significantly different from other type tunnels. From Fig. 8(f), it is known that the dynamic response of measuring point at the middle rock column is the strongest, and the maximum of acceleration amplification factor is 1.5. The acceleration response of the left tunnel and the right hole in the small distance tunnel is symmetrical. The interaction between the left hole and the right hole gradually decreases with the increase of the distance between the small distance tunnel. Fig. 8(g) shows the trend of the acceleration change of the point in section 8. The nearer the rock column in the distance, the stronger the dynamic response of the acceleration. With the increase of the distance between the left hole and the right hole, the interaction between the left tunnel and the right tunnel eventually disappear. Fig. 8(h) shows that the dynamic response of a tunnel with the left tunnel and the right tunnel is similar to the section 1, 2, and 3. There is only a weak difference in the numerical value.
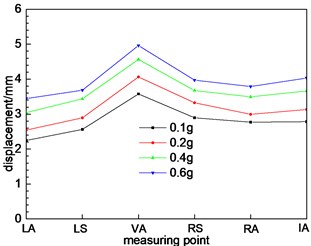
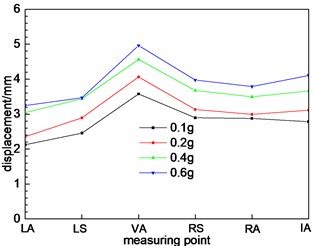
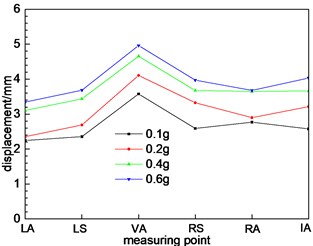
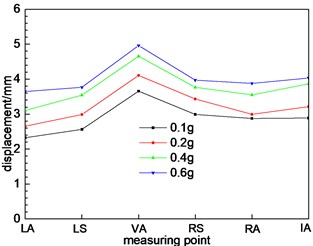
4.4. Dynamic displacement response
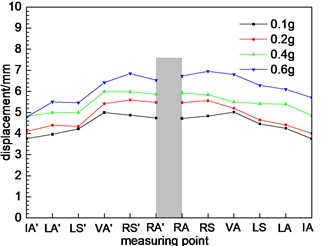
The displacement of a tunnel will change under the action of the earthquake. The dynamic response of the tunnel is described by investigating the change of the dynamic displacement of the measuring point. The dynamic displacement response of measuring point at different cross-section is shown in Fig. 9. In order to better examine the axial deformation of the tunnel, the absolute value of the vertical displacement is used as the evaluation criterion. Because the dynamic displacement response of the left and right tunnel is consistent, the standard is only analyzed by the change of the dynamic displacement of the right tunnel. Fig. 9 shows the dynamic displacement response of axial direction at the arch shoulder.
Fig. 9Dynamic displacement response of axial direction at arch shoulder
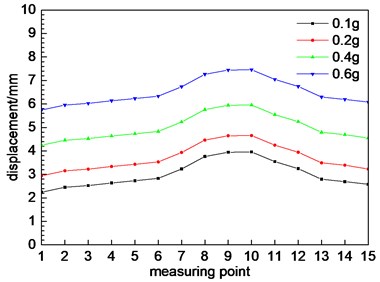
As shown in Fig. 9, along with the axis of the tunnel, the dynamic displacement of the tunnel shows a tendency to increase first and then decrease. The maximum dynamic displacement is located at the test point 9 and the measuring point 10, which is located near the section 6. As shown in Fig. 5, section 6 belongs to the small distance tunnel type, which indicates that the stability of this type of tunnel is relatively poor under seismic action, and seismic fortification measures should be strengthened. With the expansion of the distance, the dynamic displacement of the tunnel decreases, which indicates that the distance between the tunnels affects the response of the ground motion of the tunnel. Under the effect of different excitation peaks, the dynamic displacement of the tunnel is different. The greater the peak value, the greater the dynamic displacement. The changing trend of the dynamic displacement corresponds to the response of the acceleration of each section.
As we can see from Fig. 10(a), the displacement of each point of the tunnel section 1 firstly increases and then decreases. The dynamic displacement of the arch shoulder is the largest, and the dynamic displacement is minimum at the arch foot. The dynamic displacement of the test point is different with the different loading peak value, and the dynamic displacement increases with the increase of the load peak. As the section 2, 3 and section 1 are basically the same, the dynamic displacement of these three sections is basically the same. The above conclusions can be verified by comparing 9(a) with (c), (d). The dynamic displacement trend of the three sections is basically the same as that of the numerical value. The variation trend of section 4 and 5 is basically the same as that of the numerical value, but the response value is larger than that of section 1, 2 and 3.
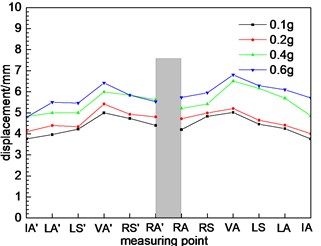
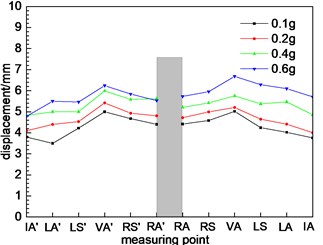
Fig. 10Different cross sections at different positions
a) Cross section 1
b) Cross section 2
c) Cross section 3
d) Cross section 4
e) Cross section 5
f) Cross section 6
g) Cross section 7
h) Cross section 8
According to Fig. 10(f), due to the section 6 belongs to the small distance tunnel, the dynamic displacement response of the section measuring points is quite different from that of the single tunnel section (section 1, 2, 3 and 4), including the trend of variation and the magnitude of the numerical value. The changing trend of dynamic displacement of 6 measuring points gradually increase. The dynamic displacement of the measuring point at the middle rock column is larger, which is in accordance with the law of the dynamic response of the acceleration. The dynamic response characteristics of the tunnel are greatly influenced by the rock column, and the dynamic response law of the tunnel is changed. The section structure has a significant effect on the dynamic response characteristics of the tunnel. As the middle rock pillar widens, the interaction between the left and right holes of the tunnel decreases. The maximum displacement is not located at the measuring point at the middle rock column, but the measuring point of the vault. The peak dynamic displacement of the measuring point can be found to change from the middle rock column to the tunnel vault through Fig. 10(g) and (h).
5. Conclusions
In order to obtain the seismic dynamic characteristics of a shallow-buried bifurcated tunnel, the numerical simulation was carried out by using MIDAS-GTS/NX. The following conclusions can be drawn.
1) The numerical simulation and shaking table test coincide with each other in terms of variation law and numerical results. The results of the numerical simulation are credible.
2) For different tunnel cross-section, the dynamic response of the acceleration and displacement of the tunnel are significantly different. The dynamic response of the bifurcation section (section 6) is intense. The acceleration response of the left and the right shoulders are stronger than other measuring points. The variation trend of acceleration amplification factor presents the “M” type. The acceleration amplification factors are the least at the inverted arch. With the increase of the loading peak, the acceleration magnification factor increases to a certain extent.
3) The seismic response of small distance tunnel is intense. The dynamic response of measuring point at the middle rock column is intense. The interaction between the left hole and the right hole gradually decreases with the increase of the distance between the small distance tunnels. The nearer the rock column in the distance, the stronger the dynamic response of the acceleration. With the increase of the distance between the left hole and the right hole, the influence of the left tunnel and the right tunnel eventually disappear.
4) Along the axis of the tunnel, the dynamic displacement of the tunnel shows a tendency to firstly increase and then decrease. The dynamic displacement of the measuring point at the middle rock column is larger, which is in accordance with the law of the dynamic response of the acceleration. The dynamic response characteristics of the tunnel are significantly affected by the rock column. The section structure has a significant effect on the dynamic response characteristics of the tunnel. As the middle rock pillar widens, the influence between the left and right holes of the tunnel decreases.
References
-
John S. T., Zahrah T. F. Aseismic design of underground structures. Tunnelling and Underground Space Technology, Vol. 2, Issue 2, 1987, p. 165-197.
-
Hashash Y. M. A., Hook J. J., Schmidt B. Seismic design and analysis of underground structures. Tunnelling and Underground Space Technology, Vol. 16, Issue 4, 2001, p. 247-293.
-
Corigliano M., Scandella L., Lai C. G., Paolucci R. Seismic analysis of deep tunnels in near fault conditions: a case study in southern Italy. Bulletin of Earthquake Engineering, Vol. 9, Issue 4, 2011, p. 975-995.
-
Wang Y. X., Zhao Y. L., et al. Analysis of fracturing characteristics of unconfined rock plate under edge on impact loading. European Journal of Environmental and Civil Engineering, 2019, https://doi.org/10.1080/19648189.2018.1509021.
-
Huo H., Bobet A., Fernandez G., Ramırez J. Load transfer mechanisms between underground structure and surrounding ground: evaluation of the failure of the Daikai station. Journal of Geotechnical and Geoenvironmental Engineering, Vol. 131, Issue 12, 2005, p. 1522-1533.
-
Wang X., Liu W., Zhang M. Study on the categorization and mechanism of seismic damage of underground structures. Journal of China Safety Science, Vol. 13, Issue 11, 2003, p. 55-58.
-
Wang W. L., Wang T. T., Su J. J. Assessment of damage in mountain tunnels due to the Taiwan Chi-Chi earthquake. Tunnelling and Underground Space Technology, Vol. 16, Issue 3, 2001, p. 133-150.
-
Jiang Y. J., Wang C. X., Zhao X. D. Damage assessment of tunnels caused by the 2004 Mid Niigata prefecture earthquake using Hayashi’s quantification theory type II. Nature Hazards, Vol. 53, Issue 3, 2010, p. 425-441.
-
Wang Z. Z., Zhang Z. Seismic damage classification and risk assessment of mountain tunnels with a validation for the 2008 Wenchuan earthquake. Soil Dynamics and Earthquake Engineering, Vol. 45, Issue 2, 2013, p. 45-55.
-
Hashash Y. M. A., Park D., Yao J. I. C. Ovaling deformations of circular tunnels under seismic loading, an update on seismic design and analysis of underground structures. Tunnelling and Underground Space Technology, Vol. 20, Issue 5, 2005, p. 435-441.
-
Bathurst R. J., Zarnani S., Gaskin A. Shaking table testing of geofoam seismic buffers. Soil Dynamics and Earthquake Engineering, Vol. 27, Issue 4, 2007, p. 324-332.
-
Hwang J. H., Lu C. C. Seismic capacity assessment of old Sanyi railway tunnels. Tunnelling and Underground Space Technology, Vol. 22, Issue 4, 2007, p. 433-449.
-
Kontoe S. K., Zdravkovic L., Potts D. M. Case study on seismic tunnel response. Canadian Geotechnical Journal, Vol. 45, Issue 12, 2008, p. 1743-1764.
-
Chen J., Shi X. J., Li J. Shaking table test of utility tunnel under non-uniform earthquake wave excitation. Soil Dynamics and Earthquake Engineering, Vol. 30, Issue 11, 2010, p. 1400-1416.
-
Sevim B. Nonlinear earthquake behaviour of highway tunnels. Natural Hazards and Earth System Sciences, Vol. 11, 2011, p. 2755-2763.
-
Sun T. C., Yue Z. R., Gao B. Model test study on the dynamic response of the portal section of two parallel tunnels in a seismically active area. Tunnelling and Underground Space Technology, Vol. 26, Issue 2, 2011, p. 391-397.
-
Chen Z. Y., Shen H. Dynamic centrifuge tests on isolation mechanism of tunnels subjected to seismic shaking. Tunnelling and Underground Space Technology, Vol. 42, Issue 4, 2014, p. 67-77.
-
Xu H., Li T. B., Xia L. Shaking table tests on seismic measures of a model mountain tunnel. Tunnelling and Underground Space Technology, Vol. 60, 2016, p. 197-209.
-
Wang F. F., Jiang X. L., Niu J. Y. Numerical simulation for dynamic response characteristics of tunnel near fault. Electronic Journal Geotechnical Engineering, Vol. 21, Issue 17, 2016, p. 5559-5576.
-
Wang F. F., Jiang X. L., Niu J. Y. The large-scale shaking table model test of the shallow-bias tunnel with a small clear distance. Geotechnical and Geological Engineering, Vol. 35, Issue 3, 2017, p. 1093-1110.
-
Wang F. F., Jiang X. L., Yang H. Experiment and numerical simulation study on acceleration response laws of shallow-buried small spacing tunnel with asymmetrical pressure. Journal of Shock and Vibration, Vol. 36, Issue 17, 2017, p. 238-247.
-
Wang Y. X., Guo Ren P. P. W. X., et al. Laboratory investigation on strength characteristics of expansive soil treated with jute fiber reinforcement. International Journal of Geomechanics, Vol. 17, Issue 11, 2017, https://doi.org/10.1061/(ASCE)GM.1943-5622.0000998.
-
Wang Y. X., Guo P. P., Dai F., et al. Behavior and modeling of fiber-reinforced clay under triaxial compression by combining the superposition method with the energy-based homogenization technique. International Journal of Geomechanics, Vol. 18, Issue 12, 2018, https://doi.org/10.1061/(ASCE)GM.1943-5622.0001313.
-
Zhao Y. L., Zhang L. Y., Wang W. J., et al. Cracking and stress-strain behavior of rock-like material containing two flaws under uniaxial compression. Rock Mechanics and Rock Engineering, Vol. 49, 2016, p. 2665-2687.
-
Zhao Y. L., Wang Y. X., Wang W. J., et al. Modeling of non-linear rheological behavior of hard rock using triaxial rheological experiment. International Journal of Rock Mechanics and Mining Sciences, Vol. 93, 2017, p. 66-75.
-
Jiang X. L., Wang F. F., Yang H. Parameter sensitivity of shallow-bias tunnel with a clear distance located in rock. Advances in Civil Engineering, Vol. 2018, 2018, p. 5791354.
-
Lysmer J., Kuhlemeyer R. L. Finite dynamic model for infinite media. Journal of Engineering Mechanics, Vol. 95, Issue 4, 1969, p. 859-877.
-
GB50011-2010 Code for seismic design of buildings. The National Standards Compilation Group of People’s Republic of China, Beijing China Architecture and Building Press, 2011.
-
GB50111-2006 Code for seismic design of railway engineering. The National Standards Compilation Group of People’s Republic of China, China Planning Press, 2009.
-
Niu J. Y., Jiang X. L., Wang F. F. Seismic response characteristics of a rock slope with small spacing tunnel using a large-scale shaking table. Geotechnical and Geological Engineering, Vol. 36, Issue 4, 2018, p. 2707-2723.
-
Niu J. Y., Jiang X. L., Wang F. F. Stability analysis of rock slope with small spacing tunnel under earthquakes and influence of ground motion parameters. Geotechnical and Geological Engineering, Vol. 36, Issue 4, 2018, p. 2437-2453.
-
Jiang X. L., Niu J. Y., Lian P. Y., et al. Large-scale shaking table test study on seismic response characteristics of rock slope with small spacing tunnel. Engineering Mechanics, Vol. 34, Issue 5, 2017, p. 132-147, (in Chinese).
Cited by
About this article

Thanks to the funding support from Congo International R&D Center for Mineral Resources Development of Copper and Cobalt (No: 2018WK2052).
Feifei Wang carried out numerical simulation analysis, and wrote this manuscript. Qingyang Ren checked the results of the study. Ping Zou and Jiayong Niu carried out numerical simulation analysis. Zhonghua Meng, Aibing Li and Zhengyu Liu checked the results of the study. Wanjie Hu and Zeng Ma carried out preliminary engineering geological survey work.
