Abstract
The dynamic response characteristics of the tunnel and the stability of the surrounding rock are crucial to its safety of the tunnel. Combining the numerical simulation software and field measurement results, the change of peak particle vibration (PPV) and stress were analyzed, based on the longitudinal wave data from the acoustic tests, the blasting damage effects under the action of different blasting counts, including different locations in the deep part of the surrounding rock, were investigated. The results show that: (1) in the vertical direction of the tunnel, the PPV of the tunnel floor and tunnel sidewall is larger, the PPV of the tunnel top is the second, and the tunnel arch shoulder and arch foot is the smallest; (2) under the action of blasting, the stress concentration at the tunnel bottom and arch foot is easier, and the stress monitoring should be strengthened; (3) The depth of damage at different distances was 1.5 m and 3.0 m, respectively, and the depth of damage to the surrounding rock increased from 2.5 m to 4.0 m when the number of blasts was 10 and the number of blasts was 10.
Highlights
- Impact load of blasting falling body on the safety of HDPE pipe was analyzed
- The process of pipeline collapse is analyzed by numerical simulation
- Safety of pipeline under impact load was evaluated by yield criterion
1. Introduction
With the continuous emergence of railroad tunnel construction, long tunnels and deep buried tunnels in soft rock are common. The construction excavation method of the tunnel will affect the safety and stability of the tunnel [1-3]. And when the tunnel crosses a high-ground stress soft rock area, it is critical to control the blasting vibration to disturb the tunnel structure itself as well as the existing lining damage [4-5], it is of great theoretical value to study tunnel damage and dynamic characteristics.
At present, national and international research scholars have mostly used numerical simulation, theoretical analysis, engineering measurement, and other comprehensive research approaches to study the stability of the tunnel surrounding rock at different levels and angles [6-7]. For example, Fahiminia et al. used the finite element method to study the vibration response of tunnels under the influence of different hollowing methods in large-section tunnels, and the optimized cavity-making method obtained from the experiment has a better field control effect on the construction process and construction cost [8]. However, as the level of the surrounding rock decreases, the ground stress gradually increases and the effect of the tunneling method on the stability of the surrounding rock gradually decreases, while the choice of excavation method and support technology gradually becomes another key factor for the safety and stability of the tunnel. Also, the means of evaluating the safety and stability of integrated and comprehensive tunnels has a significant impact on the choice of tunnel excavation method optimization [9]. For example, Cardoso S et al. used the maximum vibration velocity of the mass in the tunnel as an important index for the evaluation of tunnel stability [10]. However, for tunnel safety as the tunnel mass explosion vibration velocity evaluation index, many scholars also divided the explosion vibration velocity into amplitude, frequency, and wavelength, and then based on the Fourier transform principle and stress wave basis and other theories, an evaluation index that can reflect the safety and stability of tunnel was established. There are three main types of these evaluation metrics that take into account the mass vibration velocity threshold. (1) In 2014, the frequency control criteria corresponding to the relationship between the vibration frequency of the mass in the tunnel and the self-oscillation frequency of the tunnel itself and the lining structure based on the Hilbert-Huang transform (Hilbert-Huang) and other theories were studied [11]. (2) In 2019 and 2020, according to the strength criterion of concrete and the relevant specification standard, the safe vibration velocity control standard corresponding to the frequency and buried depth terrain is established [12-17]. (3) In 2021, based on the propagation of one-dimensional elastic-plastic stress waves in one-dimensional joints in stress-wave theory, a stress-vibration velocity correspondence curve is established, and stress control criteria were established in conjunction with the rock-yielding criterion [18].
Existing studies only analyzed the effect of vibration velocity on the stability of the tunnel surrounding rock at different locations of the tunnel, but only the safety and stability of the tunnel lining surface were considered, and the damage inside the surrounding rock near the palm face was not considered [19]. Diaz-Alban Jet et al. modified the vibration velocity-pressure equation by combining actual engineering examples, but mainly studied the effect of the lining structure and ignored the damage study of the surrounding rock in the near zone of the palm face [20]. In contrast, in this study, numerical simulation software data and field measurement data are combined to study in depth the change law of velocity and stress of the surrounding rock in the near zone of blasting and the far zone of blasting, and the dynamic response characteristics of the tunnel are evaluated from two perspectives of deformation and stress, and the damage characteristics of the tunnel in different dimensions are comprehensively compared and analyzed with the field test data.
Therefore, based on the above discussion, this paper combines numerical simulation and field measurement data, the concept of tunnel damage depth was introduced to study the vibration response characteristics of the surrounding rock at different annular locations of the tunnel. At the same time, the damage range of the tunnel surrounding rock under blasting vibration load was analyzed, and the blasting vibration control of the surrounding rock was studied to provide research for similar engineering backgrounds.
2. Engineering background
The project is located in Yuxi Township, Songyang County, Lishui City, Zhejiang Province, the cave section is located in Mudai Hang Village, Yuxi Township, Songyang County, and the section out of the cave is located in Mudai Hang Village, Yuxi Township, Songyang County. The tunnel with envelope level Ⅳ is blasted by the full section blasting method. The explosive used is a stone powder emulsion explosive, and the perimeter eye used is light explosive. The detonator used is a half-second detonator. The blast holes layout is shown in Fig. 1.
Table 1Calculated parameters related to the numerical model
Material parameters | Density / kg/m3 | Modulus of elasticity / GPa | Poisson’s ratio | Cohesion / MPa | Friction angle / ° | Tensile strength / MPa | Bulk modulus / GPa | Shear modulus / GPa |
Clay | 1230 | 1.4 | 0.12 | 0.03 | 15 | – | 0.36 | 0.032 |
Fully weathered tuff | 1560 | 4.5 | 0.2 | 0.12 | 32 | 0.23 | 1.26 | 2.422 |
Moderately weathered tuff | 1630 | 5.4 | 0.22 | 0.13 | 35 | 0.25 | 1.36 | 3.022 |
Ansan Rock | 2000 | 6.1 | 0.24 | 0.22 | 38 | 0.4 | 1.62 | 3.765 |
The parameter selection of simulation conditions can directly affect the simulation results. According to the results of the tunnel engineering geological survey, based on the rock mechanics tests in the test chamber, the results of the test data were selected as the physical and mechanical parameters of the tunnel envelope structure, as shown in Table 1.
Fig. 1Layout of blast holes in the tunnel (unit: cm): number named 1, 2, 3, 4, 5, 6, 7, 8 represents the number of detonator segments
3. Modeling of numerical simulation
3.1. Equivalent pressure load at the edge of the hollowing hole
In this paper, a triangular load is applied vertically to the edge of the excavation area of the numerical model, and the peak stress can be calculated according to the empirical Eq. (1):
where is the proportional distance; is the distance from the blast center to the load surface; and is the maximum explosive quantity at a single end. The amount of large section charge can be estimated using Sadovsky’s formula [21]:
where: is the distance from the measurement point to the burst center; , for the blasting conditions, is rock properties and other related coefficients; is for the medium mass of the control vibration velocity. The tunnel excavation section triangle load schematic diagram is shown in Fig. 2.
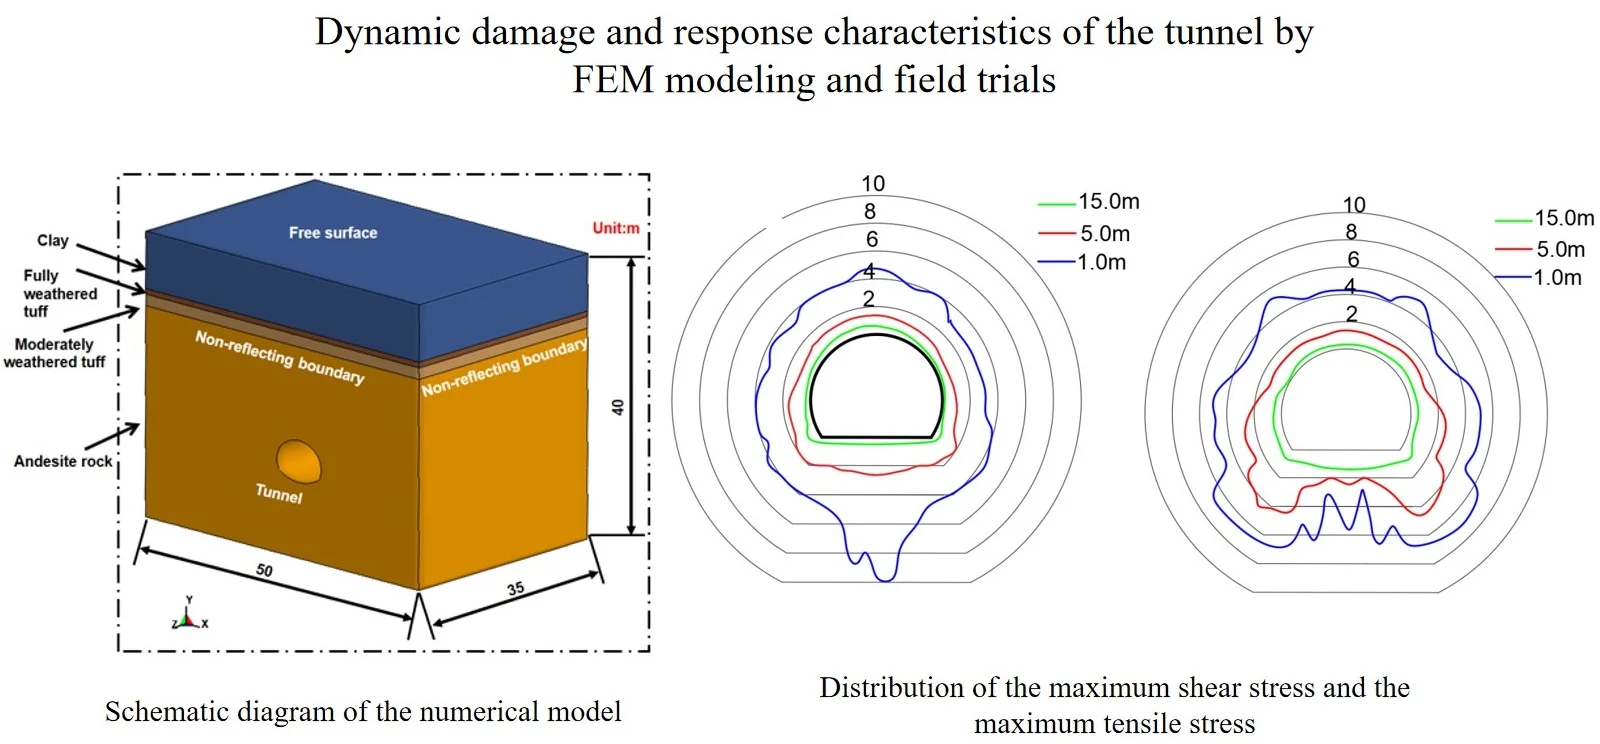
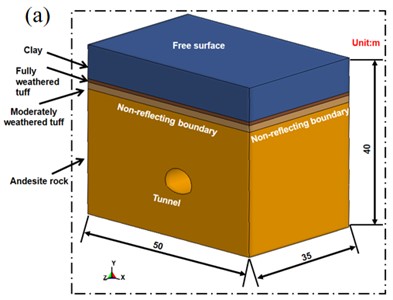
3.2. Numerical calculation model
Using the dynamic finite element model, combined with the actual engineering background and St. Venant’s principle, 3-5 times the tunnel radius is selected as the plastic deformation boundary of the numerical model, so the calculation model size is 35 m×40 m×50 m ( × × ), as shown in Fig. 3. To avoid the influence of reflected waves caused by artificial boundaries on the calculation results, the symmetry plane was set as a symmetric boundary and the driving plane was set as a free boundary, and the other surfaces were set as non-reflective boundaries. The fluid-structure coupling algorithm was used in the calculation. An 8-node solid element named SOLID164 was used to divide the material into the Lagrangian mesh, and the unit of calculation was cm-g-μs. According to Blair (1985) [22], 6-12 elements per wavelength were required to avoid any wave distortion, and the size of the model grid was set to vary from 5 to 10 cm. Surrounding rock adopted the MAT_PLASTIC_KINEMATIC material model, which considered the elastoplastic properties of rock medium materials and was able to describe the hardening effect (follow-up hardening and isotropic hardening) and the strain rate change effect of the material. Isotropic or follow-up hardening was selected by adjusting the hardening parameter between 0 (follow-up hardening only) and 1 (isotropic hardening only). The strain rate is considered by the Cowper-Symonds model, and the yield stress is expressed by the factors related to the strain rate:
where: is the initial yield stress; is the strain rate; and are the Cowper-Symonds strain rate parameter, which is determined by the material strain rate. is the plastic hardening modulus; is the shear modulus; is the hardening parameter, ; is the effective plastic strain. The physical and mechanical parameters of the surrounding rock are shown in Table 2.
Fig. 2Triangle blast load for numerical simulation
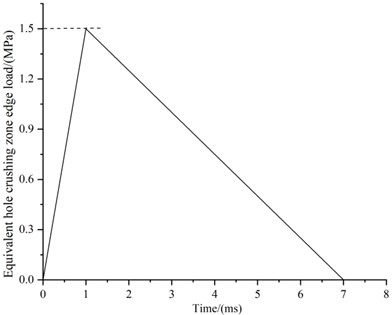
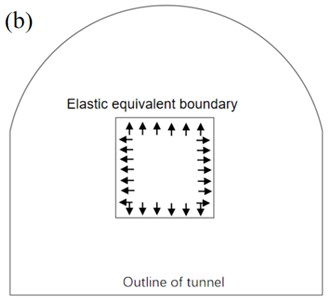
Fig. 3Schematic diagram of the numerical model: a) overall model; b) elastic equivalent boundary
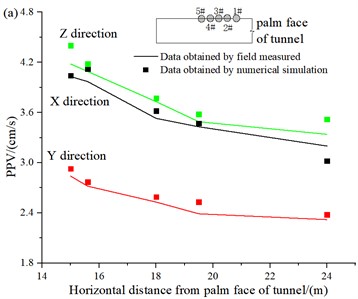
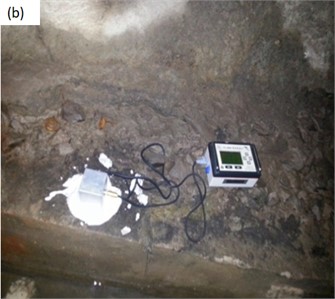
Five monitoring points were selected in front of the actual tunnel palm face in the field and their PPV was compared with the PPV obtained within the numerical model, and the test results are shown in Table 3 and Fig. 4, in which the monitoring photos in Fig. 4(b) were taken by the author inside the blast tunnel at Yuxi Township. From Fig. 4, it can be concluded that the changing trend of numerical simulation and field measurement is similar, and the error difference is not large, the maximum error rate does not exceed 6 %, so the model obtained from numerical simulation can be used as a study of blasting damage effect in this paper.
Table 2The physical and mechanical parameters of rock
Density / (g/cm3) | Poisson’s ratio | Modulus of elasticity / GPa | Yield strength / MPa | Shear modulus / GPa |
2.70 | 0.2 | 45 | 100 | 18 |
Table 3Comparison of field-measured data and numerical simulation
Number of points | Distance from the burst center / (m) | direction / (cm/s) | Error / % | direction / (cm/s) | Error / % | direction / (cm/s) | Error / % | |||
Field test | Numerical simulation | Field test | Numerical simulation | Field test | Numerical simulation | |||||
1# | 15.00 | 4.03 | 4.04 | –0.37 | 2.84 | 2.93 | –3.17 | 4.18 | 4.40 | –5.39 |
2# | 15.60 | 3.97 | 4.12 | –3.78 | 2.72 | 2.77 | –1.65 | 4.09 | 4.18 | –2.20 |
3# | 18.00 | 3.53 | 3.62 | –2.55 | 2.53 | 2.59 | –2.38 | 3.73 | 3.77 | –1.21 |
4# | 19.50 | 3.43 | 3.47 | –1.31 | 2.39 | 2.53 | –5.65 | 3.49 | 3.58 | –2.58 |
5# | 24.00 | 3.20 | 3.02 | 5.63 | 2.32 | 2.38 | –2.59 | 3.34 | 3.52 | –5.40 |
Fig. 4Comparison of measured and numerical simulation of vibration velocity: a) PPV; b) test setup
4. Analysis of numerical simulation data and field measurement data
4.1. Changes of PPV at different locations of tunnel excavation section
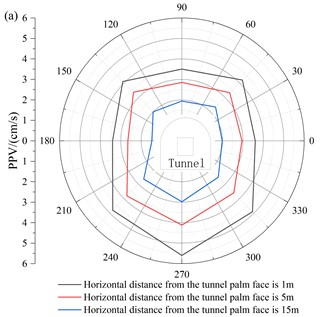
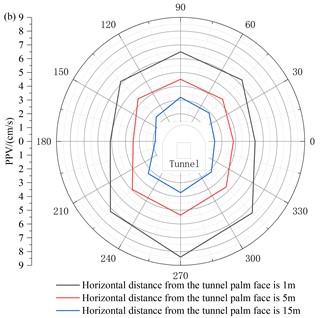
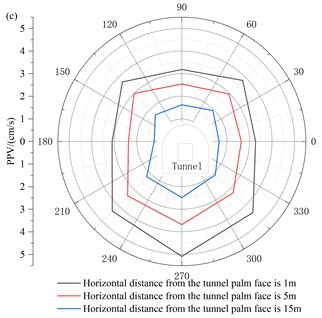
The seismic waves generated by blasting propagate from far and near, and gradually transform from body waves to surface waves. To understand the PPV changes of the tunnel caused by blasting seismic waves at different tunnel sections, the PPV distribution patterns of tunnel profiles at distances of 1 m, 5 m, and 15 m from the chapter surface were selected, as shown in Fig. 5.
As can be seen from the propagation law of rock mass in the direction of the tunnel in Fig. 5(a), the PPV of surrounding rock is small at the top and spandrel of the tunnel, while that of surrounding rock at the bottom and bottom of the tunnel is large. This is because the structure of the tunnel is an oval structure, which is easy to appear stresses concentration at the arch foot of the tunnel, resulting in excessive stress at the arch foot. According to the stress wave theory, the vibration velocity peak at the foot of the tunnel arch is larger, because the stress at the foot of the arch is larger, which leads to a larger wave impedance. At the same time, due to the high ground stress in the bottom slab, blasting excavation leads to the redistribution of the overall stress in the tunnel, and unloading and rebound occur simultaneously. Meanwhile, the stress wave propagation is amplified to some extent, so the PPV of the surrounding rock is larger.
From Fig. 5(b), it can be seen that the PPV of the tunnel floor and tunnel sidewalls is larger, the PPV of the tunnel top is the second largest, and the PPV of the tunnel shoulder and arch foot is the smallest, which indicates that in the vertical direction of the tunnel, the excavation of the trenching area of the tunnel has led to the emergence of a critical surface in the tunnel, providing conditions for further deformation of the tunnel. Meanwhile, the vertical vibration in the tunnel corresponds to the transverse waves in tunnel blasting seismic waves, i.e., SH and SV waves, and the transverse waves are highly reflective and refractive at the interface between the free surface and the rock bulkhead, resulting in higher vibration velocities in the vertical direction at the top, side walls and floor of the tunnel near the tunnel blasting area. However, the PPV caused by the stress wave is smaller at the arch foot and arch shoulder due to the existence of the stress concentration phenomenon and special part structure.
Fig. 5Distribution of peak vibration velocity in tunnel excavation section: a) X direction; b) Y direction; c) Z direction
4.2. Stress distribution of tunnel excavation section
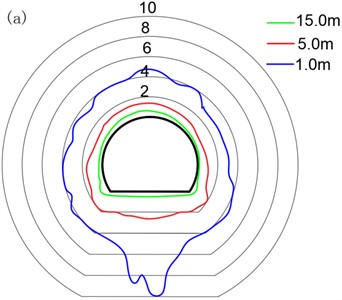
The maximum shear stress and maximum tensile stress distribution of the tunnel surrounding the rock contour surface at 1 m, 5 m, and 15 m behind the tunnel face are shown in Fig. 6.
By careful observation of Fig. 6, it can be concluded that with the increase of distance from the tunnel face, the distribution of shear stress along the tunnel excavation section tends to be uniform, and the maximum shear stress always appears in the middle of the floor, which is caused by the larger vibration velocity of the tunnel floor under the effect of blasting vibration. The maximum shear stress of the surrounding rock behind the working face appears in the middle of the bottom slab, which is 9.8 MPa and does not exceed its ultimate damage strength. Therefore, the shear-induced damage of the surrounding rock is not considered in this paper.
Fig. 6Distribution of the maximum shear stress and the maximum tensile stress (Unit: MPa): a) Maximum shear stress, b) maximum tensile stress
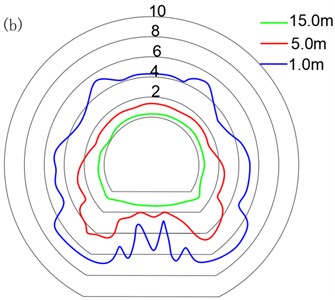
For purpose of analyzing the relationship between PPV and stress in the tunnel excavation section, the PPV and stress locations at 1 m, 5 m, and 15 m after the working face is listed in Table 4 according to the numerical simulation results. As can be seen from Table 4, the maximum value of PPV and the maximum value of shear stress are in the same position under the effect of tunnel blasting, both appearing in the middle of the bottom plate, while the maximum value of tensile stress first appears at the bottom of the bottom plate, and then shifts to the middle of the bottom plate. The results show that: There is a correspondence between the maximum value of PPV and the maximum value of shear stress during tunnel blasting, and the maximum value of PPV and the maximum value of tensile stress are not always in one-to-one correspondence, and the correspondence exists only after a certain distance from the earthquake source.
Table 4Positions of the maximum peak vibration and the maximum stress
Horizontal distance to face of the palm / m | PPV | Shear stress | Tensile stress |
1 | Middle of the tunnel floor | Middle of the tunnel floor | Arch foot of the tunnel |
5 | Middle of the tunnel floor | Middle of the tunnel floor | Arch foot of the tunnel |
15 | Middle of the tunnel floor | Middle of the tunnel floor | Middle of the tunnel floor |
4.3. Blast damage effect study
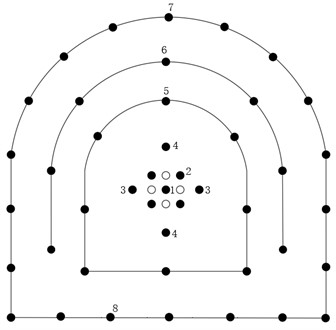
To further study the damaging effect of the rock body at different locations in the deep part of the rock body, the field combined with an acoustic testing system to study the damage law of the rock body at different locations from the tunnel chapter face. Therefore, different locations near the foot of the arch at 5 m, 10 m, 15 m, and 30 m from the palm face were selected for study and analysis, and three measurements were taken after the blasting times of 0, 5, and 10 times respectively, and the average value was taken. And according to the principle of sound velocity reduction before and after blasting, to determine the displacement damage depth of the tunnel, the measurement point layout schematic diagram is shown in Fig. 7, in which the monitoring photos in Fig. 7(a) were taken by the author inside the blast tunnel at Yuxi Township. To ensure the validity of the acoustic velocity test results, three times were tested for each monitoring, and the average value was taken each time. The acoustic test results before and after each blast at different locations in the tunnel from the palm face are shown in Fig. 8. The relationship between the number of statistical blasts and the depth of damage is shown in Table 4.
Fig. 7Schematic diagram of measurement point arrangement (unit: cm): a) acoustic test hole; b) hole depth direction of acoustic test hole
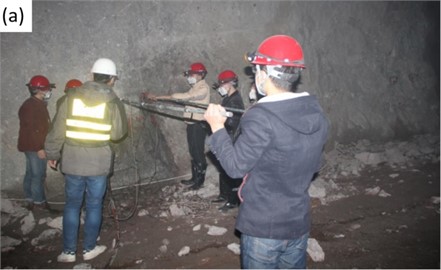
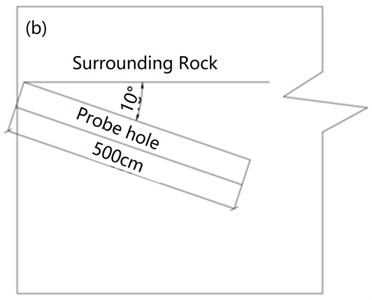
Fig. 8Plot of acoustic velocity-hole depth: a) distance from palm surface is 5 m; b) distance from palm surface is 10 m; c) distance from palm surface is 15 m; d) distance from palm surface is 30 m
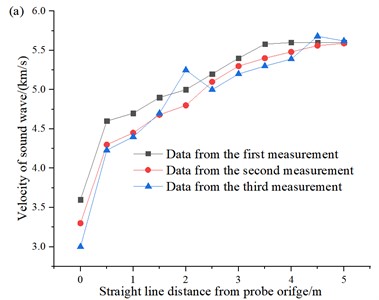
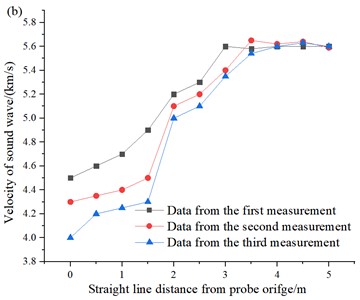
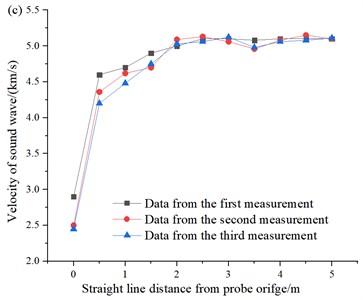
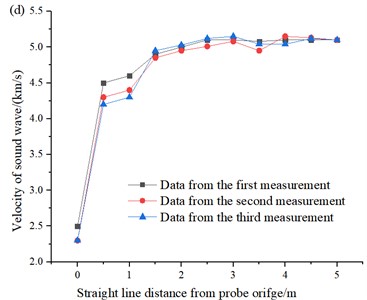
(1) It is easy to see from Fig. 8, with the gradual increase in the horizontal distance from the palm surface, the sound velocity of the rock around the body gradually decreases, and with the increase in the number of blasting, the sound velocity tends to gradually decay and stabilize after reaching a certain level.
(2) As the horizontal distance from the detection orifice gradually increases, the rock acoustic tunneling gradually increases, indicating that there is a certain range of damage to the surrounding rock by blasting vibration, and at different distances from the tunnel palm face, the trend of change in the deeper part of the tunnel surrounding rock is exponential change pattern, and at a distance of 5m from the palm face, the tunnel surrounding rock damage is more serious.
Table 5Relationship between the number of blasting and the depth of damage to the surrounding rock
The horizontal distance from the palm face of the tunnel / m | Number of blasts (monitoring times) | ||
0(1) | 5(3) | 10(5) | |
5 | 3 | 3.5 | 4 |
10 | 3 | 3.5 | 4 |
15 | 2 | 2.5 | 3 |
30 | 1.5 | 2 | 2.5 |
5. Discussion
1) It is easy to see from Fig. 5 that in the tunnel blasting near the area, the PPV in the tunnel is greater vertically than in the tunnel radial direction than in the tunnel axial direction (), which indicates that the vertical vibration near the palm surface area is the main propagation direction of vibration, which is due to the large burial depth of the tunnel and the better level of the tunnel surrounding rock. With the detonation of the tunnel trenching area, the seismic waves generated by tunnel blasting mainly include body waves and surface waves, due to the existence of the free surface of the tunnel axial and tunnel radial, so there is a certain degree of attenuation, resulting in a large PPV in the vertical direction of the tunnel. At the same time, as the distance from the palm surface increases, the PPV in the tunnel gradually decreases, and the direction is the most serious attenuation. However, the -direction is the second and the -direction is the smallest, indicating that the decay of the mass velocity in the tunnel is mainly in the -direction as the distance from the tunnel palm increases.
2) It is easy to see from Fig. 6 that due to the stress concentration effect, the maximum tensile stress of tunnel blasting vibration appears at the position of the rear foot next to the face, which is 7.35 MPa. The tensile strength of the tunnel surrounding rock is 6-10 MPa, and the maximum tensile stress of the surrounding rock may exceed the ultimate tensile strength. Therefore, in the process of tunnel excavation, the vicinity of tunnel foot is considered as the key position to determine the damage to tunnel surrounding rock. With the increase of the distance from the tunnel face, the maximum tensile stress gradually transfers from the tunnel foot to the middle of the tunnel floor.
3) The relationship between the number of blasting and the depth of damage to the surrounding rock can be seen in Table 5, with the increase in the horizontal distance from the roadway palm surface, the depth of damage to the surrounding rock gradually increases. And the change is not significant when the number of blasting is small, but with the increase of the number of blasting, the difference between the two gradually increases, such as when the number of blasting is 1, the depth of damage at different distances is 1.5 m and 3.0 m, while when the number of blasting is 10 with the number of blasts was 10, the damage depth of the surrounding rock increased from 2.5 m to 4.0 m, indicating that repeated blasting vibrations have a major impact on the integrity of the tunnel surrounding rock, but the impact range is effective.
6. Conclusions
1) In the area near the palm face of the tunnel, the PPV in the vertical direction of the tunnel is greater than the PPV in the radial direction of the tunnel than the PPV in the axial direction of the tunnel. And as the distance from the palm surface increases, the tunnel attenuation in the direction is the most serious, the second in the direction, and the smallest in the direction. The vibration velocity in the direction in the tunnel is greater at the foot and floor of the tunnel PPV, while in the direction of the tunnel mass, the PPV of the tunnel floor and tunnel sidewall is greater.
2) Under the action of blasting vibration, the maximum value of PPV corresponds to the maximum value of shear stress, where the bottom of and the arch of the tunnel are easily damaged, so attention should be paid to the monitoring of blasting vibration and stress in this area.
3) The sound velocity of the rock body gradually increases with the increase of the horizontal distance from the detection hole, while the sound velocity of the internal rock body gradually decreases with the increase of the horizontal distance from the palm surface, although the blasting vibration has some damage to the surrounding rock, the damage caused by blasting to the tunnel surrounding rock is limited.
References
-
Y. Yang, H. Lu, X. Tan, H. K. Chai, R. Wang, and Y. Zhang, “Fundamental mode shape estimation and element stiffness evaluation of girder bridges by using passing tractor-trailers,” Mechanical Systems and Signal Processing, Vol. 169, p. 108746, Apr. 2022, https://doi.org/10.1016/j.ymssp.2021.108746
-
Y. Li, H. Wang, W. Cai, S. Li, and Q. Zhang, “Stability monitoring of surrounding rock mass on a forked tunnel using both strain gauges and FBG sensors,” Measurement, Vol. 153, p. 107449, Mar. 2020, https://doi.org/10.1016/j.measurement.2019.107449
-
G.-H. Zhang, W. Chen, Y.-Y. Jiao, H. Wang, and C.-T. Wang, “A failure probability evaluation method for collapse of drill-and-blast tunnels based on multistate fuzzy Bayesian network,” Engineering Geology, Vol. 276, p. 105752, Oct. 2020, https://doi.org/10.1016/j.enggeo.2020.105752
-
G. Yang, G. Wang, Y. Fan, K. Deng, W. Lu, and J. Zhao, “Dynamic response and performance of submarine tunnel subjected to surface explosions,” Marine Structures, Vol. 80, p. 103091, Nov. 2021, https://doi.org/10.1016/j.marstruc.2021.103091
-
Q. Zhou et al., “Evaluation of blast-resistant ability of shallow-buried reinforced concrete urban utility tunnel,” Engineering Failure Analysis, Vol. 119, p. 105003, Jan. 2021, https://doi.org/10.1016/j.engfailanal.2020.105003
-
Y. Yang, Y. Ling, X. K. Tan, S. Wang, and R. Q. Wang, “Damage identification of frame structure based on approximate Metropolis-Hastings algorithm and probability density evolution method,” International Journal of Structural Stability and Dynamics, Vol. 22, No. 3n04, p. 22400, Mar. 2022, https://doi.org/10.1142/s0219455422400144
-
X. Zhang, H. Guo, L. Ye, and D. Tang, “Study on the evaluation of surrounding rock stability and limit displacement of high-pressure stratum tunnel,” in IOP Conference Series: Earth and Environmental Science, Vol. 643, No. 1, p. 012055, Jan. 2021, https://doi.org/10.1088/1755-1315/643/1/012055
-
M. Fahiminia and A. Shishegaran, “Evaluation of a developed bypass viscous damper performance,” Frontiers of Structural and Civil Engineering, Vol. 14, No. 3, pp. 773–791, Jun. 2020, https://doi.org/10.1007/s11709-020-0627-2
-
J. Zhu, H. Zhang, Z. Wang, S. Yang, and Z. Ding, “Physico-mechanical properties of thick paleosol in Q1 strata of the Chinese Loess Plateau and their variations during tunnel excavation,” Engineering Geology, Vol. 295, p. 106426, Dec. 2021, https://doi.org/10.1016/j.enggeo.2021.106426
-
S. Cardoso, R. Ferreira, P. P. Freitas, P. Wei, and J. C. Soares, “Influence of Ta antidiffusion barriers on the thermal stability of tunnel junctions,” Applied Physics Letters, Vol. 76, No. 25, pp. 3792–3794, Jun. 2000, https://doi.org/10.1063/1.126783
-
Y. Yuan, Z. Huang, H. Wu, and X. Wang, “Specific emitter identification based on Hilbert-Huang transform‐based time-frequency-energy distribution features,” IET Communications, Vol. 8, No. 13, pp. 2404–2412, Sep. 2014, https://doi.org/10.1049/iet-com.2013.0865
-
S. Conta, A. Santoni, and A. Homb, “Benchmarking the vibration velocity-based measurement methods to determine the radiated sound power from floor elements under impact excitation,” Applied Acoustics, Vol. 169, p. 107457, Dec. 2020, https://doi.org/10.1016/j.apacoust.2020.107457
-
A. Shishegaran, M. R. Ghasemi, and H. Varaee, “Performance of a novel bent-up bars system not interacting with concrete,” Frontiers of Structural and Civil Engineering, Vol. 13, No. 6, pp. 1301–1315, Dec. 2019, https://doi.org/10.1007/s11709-019-0552-4
-
A. Shishegaran, B. Karami, T. Rabczuk, A. Shishegaran, M. A. Naghsh, and M. Mohammad Khani, “Performance of fixed beam without interacting bars,” Frontiers of Structural and Civil Engineering, Vol. 14, No. 5, pp. 1180–1195, Oct. 2020, https://doi.org/10.1007/s11709-020-0661-0
-
A. Shishegaran, M. R. Khalili, B. Karami, T. Rabczuk, and A. Shishegaran, “Computational predictions for estimating the maximum deflection of reinforced concrete panels subjected to the blast load,” (in Chinese), International Journal of Impact Engineering, Vol. 139, p. 103527, May 2020, https://doi.org/10.1016/j.ijimpeng.2020.103527
-
A. Shishegaran, H. Varaee, T. Rabczuk, and G. Shishegaran, “High correlated variables creator machine: Prediction of the compressive strength of concrete,” Computers and Structures, Vol. 247, p. 106479, Apr. 2021, https://doi.org/10.1016/j.compstruc.2021.106479
-
C. Shi, Q. Zhao, M. Lei, and M. Peng, “Vibration velocity control standard of buried pipeline under blast loading of adjacent tunnel,” Soils and Foundations, Vol. 59, No. 6, pp. 2195–2205, Dec. 2019, https://doi.org/10.1016/j.sandf.2019.12.003
-
E. Clouet, B. Bienvenu, L. Dezerald, and D. Rodney, “Screw dislocations in BCC transition metals: from ab initio modeling to yield criterion,” Comptes Rendus. Physique, Vol. 22, No. S3, pp. 83–116, Dec. 2021, https://doi.org/10.5802/crphys.75
-
X. Yang, A. Jiang, and F. Zhang, “Research on creep characteristics and variable parameter-based creep damage constitutive model of gneiss subjected to freeze-thaw cycles,” Environmental Earth Sciences, Vol. 80, No. 1, pp. 1–16, Jan. 2021, https://doi.org/10.1007/s12665-020-09311-w
-
J. Diaz-Alban and N. Masmoudi, “Asymptotic analysis of acoustic waves in a porous medium: microincompressible flow,” Communications in Partial Differential Equations, Vol. 39, No. 11, pp. 2125–2167, Nov. 2014, https://doi.org/10.1080/03605302.2014.926371
-
M. Y. Bogolyubsky, V. I. Manko, L. Musa, S. A. Sadovsky, B. Skaali, and Y. G. Sibiryak, “Time and amplitude reconstruction from sampling measurements of the PHOS signal profile in the ALICE project,” (in Chinese), Nuclear Instruments and Methods in Physics Research Section A: Accelerators, Spectrometers, Detectors and Associated Equipment, Vol. 621, No. 1-3, pp. 231–237, Sep. 2010, https://doi.org/10.1016/j.nima.2010.06.094
-
D. P. Blair, “Acoustic pulse transmission in half‐spaces and finite‐length cylindrical rods,” Geophysics, Vol. 50, No. 11, pp. 1676–1683, Nov. 1985, https://doi.org/10.1190/1.1441858
About this article

This research was funded by the National Natural Science Foundation of China (NSFC, Grant No. 41972286, Grant No. 41807265).
The datasets generated during and/or analyzed during the current study are available from the corresponding author on reasonable request.
The authors declare that they have no conflict of interest.
