Abstract
Seismic liquefaction affects badly the safety of the underground structures. For the dynamic responses of the tunnel in liquefied watered sandy stratum in one of the rail transit projects in Shanghai, this paper proposes a tunnel-foundation shaking table model test and analyses the dynamic responses of electrolytic desaturation technology on surrounding soil, which provides some theoretical guidance for seismic designs of Shanghai rail transit projects. The test result shows that the excess pore pressure ratio of soil decreases gradually with the increase of buried depth; sand is easier to liquefy than silt so the tunnel liquefaction and uplift during the sandy section should be paid more attention to; electrolytic desaturation technology works significantly on improving the liquefaction resistance abilities of sand and silt which can effectively reduce the damage caused by tunnel uplift due to seismic liquefaction.
1. Introduction
With the continuous development and growth of municipal transportation industry in major cities in China, one of the important pillars, the construction process of urban metro rail transportation, is facing many challenges currently. And among them, the liquefiable stratum, which is prone to produce devastating effects under seismic loads, has become a major problem that cannot be avoided in the construction process of many inter-district tunnels and subway stations [1-3]. Shake table test, as a common simulation method for the seismic response characteristics and damage mechanisms of underground structures in liquefiable sites, has been widely used in related tests by scholar’s world widely.
S. C. Chian and S. P. G. Madabhushi [4] conducted a series of shaking table tests on liquefiable sandy soil sites for the correlations between the buried depth, size of the underground structure and the uplift displacement generated by the structure body. It showed that the buried depth directly affected its corresponding anti-uplift capacity, and the larger the size of the structure is, the larger the uplift displacement is. Guoxing Chen, et al. [5] proposed a series of shaking table test models of metro stations and interval tunnels based on different site environment conditions in Nanjing metro lines, and concluded different seismic response mechanisms and damage characteristics of subway underground structures with liquefied sand and clay layers. To make clear the damage process and causes of underground structures under dynamic loads, Junhai An, et al. [6] carried out a shaking table model test of shield expansion subway station structure in liquefiable stratum, and the results showed that the liquefiable test model foundation shocked, vibrated and then uplifted under dynamic loads.
But these tests are on non-liquefied soil layer. Relatively few studies take the tunnel structure uplift under the condition of liquefiable soil layer into consideration. Therefore, to investigate the dynamic response law and mechanism of the tunnel structure and soil body under dynamic loads, with the help of laminar flexible model shear box, this paper establishes a tunnel-foundation shaking table model under liquefied watered sandy stratum, and monitors the vibration waves, excess pore pressure development and tunnel uplift displacement of the foundation by acceleration sensor and pore pressure sensor and displacement sensor, respectively based on a project of Shanghai rail transit.
2. Shaking table test design
Shaking table test system mainly consists of small shaking table, laminar flexible shear box and test acquisition system as shown in Fig. 1. This image was taken on April 25,2022 at the shaking table laboratory of College of Civil and Transportation Engineering, Hohai University.
Fig. 1Shaking table test system
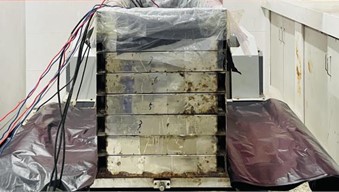
a) Vibrating table and laminar shear box
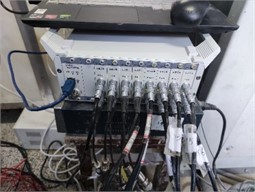
b) Acquisition system
The test soil is collected from the construction site of a tunnel project of Shanghai rail transit, dried and barreled in an oven. According to the geotechnical test operation specification, the basic physical properties of sand and silt are obtained, as shown in Table 1.
Table 1Basic physical properties of test soil
Soil sample | Liquid limit ωL / % | Plastic limit ωP / % | Plasticity index IP | Maximum dry density ρdmax/g·cm-3 | Optimum water content Ωopt / % |
Sand | 26.5 | 16.8 | 9.7 | 1.67 | 15.6 |
Slit | – | – | – | 1.6 |
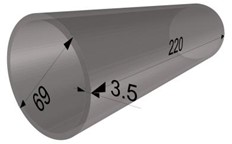
We use 3D printing for the tunnel section model in the shaking table test, select the resin with elastic modulus of 1 GPa, Poisson’s ratio of 0.38 and density of 1.3 g/cm3. The model shape refers to the underground straight section tunnel profile in the actual engineering site, as shown in Fig. 2.
Fig. 2Tunnel model (unit: cm)
The shaking table model test layout is shown in Fig. 3, with the vibration direction perpendicular to the tunnel model trend, and the specific working conditions of each shaking table tests are shown in Table 2.
Table 2Design of working conditions
No. | Shaking table test condition |
T1 | Shaking table test of interaction between sand foundation and tunnel |
T2 | Shaking table test of interaction between slit foundation and tunnel |
T3 | Shaking table test after electrolytic treatment of interaction between sand foundation and tunnel |
T4 | Shaking table test after electrolytic treatment of interaction between slit foundation and tunnel |
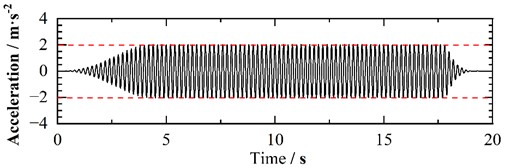
We choose standing sine wave as the external dynamic load, which is applied to the shaking table with a vibration time of 20 s, maximum acceleration of 0.2 g and vibration frequency of 5 Hz for the proposed shaking table test. The measured acceleration curve of the shaker table output is shown in Fig. 4.
Fig. 3Layout plan of shaking table test model (unit: cm)
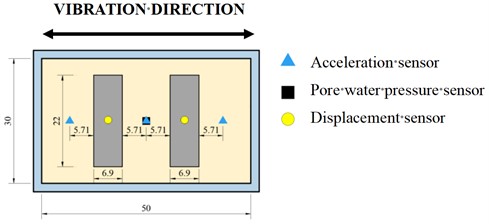
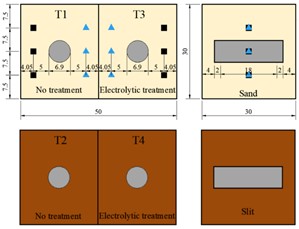
Fig. 4Measured acceleration curve of shaking table output
3. Results and analysis
3.1. Excess pore pressure ratio response analysis
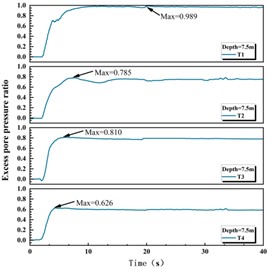
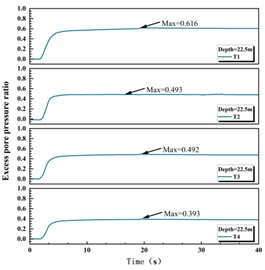
The data from the pore pressure sensors at different buried depths in the four working conditions are processed and then the excess pore pressure ratio time curves are obtained as shown in Fig. 5 which shows that with the increase of the ground vibration amplitude, the excess pore water pressures in the soils all increase rapidly and remains the same after peaks; due to the input seismic sine wave, the dissipation of excess pore water pressures is slow, and since the test recording time is limited, there is no obvious pore water pressure dissipation, and the excess pore pressure ratios all decrease gradually with the increase of the buried depth, in line with the research results by Chunxia Huang, et al. [7].
Fig. 5Time curve of excess pore pressure ratio
a) Depth = 7.5 cm
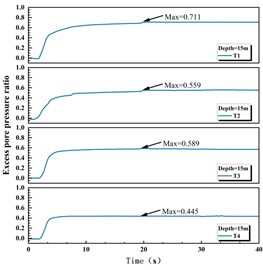
b) Depth = 15 cm
b) Depth = 22.5 cm
The peak of the soil excess pore pressure ratio at the buried depth of 7.5 m in T1 working condition is close to 1.0, indicating that the sand has basically been completely liquefied and the liquefaction lasts for a long time. The buried depths of T2 and T3 working conditions is 7.5 m and the peak value of excess pore pressure ratio is close to 0.8 with slight liquefaction. The peak value of excess pore pressure ratio of other measurement points is lower than 0.75, indicating that no liquefaction occurs. The peak excess pore pressure ratio is reduced by about 20 % for sand foundation and about 22 % for slit foundation after electrolysis, which overall reflects that electrolysis has a suppressive effect on the excess pore water stress generated during the foundation liquefaction, in line with the similar phenomenon found by Yumin Chen, et al. [8] (2016).
3.2. Uplift displacement analysis
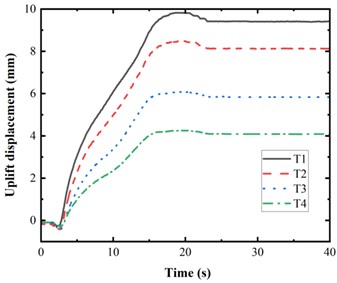
The time curve of the tunnel model uplift displacement is shown in Fig. 6. It can be seen that: 2 s after the vibration starts, the tunnel uplift displacement changes significantly with an afterwards short descending phenomenon lasting for about 1.5 s, and a descending displacement of about 0.5 mm. Compared to the above acceleration and excess pore pressure ratio response curves, we find that the pore pressure accumulation and shear strength attenuation are just beginning. The reason for this short descending phenomenon “depression” is that the soil mass at the lower layer of the tunnel model goes through phase change at the beginning of liquefaction. That is, the soil mass suddenly changes from solid to liquid, and the bearing capacity of the soil mass is lost, and the buoyancy in the soil is not yet generated or very small, resulting in a sudden settlement of the tunnel. At the vibration time 3.5 s, the model tunnel starts to uplift, and after the vibration, the uplift displacement reaches the peak and then remains stable. The final uplift amounts produced by the tunnel model for T1, T2, T3 and T4 working conditions are 9.4 mm, 8.1 mm, 5.8 mm and 4.1 mm respectively. The amount of uplift is reduced by 38 % after electrolysis in sand foundation and 49 % in slit foundation. Comparing the results of tunnel uplift in different working conditions, it can be found that electrolytic desaturation has a certain inhibitory effect on tunnel uplift in both sand and slit.
Fig. 6Time curve of uplift displacement
3.3. Effect of electrolytic desaturation on anti-liquefaction capacity
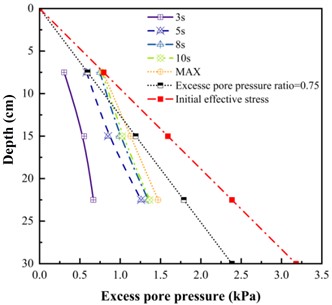
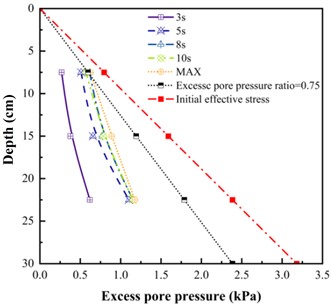
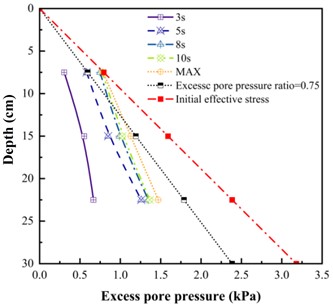
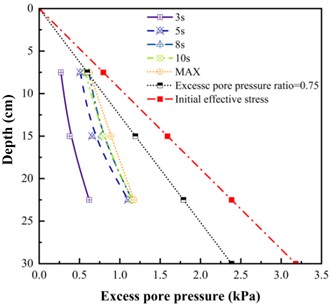
We compare the test results of T1 and T3, T2 and T4 at 0.20 g sine wave input and obtain the effect of electrolytic desaturation on the liquefaction resistance of saturated sand and slit under the same other conditions. Fig. 7 shows the time curves of the excess pore pressures in the whole soil layer for different working conditions. And from Fig. 11, compared with T1 and T3, the values of excess pore pressure at the corresponding positions in T2 and T4 at the same moment are much smaller, and the excess pore pressure approaches its peak more quickly to the latter two conditions. As defined, the excess pressure ratio greater than 0.75 (Troncoso et al. 1993 [9]) is liquefaction. And from our test, it can be found that the depth of the liquefied soil layer is significantly reduced in sand and slit after electrolytic treatment. Although the sand and slit in the test has not prevented the occurrence of liquefaction in the surface layer due to the electrolytic desaturation, the resistance abilities to liquefaction of sand and slit soils by electrolysis are significantly improved compared to the natural foundations.
Fig. 7Time curve of excess pore pressure
a) T1
b) T2
c) T3
d) T4
4. Conclusions
In this paper, based on the shield tunnel dynamic response shaking table test under liquefiable site conditions, the acceleration and pore water pressure of the foundation soil are monitored, and after the comparison of the monitoring results of different working conditions and the test macroscopic phenomena, the following conclusions can be obtained:
1) Saturated loose sand foundations are easy to be liquefied under seismic loads, the acceleration amplitude is significantly decreased, and there is an obvious seismic effect of liquefied foundation, the pore water pressure at each buried depth of soil rises rapidly with the increase of acceleration peak, and the peak of super pore pressure ratio gradually decreases with the increase of buried depth.
2) Under the action of earthquake, the liquefaction of soil generates uplift force and then causes tunnel uplift. Sand foundation is easier to be liquefied than slit foundation. Therefore, more attention should be paid to tunnel liquefaction uplift in sand section in the seismic design of Shanghai rail transit projects for the structural safety of tunnels.
3) Electrolytic desaturation treatment for sand and slit foundations can effectively reduce the peak excess pore pressure ratio, improve the liquefaction resistance of sand and slit, reduce tunnel uplift due to seismic liquefaction, and finally improve the seismic safety performance of shield tunnels.
References
-
T. Zhu, R. Wang, and J. Zhang, “Seismic response analysis of shield tunnels in liquefiable soils,” Chinese Journal of Geotechnical Engineering, Vol. 41, pp. 57–60, 2019, https://doi.org/10.11779/cjge2019s1015
-
J. Zhou, W. Wu, and R. Hu, “Research on the seismic responses for shield tunnel in liquefiable soil,” Journal of Railway Engineering Society, Vol. 34, No. 12, pp. 83–88, 2017.
-
M. Tajimi, “Damage done by the great earthquake disaster of the Hanshin-Awaji district to the Kobe municipal subway system and restoration works of the damage,” Japan Railway Journal, Vol. 137, pp. 19–23, 1996.
-
S. C. Chian and S. P. G. Madabhushi, “Effect of buried depth and diameter on uplift of underground structures in liquefied soils,” Soil Dynamics and Earthquake Engineering, Vol. 41, pp. 181–190, Oct. 2012, https://doi.org/10.1016/j.soildyn.2012.05.020
-
G. Chen et al., “Shaking table model test of subway station structure under far field and near field ground motion,” Journal of Zhejiang University (Engineering Science), Vol. 44, No. 10, pp. 1955–1961, 2010, https://doi.org/10.3785/j.issn.1008-973x.2010.10.019
-
An Junhai et al., “Shaking table experiments on seismic response of a shield-enlarge dig type subway station structure in liquefiable ground,” Chinese Journal of Rock Mechanics and Engineering, Vol. 36, No. 8, pp. 2018–2030, 2017, https://doi.org/10.13722/j.cnki.jrme.2016.1630
-
Huang Chunxia et al., “Shaking table tests on liquefaction properties of saturated sand ground,” Chinese Journal of Geotechnical Engineering, Vol. 2006, No. 12, pp. 2098–2103, 2006.
-
Chen Yumin et al., “Model tests on liquefaction resistance of desaturation measures of electrolysis,” Chinese Journal of Geotechnical Engineering, Vol. 38, No. 4, pp. 726–733, 2016, https://doi.org/10.11779/cjge201604018
-
Troncoso, J. H., Vergara, A., Avendaño, and A., “Seismic failure of Barahona tailings dam,” in 3rd Conference of the International Conference on Case Histories in Geotechnical, 1993.
About this article

The study is supported by National Natural Science Foundation of China (NSFC) 51379067, 51679072, and Key International/Regional Cooperative Research Project of NSFC 51420105013.
The datasets generated during and/or analyzed during the current study are available from the corresponding author on reasonable request.
The authors declare that they have no conflict of interest.
