Abstract
To study the dynamic response law of large-section cracked lining structures under seismic waves, comparative tests of large-scale shaker tunnel models of non-destructive lining structure (model 1), a crack in the vault of the lining structure (model 2), and two parallel cracks in the vault of the lining structure (model 3) were carried out by applying 0.1-1.0 g progressively increasing the peak acceleration of the input waves. This paper visually showed the distribution of cracks in three groups of the lining structures. In addition, the acceleration response of the lining and surrounding rock, dynamic soil pressure, the dynamic strain on the inner and outer surfaces of the lining, and dynamic internal force variation were obtained, and the seismic performance of three groups of lining structures was discussed. The results showed that the seismic weak positions of model 1 were the arch shoulder and the arch foot, the seismic weak positions of model 2 were the arch shoulder, the arch foot, the initial damage area, and the inverted arch, and the seismic weak positions of model 3 were the positions of the arch foot, the cracks of the vault, the inverted arch, and the arch wall. The soil pressure values at the vault of three groups of models were model 2 > model 1 > model 3 in turn. The surrounding rock amplified the input seismic waves. With the gradual increase of the peak acceleration, the seismic energy was gradually consumed due to plastic damage to the lining structure or the loosening and destruction of the overlying soil, resulting in the acceleration amplification coefficient value of the surrounding rock in the upper part of the lining structure showing a changing trend of first increasing and then decreasing. When the peak acceleration was 0.2 g, the crack propagation phenomenon occurs in the initial crack position of model 2 and model 3. When the peak acceleration was 0.4 g, the cracking phenomenon occurs at the right arch foot of model 1. The above phenomenon confirmed the conclusion that cracks can weaken the seismic performance of the structure. When the peak acceleration was 0.8 g, the peak values of the amplification coefficient of the lining at the inverted arch and near the filled soil surface were about 1.2 and 1.6 respectively. The research results can provide a reference for the seismic performance evaluation of cracked tunnels.
Highlights
- To study the dynamic response law of large-section cracked lining structures under seismic waves, comparative tests of large-scale shaker tunnel models of non-destructive lining structure (model 1), a crack in the vault of the lining structure (model 2), and two parallel cracks in the vault of the lining structure (model 3) were carried out by applying 0.1-1.0g progressively increasing the peak acceleration of the input waves.
- This paper visually showed the distribution of cracks in three groups of the lining structures.
- The acceleration response of the lining and surrounding rock, dynamic soil pressure, the dynamic strain on the inner and outer surfaces of the lining, and dynamic internal force variation were obtained, and the seismic performance of three groups of lining structures was discussed.
1. Introduction
With the increase in tunnel service time, a large number of tunnel linings have many diseases, such as structural cracking, leakage, back cavity, etc. [1]. Among them, the cracking of the lining is the most serious, and its structural integrity and the bearing capacity of the concrete section are significantly affected because the crack tip is unstable and leads to fracture failure. In addition, as one of the countries with frequent earthquakes and the most serious earthquake disasters, China’s underground structure in the strong earthquake area has been repeatedly damaged, which directly affects the normal operation of vehicles and the safety of people's lives, causing huge losses to the national economy. Therefore, the seismic performance of cracked lining structures has become a research hotspot.
In recent years, the Wenchuan earthquake and the Ya’an earthquake have caused serious damage to the underground structure [2], [3], which has aroused the extensive attention of scholars on the underground structure. In the study of the dynamic response characteristics of the tunnel, it is found that the elliptical deformation caused by the earthquake has the greatest influence on the tunnel lining. The lining section usually shows alternating tension and compression deformation in the diagonal direction, which can easily lead to tensile and shear cracks in the lining structure, and the cracks extend along the longitudinal direction [4], [5]. The relevant literature points out that the seismic damage degree of the underground structure is related to the peak ground acceleration, especially when the tunnel passes through the active ground fissures or the tunnel with initial damage, the dynamic response of the structure is more intense, which is likely to accelerate the damage and failure of the lining structure [6]-[9].
At present, relevant scholars have carried out a large number of dynamic response studies on the lining section form, tunnel depth, geological conditions, and other working conditions. Mehdi Panji et al. [10] found that the enlargement of the horseshoe-shaped tunnel and the square tunnel is the largest. Concerning the buried depth of the tunnel, Jiang et al. [11] proposed that the reasonable buried depth of the tunnel in the high-intensity seismic area should be no less than 50 m as far as possible according to the seismic acceleration response of mountain tunnels with different buried depths. However, when the tunnel is in the state of shallowly buried bias, the distribution of the internal force value of the lining is disadvantageous and has a large peak value [12], [13]. Wang et al. [14] studied the seismic failure characteristics of the tunnel entrance slope under different geological conditions. It is concluded that the overlying soil with weak interlayer slides and collapses along the weak interlayer, and the homogeneous inverted slope only had local collapse at the slope shoulder. While Gao et al. [15] found that the dynamic response of the soft-hard interface of surrounding rock increases significantly. Guan et al. [16] explored the seismic dynamic characteristics of the intact extra-large cross-section tunnel and found that the dynamic characteristics of the original site were significantly changed due to the existence of the extra-large cross-section tunnel under shallow burial conditions. At the same time, based on the analysis of the relationship between the dynamic characteristics of the extra-large cross-section tunnel and the input ground motion amplitude, it is found that the cracks of the lining structure develop significantly, and its overall stiffness decreases obviously after the excitation of large amplitude seismic wave. Li et al. [17] discussed the influence of factors such as lining cracking position and cracking form on the dynamic response of the structure. The results showed that the cracks at the vault and sidewall have less influence on the seismic safety of the tunnel lining structure, while the cracks at the arch waist have more influence on the seismic safety of the tunnel lining structure, significantly. When exploring the interaction between the surrounding rock and the lining, Sun et al. [18] found that the horizontal shear failure of the surrounding rock was caused by the interaction between the surrounding rock and the tunnel lining, and the cracks in the surrounding rock grew almost in the same direction.
The above research uses the shaking table to carry out research experiments from different angles to obtain the whole process of the dynamic response of the underground structure. But most of the research focuses on static analysis and most of the dynamic analysis is the non-destructive lining. To investigate the influence of lining cracking disease and multiple cracks on tunnel dynamic response and seismic performance, large-scale shaking table model comparison tests of non-destructive and vault-cracked lining structures were carried out. At the same time, to study the dynamic response law of the structure at different vertical elevations, multiple accelerometer measurement points were set, and the acceleration response amplification law was obtained. To study the interaction between the surrounding rock and the lining, the earth pressure box was placed at the key position to obtain the dynamic earth pressure. To study the deformation of various parts of the lining structure, strain gauges were arranged on the inner and outer surfaces of the lining, and the dynamic strain law of the inner and outer surfaces of the lining was obtained. In addition, to study the influence of initial cracking on the lining internal force, the dynamic axial force and the dynamic bending moment of the lining section were calculated according to the dynamic strain values of both sides inside and outside the measuring point, and the variation law of the dynamic internal force was obtained. Based on the above results, the seismic performance of the three groups of lining structures was discussed. These studies are helpful to the understanding of the failure mode of tunnel structure and the influence of cracks on the seismic performance of tunnel, and some meaningful conclusions are drawn from them.
2. Shaking table test
2.1. Introduction of the test model
Based on the second similarity theorem ( theorem), the similarity ratio of each physical quantity was deduced by the dimensional analysis method [19]. In addition, the prototype was appropriately simplified by considering the size of the model box, the model-making process, and the relevant limiting parameters of the bearing capacity instrument of the shaking table. The final derivation results are shown in Table 1.
Table 1The similarity ratio of the main physical quantities in the model test
Physical quantity | Similarity relation | Similarity ratio | Physical quantity | Similarity relation | Similarity ratio |
Density | 1 | Cohesion | 60 | ||
Length | 60 | Internal friction angle | 1 | ||
Acceleration | 1 | Time | 7.746 | ||
Elastic modulus | 60 | Frequency | 0.129 | ||
Strain | 1 | Speed | 7.746 | ||
Poisson’s ratio | 1 |
The selection of physical and mechanical parameters of the surrounding rock was combined with the geological exploration data of an example tunnel and the Highway Tunnel Design Code [20]. The grade was determined as grade V, as shown in Table 2. The surrounding rock fill in the model box selects the appropriate prototype soil. Under the condition of guaranteeing the soil weight similarity ratio or the soil elastic modulus similarity ratio, the parameters of material cohesion and internal friction angle were controlled by controlling the compaction density and water content of the remolded soil, to meet the conditions of similar physical properties of materials. The lining is poured with gypsum, quartz sand, barite powder, and water according to the mixture ratio of 1.8:0.8:1:2, and its mechanical parameters are shown in Table 3.
Table 2Mechanical parameters of the surrounding rock
Name | Cohesion / kpa | Internal friction angle / (°) | Elastic modulus / GPa | Unit weight / (KN/m3) | Poisson’s ratio |
Prototype | 50-200 | 20-27 | < 1.3 | 17-22.5 | 0.35-0.45 |
Model | 0.83-3.3 | 20-27 | < 0.0217 | 17-22.5 | 0.35-0.45 |
Test value | 4.01 | 27 | 0.015 | 18.32 | 0.45 |
Table 3Mechanical parameters of the lining
Name | Elastic modulus / GPa | Unit weight / (KN/m3) | Poisson’s ratio | Tensile strength / MPa |
Prototype | 31.5 | 23 | 0.2 | 2.2 |
Model | 0.525 | 23 | 0.2 | 0.0367 |
Test value | 0.541 | 21.9 | 0.2 | 0.0389 |
Considering the difficulty of pouring in the test, the composite lining was considered as a single lining, and the physical and mechanical parameters were converted according to the principle of equivalent stiffness. The thickness of the lining model was determined to be 20 mm. At the same time, due to the thin thickness of the lining model, it is difficult to put the steel bar into the lining model, so the influence of the steel bar was not considered in the lining structure.
2.2. Introduction of test equipment and seismic wave
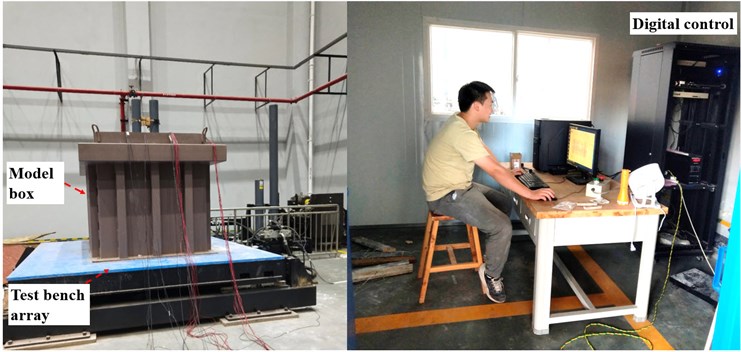
Because the shaking table test has the advantages of intuitive and real response to the dynamic response of the surrounding rock and lining and the progressive failure process. The test was carried out on the electro-hydraulic servo unidirectional seismic simulation shaking table of the State Key Laboratory of Bridge and Tunnel Engineering in a mountainous area jointly built by the province and ministry. The main performance indicators of the shaking table are: the size of the table is 3 m×3 m, the maximum load is 10 t, the frequency range is 0-50 Hz, and the maximum acceleration of the table is 1.5 g. The vibration system is shown in Fig. 1. The test photo was taken by the first author in May 2022 and shot in the State Key Laboratory of Mountain Bridge and Tunnel Engineering of Chongqing, which is located within the Tunnel laboratory of Chongqing Jiaotong University in Jiangjin District, Chongqing. The operators in the figure are members of the team.
Fig. 1Vibrating system
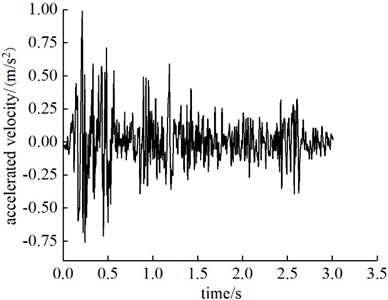
In this shaking table test, the horizontal seismic waves perpendicular to the axis of the tunnel were considered to be input, and the input seismic waves were synthetic waves converted by the similarity relation. The acceleration time history curve of one seismic wave is shown in Fig. 2.
Fig. 2Input ground motion acceleration time history curve
2.3. Design of test conditions
The shaking table model tests were carried out on the non-destructive lining structure (model 1), the lining structure with a crack in the center at the vault (model 2), and the lining structure with two cracks at the vault (model 3). The dynamic responses of each structure with incrementally increasing seismic waves from 0.1 g to 1.0 g were analyzed. Because it was extremely difficult to embed cracks in advance during the lining pouring process, the reference method [21] was used to cut the cracks with a knife and mark them with markers after the lining curing was completed. The crack width is controlled by 0.5 mm, the depth is 10 mm, the length is 300 mm, and the distance between the two cracks is 10 mm. The dimensions of the test model and each working condition model are shown in Fig. 3.
Fig. 3Three forms of test
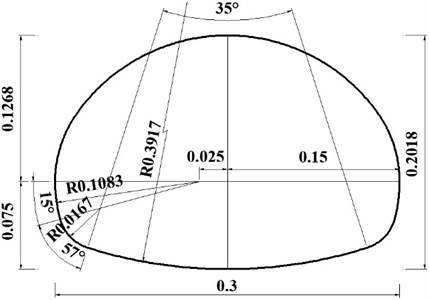
a) The lining of the size
b) Model 1
c) Model 2
d) Model 3
2.4. Measuring point layout and data collection
The layout of the model diagram, accelerometer, soil pressure box, and strain gauge are shown in Fig. 4. Among them, the accelerometer, the soil pressure box, and the strain gauge were all arranged in the middle of the longitudinal length of the lining structure. Strain gauges were used to measure the dynamic strain on the inner and outer surfaces of the lining structure. Due to the limitation of equipment functions, and to observe the influence of cracks on the dynamic response of the structure, strain gauges were placed on both sides of the cracks.
The data acquisition system consists of two DH5922N dynamic signal testing and analysis systems. The model of the dynamic earth manometer is DYB-1, the range is 0.3 MPa, the sensitivity is 23.279 MPa/V, and the size is Ф15 mm×5 mm. The type of three-way acceleration sensor is DH301, the range is ±20 m/s2, the sensitivity is 0.659 V/g, and the size is 15 mm×15 mm×5 mm; The strain gauge model is BX120-20AA, the sensitivity coefficient is 2.06-2.12, and the size is 20 mm×3 mm.
Fig. 4Schematic diagram of model measuring point layout
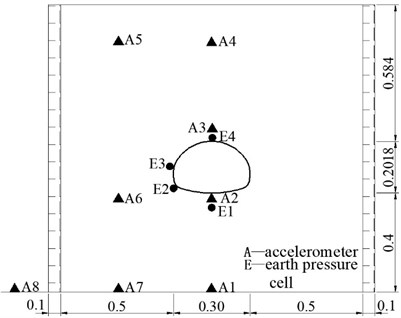
a) Accelerometer and soil pressure box arrangement (unit: m)
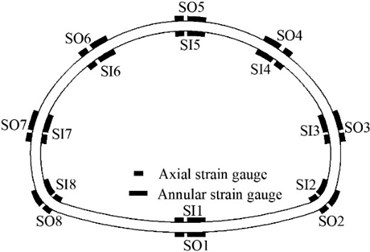
b) The arrangement of strain gauges in Model 1
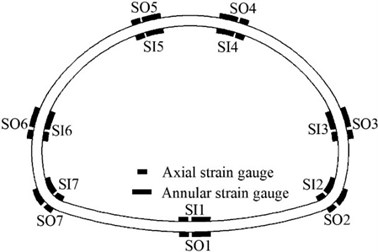
c) The arrangement of strain gauges in Model 2
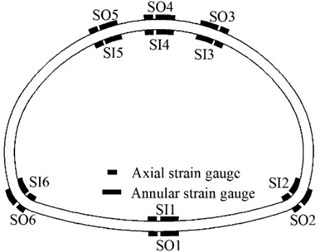
d) The arrangement of strain gauges in Model 3
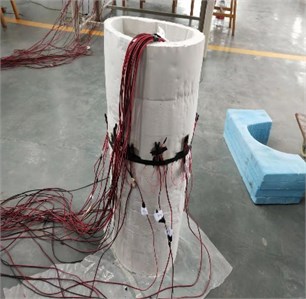
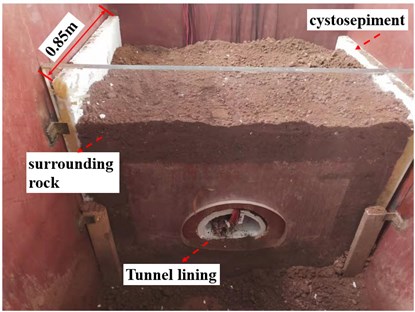
To eliminate the boundary reflection effect, a layer of polystyrene foam board was set up on both sides of the box walls in the excitation direction. To eliminate the boundary friction effect, lubricant was applied on both sides of the box walls perpendicular to the excitation direction. At the same time, to avoid the relative slippage between the model soil and the steel plate at the bottom of the box, the crushed stone was bonded at the bottom of the model box to increase the friction resistance. The detailed layout of the model is shown in Fig. 5.
Fig. 5test model
3. Test result analysis
3.1. Dynamic response analysis of acceleration
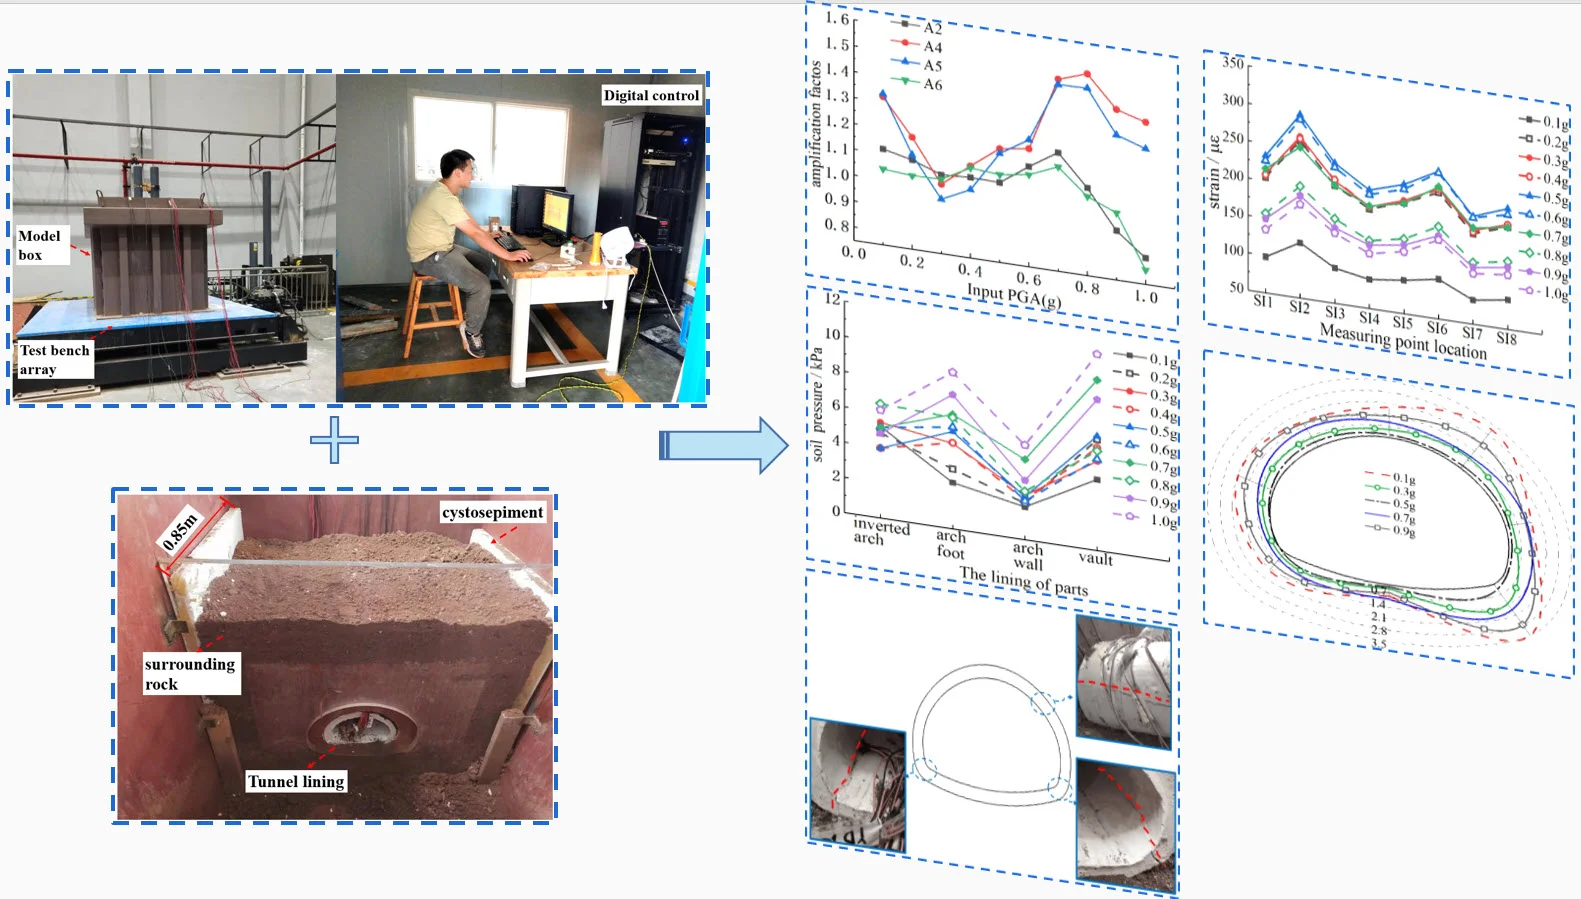
To study the acceleration response of different vertical elevations and horizontal positions of the structure, the ratio of the peak value of the acceleration dynamic response of the measuring points (A2, A4, A5, and A6) to the peak value of the table input wave acceleration (A8) is defined as the acceleration amplification coefficient, and the corresponding acceleration response amplification law could be obtained, as shown in Fig. 6. On the whole, with the increase of the peak acceleration (0.30 g-0.80 g), the upper surrounding rock (A4, A5) of the tunnel structure of the three groups of models has a significant acceleration amplification effect, and the acceleration response is approximately positively correlated with the peak acceleration of the input wave. This is because the surrounding rock becomes loose gradually during the loading process, resulting in strong vibration of some parts. When the peak acceleration increases to 0.8 g, the amplification coefficient values of each measurement point show a decreasing trend, which may be due to the plastic failure of the tunnel structure or the failure of the overlying soil, leading to the gradual dissipation of seismic energy. Among them, the peak acceleration amplification coefficient of the elevation position of the lining at the inverted arch is about 1.2, and the peak acceleration amplification coefficient of the elevation position close to the fill soil surface is about 1.6. In addition, the acceleration amplification coefficient increases with the increase of elevation, and the response law of different horizontal positions are similar.
Fig. 6The variation of amplification coefficient with input PGA
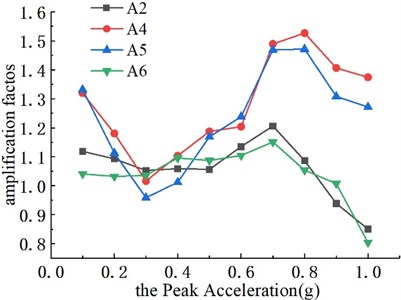
a) Model 1
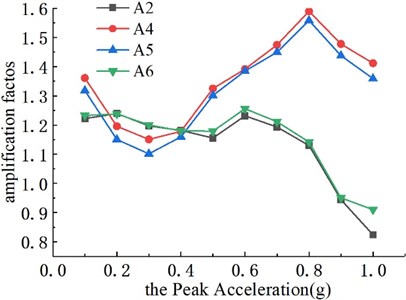
b) Model 2
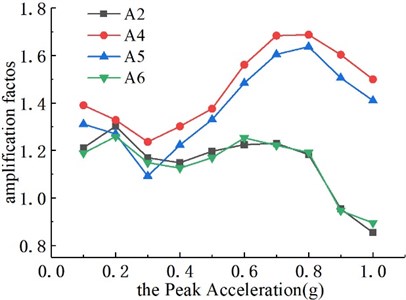
c) Model 3
3.2. Dynamic response analysis of soil pressure
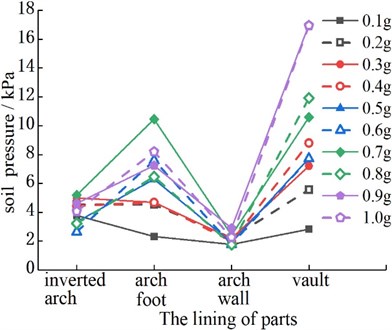
To study the interaction between the surrounding rock and lining, the dynamic earth pressure values are obtained according to the soil pressure boxes placed at key positions. The peak value of the contact soil pressure time history curves of each part of the lining structures under different PGA are shown in Fig. 7. On the whole, the changing trend of soil pressure between the lining and surrounding rock in the three groups of tests is basically the same, and all of them increase with the increase of the peak acceleration. At the same time, the soil pressure values of the arch bottom, arch foot, and vault of the three groups of models are larger. Among them, the soil pressure values at the vault of the three groups of models are model 2, model 1, and model 3 in descending order. The values of earth pressure at the arch foot of the three groups of models are model 3, model 2, and model 1 in descending order.
It can be seen from Fig. 7(a) that the soil pressure of the vault is slightly higher than that of the arch foot, which is caused by the direct pressure of the overlying earth caused by gravity. Therefore, in the seismic design stage of the tunnel, we should pay more attention to the location of the vault. Meanwhile, the earth pressure at the vault of Fig. 7(b) increases significantly with the increase of the peak acceleration. The main reason is that the vault itself is subjected to greater earth pressure, coupled with the existence of cracks, resulting in obvious stress concentration. According to Fig. 7(c), the soil pressure at the arch foot increases significantly with the increase of the peak acceleration. Although two cracks are distributed in the vault, they are not in the most unfavorable position in the center of the vault.
Fig. 7Dynamic soil pressure of the tunnel structures
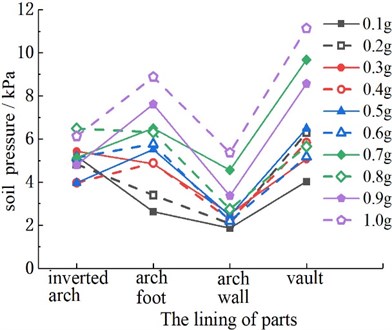
a) Model 1
b) Model 2
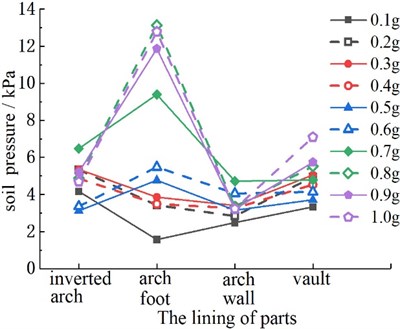
c) Model 3
3.3. Dynamic response analysis of strain
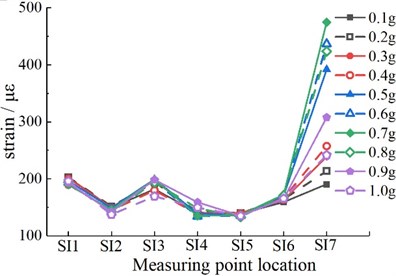
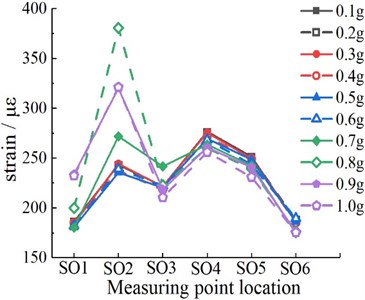
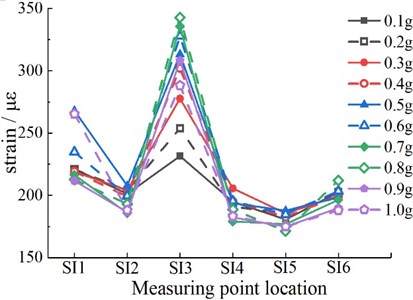
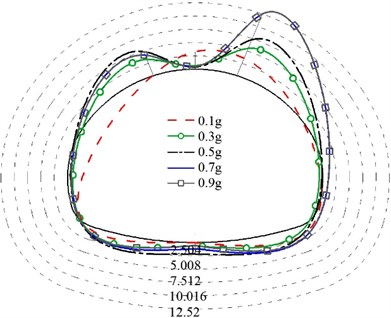
To study the deformation of each part of the lining structure, the dynamic strain law of the lining surface was obtained according to the strain gauge arranged on the lining surface. Figs. 8-10 shows the extreme distribution of dynamic tensile strain at each measuring point on the inner and outer surface of the lining structure under the different peak accelerations. On the whole, the strain distribution of the same tunnel is similar under the action of the different peak accelerations. At the same time, the internal and external surface strain of the structure first increases with the increase of the peak acceleration and then decreases after reaching a certain peak acceleration.
According to Fig. 8, the peak values of dynamic strains on the outer surfaces of the right arch foot (SO2) and the right arch shoulder (SO4) of the tunnel are relatively large. The peak values of dynamic strain on the inner surfaces of the right arch foot (SI2) and the left arch shoulder (SI6) of the tunnel are relatively large. The right arch foot of the structure reaches the strain extreme value at 0.4 g. The peak values of dynamic strain at other measuring points change sharply when the peak acceleration increases to 0.5 g, but after 0.5 g, the strain values at each measuring point begin to decrease. It is mainly due to the damage in the tunnel, the redistribution of stress, and the energy loss near the crack, which reduces the strain. At the same time, the sensitivity of each measurement point of the tunnel to seismic waves is different. In particular, the sudden change in the shape of the structural section at the arch foot is prone to strain concentration and bears large tensile strain, so its seismic requirements should be properly improved in the design of the tunnel structure. The most unfavorable strain position of the complete lining is at the arch foot and spandrel, which is similar to the results obtained in previous studies [22].
Fig. 8The strain response of Model 1

a) External surface measurement points
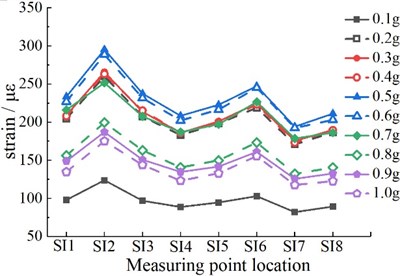
b) Inner surface measurement points
Fig. 9The strain response of Model 2
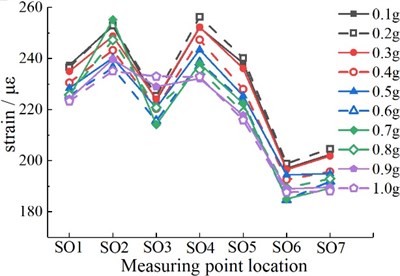
a) External surface measurement points
b) Inner surface measurement points
According to Fig. 9, the peak values of dynamic strain on the outer surface of the right arch foot (SO2) and the right side of the crack at the arch vault (SO4) of the tunnel are relatively large. The peak values of dynamic strain on the inner surfaces of the inverted arch (SI1) and the left arch foot (SI7) are relatively large. When the peak acceleration increases to 0.2 g, the strain near both sides of the vault reaches the maximum, but after that, the strain at the measuring point begins to decrease, and there may be damage or failure in this part of the structure. When the peak acceleration increases to 0.7 g, the strain of the left and right arch foot reaches the maximum.
It can be seen from Fig. 10 that the peak values of dynamic strain on the outer surface of the right arch foot (SO2) and the vault (SO4) are larger, while that on the inner surface of the inverted arch (SI1) and the right arch shoulder (SI3) is larger. When the peak acceleration increases to 0.2 g, the strain in the vault region reaches the maximum, and the crack of the structure may propagate. When the peak acceleration increases to 0.5 g, the inner surface strain of the inverted arch reaches the maximum. When the peak acceleration increases to 0.8 g, the strain of the right arch shoulder and right arch foot reaches the maximum.
In short, the existence of cracks changes the stress state of the lining, and the area with cracks is dangerous. The peak acceleration of crack propagation in the cracked lining is lower than that of the non-destructive lining, which indicates that the seismic performance of the cracked lining is reduced and it is easy to be damaged under an earthquake. Due to the large radius of the inverted arch section shape, it bears the overlying surrounding rock and the dead weight of the tunnel structure in the static stage, resulting in a large bending moment. At the same time, the radius of the arch foot is the smallest, and it is easy to cause some unfavorable phenomena such as stress concentration. These phenomena cause great dynamic strain in the arch foot and the inverted arch.
Fig. 10The strain response of Model 3
a) External surface measurement points
b) Inner surface measurement points
4. Dynamic internal force analysis
To study the influence of initial cracking on the lining force, the axial force and bending moment of the lining section at any time were calculated by the dynamic strain values inside and outside the measuring point, and the variation rule of dynamic internal force was obtained. The specific formula is as follows:
where, and are the inner and outer strain of the structure, is the elastic modulus, is the section thickness, is the section width, is the axial force, and is the bending moment.
Analyze the dynamic axial force extreme value and dynamic bending moment extreme value of each measuring point of the three linings under the action of different acceleration peaks, as shown in Figs. 11-12. It can be seen from the figure that the internal force of the non-destructive lining structure is concentrated in the spandrel and the arch foot, and the internal force of the cracked lining structure is concentrated in the initial damaged part and the arch foot position. At the same time, the internal force value of each measuring point increases first and then decreases with the increase of the peak acceleration. Especially, the axial force of the structure increases twice when the PGA increases from 0.1 g to 0.3 g. In addition, the stress of the structure with two cracks is more complicated, and the two crack areas are the focus areas for seismic fortification. The internal force of the cracked structure is greater than that of the non-destructive structure, which also indicates that the damage to the structure is more serious.
Fig. 11axial force diagram (unit: N)
a) Model 1
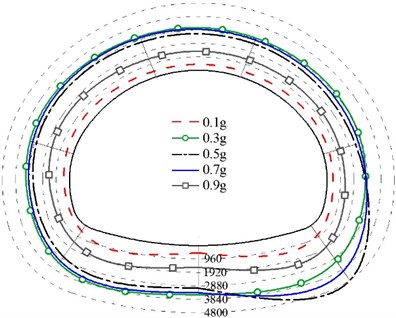
b) Model 2
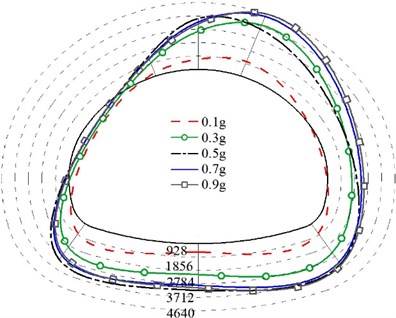
c) Model 3
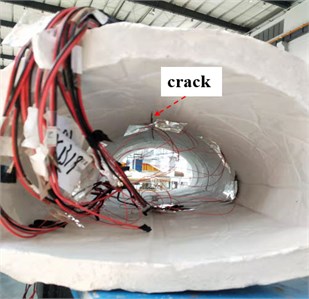
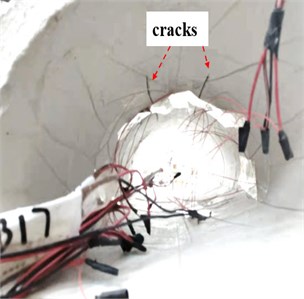
5. Structural cracking situation
To visualize the crack distribution of the three groups of lining structures, the damaged state of the structures under the action of different peak seismic waves was recorded in real-time. The damage distribution of the linings in each group is shown in Fig. 13. In the test of model 1, there are longitudinal cracks between the arch shoulder and the arch foot, especially at the arch foot. The right arch foot cracked under the excitation of the earthquake of about 0.4g. In addition to the arch shoulder and the arch foot of model 2, cracks also occurred at the central crack of the vault and the inverted arch. Among them, the crack in the center of the vault was expanded under the excitation of the earthquake of 0.2 g. The peak acceleration of the cracked lining is significantly lower than that of the non-destructive lining structure, which indicates that cracks have a certain influence on the seismic capacity of the structure because the initial damage to the lining reduces the overall stiffness of the structure. In model 3, two cracks were evenly arranged between the vault and the arch shoulder, and the initial cracks expand first under the excitation of the earthquake of 0.2 g. These failure phenomena are basically consistent with the analysis of the fractured state of tunnel structures based on the strain extremum in Section 3.3. In addition, the fractured state of the intact lining is similar to the conclusions of the existing studies [16], [23].
Fig. 12bending moment diagram (unit: N∙m)
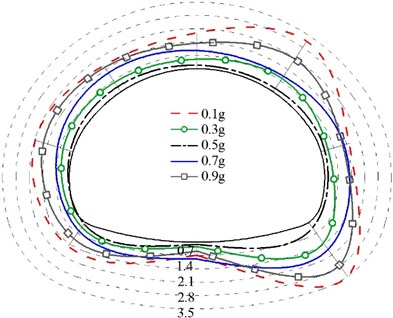
a) Model 1
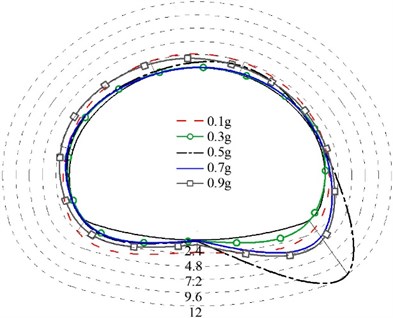
b) Model 2
c) Model 3
To sum up, the cracked lining is more serious than the non-destructive lining, and the initial damage area is more dangerous, which is easy to expand. Both the inverted arch and the vault are tensile cracks on the inner surface, and the rest are tensile cracks on the outer surface. Due to the high brittleness of the plain concrete tunnel lining, once the fine cracks appear, the lining cracks expand rapidly along the thickness direction, but also the axis direction of the tunnel. In addition, according to the dynamic strain situation in Section 3.3, it can be concluded that the arch shoulder and arch foot of model 1 are the key reinforcement parts; A crack at the vault, arch shoulder, arch foot, and inverted arch of the model 2 is the key reinforcement parts; The initial damage area, arch wall, arch foot and inverted arch of the model 3 are the key reinforcement parts. These are the key areas for seismic fortification of extra-large cross-section tunnels. The above test photos were taken by the first author in May 2022 and shot in the State Key Laboratory of Mountain Bridge and Tunnel Engineering of Chongqing.
Fig. 13Breakage of linings
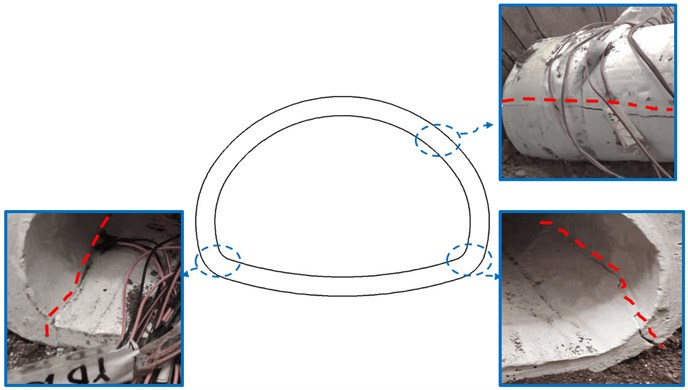
a) Model 1
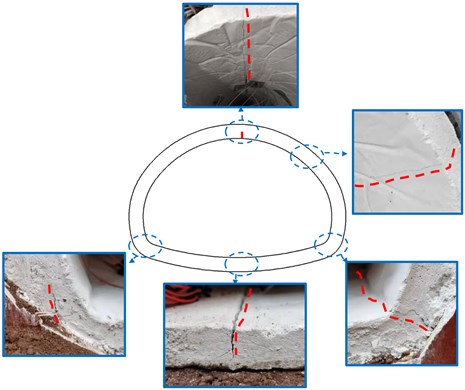
b) Model 2
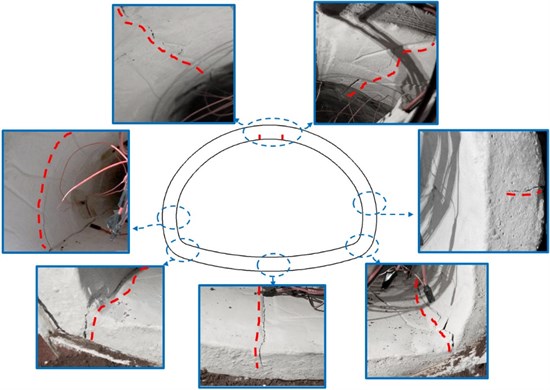
c) Model 3
6. Conclusions
Through the shaking table tests of non-destructive lining structure (model 1), a crack in the vault of the lining structure (model 2), and two parallel cracks in the vault of the lining structure (model 3) under the action of gradually increasing the input waves, it was concluded that the influence of lining cracking disease and multi-crack phenomenon on the dynamic response of tunnel structure and seismic performance of the structure was significant. The main conclusions are as follows:
1) There are differences in the seismic weak areas of the three groups of structures in different states. Among them, the seismic weak positions of model 1 are the arch shoulder and the arch foot, the seismic weak positions of model 2 are the arch shoulder, the arch foot, the initial damage area, and the inverted arch, and the seismic weak positions of model 3 are the positions of the arch foot, the cracks of the vault, the inverted arch, and the arch wall.
2) The three groups of lining structures have different peaks of seismic waves when damaged. When the peak acceleration is 0.2 g, the crack propagation phenomenon occurs in the initial crack position of model 2 and model 3. When the peak acceleration is 0.4 g, the cracking phenomenon occurs at the right arch foot of model 1. It can be seen that the peak acceleration of the cracked lining is significantly lower than that of the non-destructive lining structure, indicating that the existence of cracks will weaken the seismic resistance of the structure, mainly because the presence of initial damage reduces the overall stiffness of the structure.
3) The deformation and stress of the three groups of lining are different. The strain and peak internal force of the non-destructive lining structure concentrates on the arch shoulder and the arch foot, while the strain and peak internal force of the cracked lining structure concentrate on the initial damage site and the arch foot.
4) When the peak acceleration < 0.8 g, the surrounding rock has a significant amplification effect on the input seismic waves and the acceleration amplification coefficient of the three groups of lining structures increases with the increase of the peak acceleration. When the peak acceleration = 0.8 g, the amplification coefficient of the three models reached 1.2 at the inverted arch position, and the amplification coefficient near the elevation position of the filled surface reached 1.6. When the peak acceleration > 0.8 g, plastic damage to the tunnel structure or destruction to the overlying soil causes the seismic energy to be gradually consumed, and the amplification coefficient value is decreasing.
5) Horizontal shear waves cause significant interaction between the structure and the surrounding rock. The soil pressure values of the arch bottom, arch foot, and vault of the three groups of tests were large. Among them, the soil pressure values at the vaults of the three groups of models are model 2 > model 1 > model 3 in turn. This is due to the gravitational action that causes the vault to be directly subjected to the pressure of the overlying soil, coupled with the obvious stress concentration caused by the existence of cracks.
References
-
D. J. Liu et al., “Present status and development trend of diagnosis and treatment of tunnel lining diseases,” (in Chinese), China Journal of Highway and Transport, Vol. 34, No. 11, pp. 178–199, 2021, https://doi.org/10.19721/j.cnki.1001-7372.2021.11.015
-
B. Gao et al., “Lessons learnt from damage of highway tunnels in Wenchuan earthquake,” (in Chinese), Journal of Southwest Jiaotong University, Vol. 44, No. 3, pp. 336–341, 2009, https://doi.org/10.3969/j.issn.0258-2724
-
Z. Chen, C. Shi, T. Li, and Y. Yuan, “Damage characteristics and influence factors of mountain tunnels under strong earthquakes,” Natural Hazards, Vol. 61, No. 2, pp. 387–401, Mar. 2012, https://doi.org/10.1007/s11069-011-9924-3
-
Y. Shen, B. Gao, X. Yang, and S. Tao, “Seismic damage mechanism and dynamic deformation characteristic analysis of mountain tunnel after Wenchuan earthquake,” Engineering Geology, Vol. 180, pp. 85–98, Oct. 2014, https://doi.org/10.1016/j.enggeo.2014.07.017
-
Wang Zheng-Zheng, “Failure mode anlysis of mountain tunnel shake table test in high-intensity earthquake area,” (in Chinese), Engineering mechanics, Vol. 26, pp. 62–66, 2009.
-
M. N. Wang, “Study on shock absorption technology of underground structure in high earthquake intensity area,” (in Chinese), Southwest Jiaotong University, 1999.
-
N. Liu et al., “Experimental study of a segmented metro tunnel in a ground fissure area,” Soil Dynamics and Earthquake Engineering, Vol. 100, pp. 410–416, Sep. 2017, https://doi.org/10.1016/j.soildyn.2017.06.018
-
Y. Yan et al., “Failure analysis of urban open-cut utility tunnel under ground fissures environment in Xi’an, China,” Engineering Failure Analysis, Vol. 127, p. 105529, Sep. 2021, https://doi.org/10.1016/j.engfailanal.2021.105529
-
D. Mingqing, S. Jie, W. Xuchun, Z. Sulei, and Z. Yongjun, “Dynamic response and crack propagation law of tunnel invert with initial damage,” Engineering Failure Analysis, Vol. 119, p. 104939, Jan. 2021, https://doi.org/10.1016/j.engfailanal.2020.104939
-
M. Panji and S. Mojtabazadeh-Hasanlouei, “Seismic ground response by twin lined tunnels with different cross sections,” SN Applied Sciences, Vol. 3, No. 9, pp. 1–20, Sep. 2021, https://doi.org/10.1007/s42452-021-04770-7
-
S. P. Jiang, L. Fang, and Z. Lin., “Seismic response analysis of mountain tunnels in different depths,” Rock and Soil Mechanics, Vol. 35, No. 1, pp. 211–216, 2014.
-
F. Wang, Q. Ren, X. Yang, B. Chen, S. Cui, and Z. Zhang, “Study on dynamic response characteristics of shallow-buried and unsymmetrical-loaded double-arch tunnel,” Geotechnical and Geological Engineering, pp. 1–13, Aug. 2022, https://doi.org/10.1007/s10706-022-02277-5
-
U. Cilingir and S. P. Gopal Madabhushi, “A model study on the effects of input motion on the seismic behaviour of tunnels,” Soil Dynamics and Earthquake Engineering, Vol. 31, No. 3, pp. 452–462, Mar. 2011, https://doi.org/10.1016/j.soildyn.2010.10.004
-
S. S. Wang et al., “Shaking table test for seismic behavior of upward slope at tunnel entrance in different geological conditions,” Rock and Soil Mechanics, Vol. 35, pp. 278–284, 2014.
-
X. Gao, P. Duan, and S. Duan, “Simulated seismic response analysis of subway tunnels under complex geological conditions of obliquely incident seismic SV waves,” Arabian Journal of Geosciences, Vol. 14, No. 11, pp. 1–10, Jun. 2021, https://doi.org/10.1007/s12517-021-07376-w
-
Z. C. Guan et al., “Seismic property of a large section tunnel based on shaking table model tests,” (in Chinese), Rock and Soil Mechanics, Vol. 37, No. 9, pp. 2553–2560, 2016, https://doi.org/10.16285/j.rsm.2016.09.016
-
B. T. Li et al., “Shaking table tests on seismic response of tunnel with longitudinal cracking lining,” (in Chinese), Journal of Southwest Jiaotong University, No. 1, pp. 20–27, 2021, https://doi.org/10.3969/j.issn.0258-2724.20190657
-
T. Sun, Z. Yue, B. Gao, Q. Li, and Y. Zhang, “Model test study on the dynamic response of the portal section of two parallel tunnels in a seismically active area,” Tunnelling and Underground Space Technology, Vol. 26, No. 2, pp. 391–397, Mar. 2011, https://doi.org/10.1016/j.tust.2010.11.010
-
J. J. Yang, Similarity theory and structural model test. (in Chinese), Wuhan University of Technology Press, 2005.
-
S. P. Jiang, “Highway tunnel design Code: JTG 3370.1-2018,” Industry Standard of the People’s Republic of China, China, 2018.
-
H. C. Zhou, “Study on seismic response mechanism of cracked lining in tunnels,” (in Chinese), Southwest Jiaotong University, 2018.
-
L. J. Tao et al., “Large-scale Shaking Table Test for Dynamic Response in Mountain Tunnel Bodies with Different Overburden Depths,” Earthquake Resistant Engineering and Retrofitting, Vol. 37, No. 6, 2015.
-
Z. Z. Wang, Y.-J. Jiang, C. A. Zhu, and T. C. Sun, “Shaking table tests of tunnel linings in progressive states of damage,” Tunnelling and Underground Space Technology, Vol. 50, No. 8, pp. 109–117, Aug. 2015, https://doi.org/10.1016/j.tust.2015.07.004
About this article

Thanks to the funding support from National Natural Science Fund (No: 51778095).
The datasets generated during and/or analyzed during the current study are available from the corresponding author on reasonable request.
Dongmei You wrote the manuscript and processed the data and images. Feng Gao reviewed the manuscript.
The authors declare that they have no conflict of interest.
