Abstract
To explore the mechanical properties of cracked lining subjected to seismic loads based on wave theory and the extended finite element method, the dynamic viscoelastic boundary of a seismic wave and equivalent nodal force load were generated by MATLAB programming software to establish a simulation model of cracked lining structure. The internal force state change law of the lining structure was studied by varying the crack depth, crack length, secondary lining thickness, and other parameter values (including the layout between multiple cracks). Also, the safety factor of the lining crack section was obtained, and the functional relationship between the safety factor and parameter variables was established. Results show that the crack depth and secondary lining thickness were the main factors affecting the internal force of the crack section. Based on the least square method, the calculation formula and 95 % confidence interval between the minimum safety factor () and each parameter of the crack section were obtained. Meanwhile, the prediction model was obtained via multiple nonlinear regression. When the crack depth value was 30 % of the lining thickness value, reduced 2.5 times. At 57 % crack depth of the lining thickness, the was less than the specification value, indicating that the lining structure’s safety reserve was low. Compared with the arrangement of the vertical distribution of the two cracks, the stress concentration generated when the two cracks were arranged in parallel would more likely affect the structure adversely. The findings can provide a reference for the safety study of cracked tunnels.
Highlights
- Each section's dynamic moment and axial force were extracted from the single factor analysis of the four variables, viz. crack depth, crack length, secondary lining thickness, and elastic modulus. Hence, the dynamic safety factor was obtained. According to the least square method, the fitting formula of the minimum safety factor and 95% confidence interval of the crack section.
- SPSS was used for multi-factor nonlinear regression analysis, and the overall expression of all random variables was finally obtained.
- Multiple crack models are established to analyze the interaction between cracks.
1. Introduction
Because tunnels make crossing hills feasible, they are often used in road traffic engineering. Through non-destructive testing methods, such as ground penetrating radar, acoustic emission, ultrasonic waves, and electromagnetic radiation [1]-[4], we found that tunnels are prone to structural cracking, leakage, freeze-thaw destruction and other diseases [5]-[8]. Notably, under seismic loads, with an increase in tunnel structure service life, secondary lining cracking becomes more severe. In this regard, to judge the service status and structural safety performance of tunnel structures, the Technical Specifications for Highway Tunnel Maintenance has made requirements for daily and frequent inspection of tunnel structures [9]. For regular, emergency, and special inspection requirements, specification strictly clarifies the detection indicators, such as crack lining location, crack length, crack depth, and crack development [9].
China is located between the two major global seismic belts (i.e., the Pacific Rim and the Eurasian), squeezed by the Pacific plate, the Indian plate, and the Philippine Sea plate. Hence, the seismic fault zone is very active, and the earthquake disaster is potentially severe. For example, in 2008, Wenchuan County struck a massive earthquake measuring 8.0 on the Richter scale, severely damaging several tunnels, and causing damage to the lining, such as concrete cracking, spalling, and large-scale collapse [10], [11]. Among them, lining cracks account for almost half the total diseases. Some researchers have found that under the action of static load, the deformation failure of the lining structure takes the vault cracking and the upward arch cracking as the dividing point, passing three stages (viz. linear deformation stage without cracks, stable deformation stage with cracks, and accelerated deformation failure stage). The main cracking modes of lining structure are the arc surface inside vault, the arc surface outside arch foot and the arc surface inside side wall [12]. Under seismic load, the lining structure exhibits an irregular elliptical deformation law, resulting in the relative displacement of the part above the structural side wall being greater than that below the structural side wall. The shoulders and arch feet of the lining structure are prone to cracks as weak points of seismic resistance. And more severely, existing cracks may be unstable expanded [13], [14]. Using shaking table experiments, Wang et al. [15] analyzed the seismic effects of different intensities. They found that the phenomenon that the dominant frequency of structure decreases with the increase of Peak Ground Acceleration value can reflect the damage degree of lining and predict the process of structural crack propagation. However, the scale reduction experiment is not easy to restore the complex environment in which the tunnel is located and the size effect exists, and the research results are cumulative damage [15]-[17]. Under the action of seismic load, Aicha et al. [18] analyzed the influence of parameters such as overburden thickness, lining thickness and tunnel section shape on the lining characteristics of shallow buried tunnels. They subsequently established the time function expressions of horizontal stress, shear stress and horizontal displacement. Nariman et al. [19] showed a tunnel model using the coupled extended finite element and constrained quadratic optimization methods. They optimized the design parameters related to the lining (lining thickness, elastic modulus of lining concrete, and density of lining concrete). The study found that the tunnel vault area was the most sensitive to the force state. Wang et al. [20] generated a crack tunnel model subject to seismic loads. They demonstrated the phenomenon that the deeper the initial crack depth of the lining, the more significant the stress concentration by changing the depth parameters of the cracks. Elsewhere, Qiu et al. [21] reconstructed a constitutive model of plastic damage of reinforced concrete based on the pseudo-static deformation assessment method, and discussed the evolution of lining cracks and lining seismic resistance with longitudinal cracks. Their results showed that the arch shoulder crack most significantly affects the tunnel's seismic resistance, and that the interaction between the primary support and the secondary lining will affect the failure rate of the lining. In another study, Zhang et al. [22] formulated a non-damage tunnel lining model, considering the combination of high ground stress and seismic load. They found that the safety factor at the vault and arch foot was small.
So far, most scholars have studied non-destructive lining structures subjected to static loading. A few scholars have examined damaging lining under dynamic load. This paper investigates the effects of structural parameters, crack size parameters, and the interaction of multiple cracks on the mechanical and safety properties of cracked lining structures under seismic load.
Based on this, the damage model is established through wave theory and the extended finite element method. Then, we assessed the influence of four random variables (crack depth, crack length, secondary lining thickness, and elastic modulus of secondary lining on the safety of tunnel structure) under seismic load. First, a single-factor analysis was carried out to extract the dynamic bending moment and dynamic axial force of each section of the structure, from which the most unfavorable state was obtained. Then, the dynamic safety factor was calculated using the standard formula, and the safety reserve of the section was judged. At the same time, we obtained the fitting formula and 95 % confidence interval of the minimum safety factor of the crack section under the change of each factor. Secondly, a multivariate nonlinear regression analysis was done to obtain an overall expression of the minimum safety factor by considering all the random variables. Finally, through the interaction effect between the two cracks, the stress change law of the lining structure was explored. It helps provide a reference for the reinforcement of tunnel damage and the structural safety assessment of operating tunnels.
2. Research theory
Based on the wave theory and the extended finite element method, the damage model was established by ABAQUS, and the dynamic viscoelastic boundary and the equivalent nodal force load of seismic waves were generated by MATLAB.
2.1. Dynamic border of viscoelasticity
The dynamic boundary of the model is an artificial viscoelastic boundary that can absorb the scattering wave energy and simulate the elastic recovery ability of the far-field foundation. This method is a parallel spring and damper element in the standard and tangential distribution of artificial boundary nodes (Fig. 1). The mechanical parameters of spring stiffness and damping coefficient are shown in Table 1.
Fig. 1Schematic diagram of the viscoelastic boundary
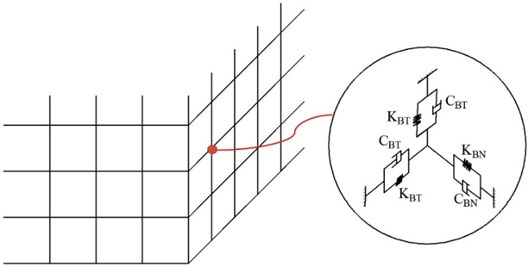
Table 1Formulas for calculating spring stiffness and damping coefficient
Parameter name | Normal spring stiffness | Tangential spring stiffness | Normal damping coefficient | Tangential damping coefficient |
Formula |
In the Table 1, and are the viscoelastic boundary correction coefficients of values 1 and 0.5 [23]; is the distance from the wave source to the artificial boundary point, simplified as the vertical distance to the artificial boundary; and are the shear modulus and density of foundation, respectively; and are the P-wave and S-wave velocities of the foundation, respectively. These values are calculated as follows:
where is the elastic modulus of the foundation and is Poisson’s ratio.
2.2. Equivalent nodal load
The seismic wave problem is transformed into the wave source problem, while the seismic load is transformed into the equivalent nodal force. The varying concentrated force is applied to the corresponding boundary node. The equivalent nodal load of any boundary node under an incident seismic wave is expressed as follows:
where is the displacement vector of the incident wave, is the velocity vector, is the free field stress, is the boundary node control side length, and are the respective spring stiffness and damping coefficients, divided into normal and tangential directions.
2.3. Extended finite element
The extended finite element method (XFEM) uses the jump function to describe the displacement discontinuity of the crack surface. The asymptotic displacement function, describes the displacement field at the crack tip to characterize the crack state jointly. This approach makes the node function of the element (where the preset crack is located) add two new enrichment (enhancement) terms. The node enrichment function is expressed as follows:
where is a conventional finite element nodal function; is the node set of all nodes in the grid; is the displacement vector of the continuous part in the finite element, applicable to all nodes in the grid; is the jump function, one of the enhancement terms suitable for the element nodes penetrated by cracks; is the improved degree of freedom of the node through the crack element; is the progressive displacement function at the crack tip, another enhancement term that applies to the element node at the crack tip; is the enhanced variable of the element node at the crack tip.
From Eq. (5), we derive Eq. (6):
where is the dot product of the vector from the integral point to the crack surface and the normal vector of the crack surface. And expressed as follows:
where and are the parameters of the local coordinate system at the crack tip.
3. Computation module
3.1. Establishment of the model
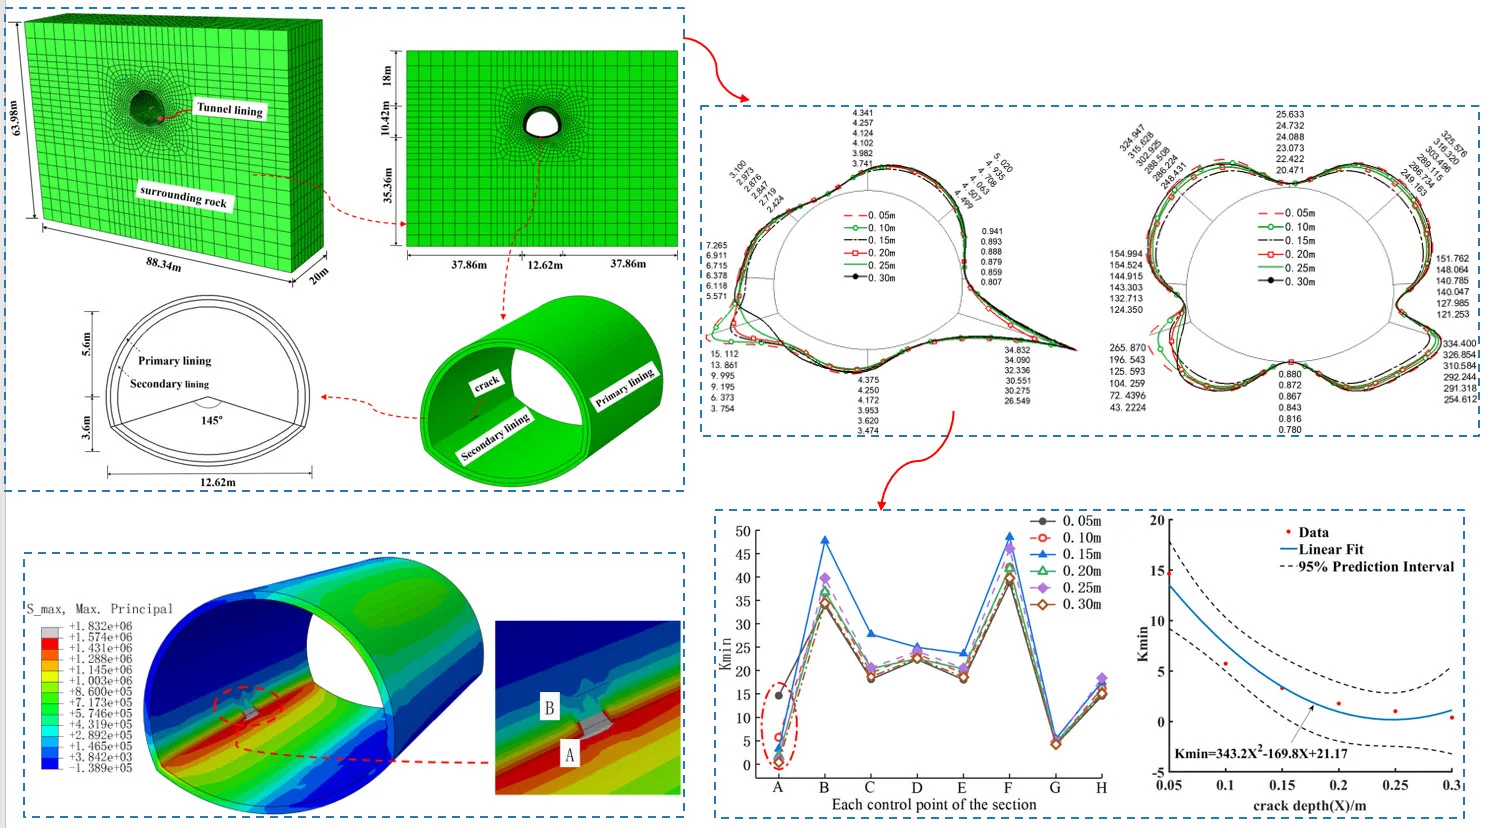
Taking an engineering example as the research object, a specific range is intercepted as the calculation area (Fig. 2). According to the engineering geological mapping, drilling and engineering geophysical prospecting, the strata in the tunnel site are overlying the quaternary Holocene (Q4el+dl) silty clay, and underlying the lower Triassic Yelang Formation () calcareous shale, locally distributed with highly weathered limestone, graded as IV. The initial support and the secondary lining were 0.26 and 0.35 m thick. The physical and mechanical parameters of the surrounding rock and supporting materials are listed in Table 2. Domestic and abroad studies showed little difference between dynamic and static elastic modulus of concrete. Hence, a conservative calculation was adopted, and the elastic modulus of materials was still static [24]. The stress release rate of the surrounding rock was 30 %, and 70 % initial support, while the secondary lining was a safety reserve in the excavation stage. The shear wave velocity of the surrounding rock and the longitudinal wave velocity were 750.85 and 1459 m/s, respectively.
Fig. 2Finite element 3D model
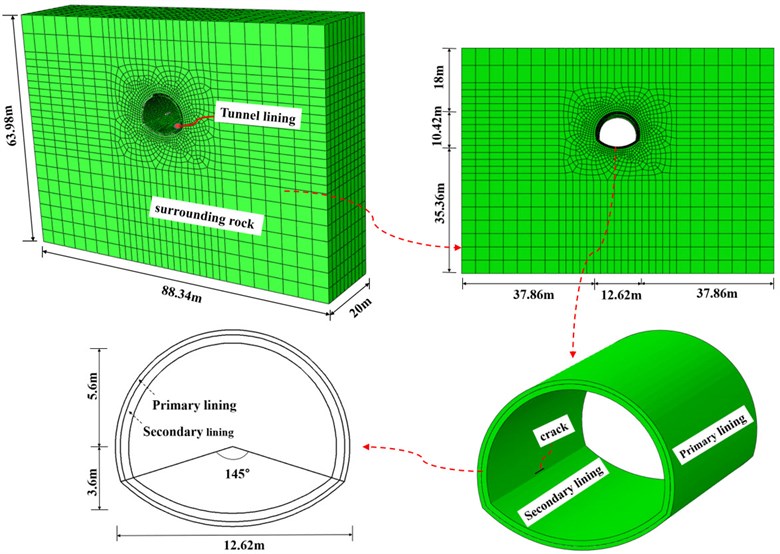
Table 2Physical and mechanical parameters of the surrounding rock and support
Name | Volume weight / (kN·m-3) | Elastic modulus / GPa | Poisson’s ratio | Cohesion / MPa | Friction angle / ° |
Surrounding rock of Grade IV | 21.5 | 3.2 | 0.32 | 0.5 | 33 |
Initial support | 25 | 27.5 | 0.20 | – | – |
Two models are established to carry out static analysis and dynamic analysis respectively and realize boundary conversion. Among them, model 1 uses a fixed boundary, excavation and other analysis steps to obtain the static stress field and the constrained reaction value of the nodes on the boundary. In model 2, the viscoelastic boundary is adopted, and the static stress field is taken as its initial stress state. The gravity load and the nodal constraint reaction value of model 1 are applied, and the equivalent nodal force calculated by Eq. (4) in Section 2.2 is applied to carry out dynamic analysis. The surrounding rock and lining use solid units; the viscoelastic boundary and equivalent nodal forces can be calculated by MATLAB programming and then written to the corresponding keywords of ABAQUS; The cracks of the structure are achieved using the damage mechanics extension criterion, which is achieved by the extended finite element method (XFEM).
We adopted the elastic-plastic analysis of the surrounding rock based on the D-P criterion, linear elastic analysis of initial support, and constitutive damage model of the secondary lining. The damage initiation criterion parameters of the secondary lining are based on the tensile strength value [25]. The fracture energy values reported in various literature vary from 60 to 140. This study utilized a comparative analysis, where the final value was determined, as shown in Table 3. Moreover, the surrounding rock and lining adopt three-dimensional entity units. Rayleigh damping was used in the calculation. According to the 5 % damping ratio, the two proportional coefficients of Rayleigh damping were determined as 1.785 and 0.0014.
Table 3Secondary lining parameter value
Name | Elastic modulus / GPa | Tensile strength / MPa | Fracture energy |
C25 | 28 | 1.78 | 95 |
C30 | 30 | 2.01 | 105 |
C35 | 31.5 | 2.20 | 115 |
C40 | 32.5 | 2.39 | 120 |
C45 | 33.5 | 2.51 | 125 |
C50 | 34.5 | 2.64 | 130 |
3.2. Selection of seismic waves
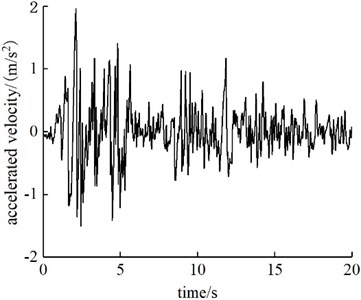
Based on the seismic data, the shear wave propagating horizontally often has a large amplitude, propagating most of the earthquake energy. Therefore, this paper mainly studies the dynamic response of cracked tunnels caused by shear waves propagating horizontally, considering the classical EL-Centro seismic wave with 0.2 g peak acceleration in the horizontal input ground motion. The adjusted acceleration-time curve of the seismic wave is shown in Fig. 3. The total calculation time was 19.98 s, and the time stepping was 0.01 s.
Fig. 3Time-history diagram of EL-Centro seismic wave acceleration
4. Dynamic internal force analysis
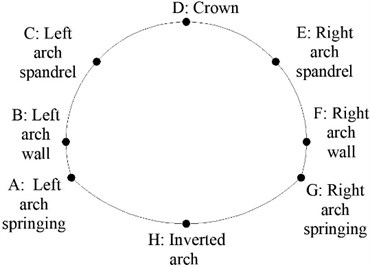
Four random variables (factors): crack depth, crack length, secondary lining thickness (or simply secondary lining), and the elastic modulus of secondary lining, are taken as the basic random variables affecting the dynamic internal force of the crack section. Table 4 lists the specific values of each parameter. When using the finite element program to calculate the dynamic internal force under the condition of single factor change, other random variables take their respective minimum values. The position of the lining control points is provided in Fig. 4.
Table 4Values of basic factors influencing dynamic internal force used in the calculation model
Consideration factors | Unit | Value | |||||
Crack depth | m | 0.05 | 0.10 | 0.15 | 0.20 | 0.25 | 0.30 |
Crack length | m | 2 | 5 | 8 | 11 | – | – |
Thickness of secondary lining | m | 0.35 | 0.40 | 0.45 | 0.50 | 0.55 | 0.60 |
Elastic modulus of secondary lining | GPa | 28 | 30 | 31.5 | 32.5 | 33.5 | 34.5 |
Fig. 4Control point layout
The maximum dynamic bending moment and axial force of each section (longitudinal length = 1 m) are extracted at the center of the crack. To visually express the changing trend of the internal force, we marked only the internal force value of the control point position in the figure.
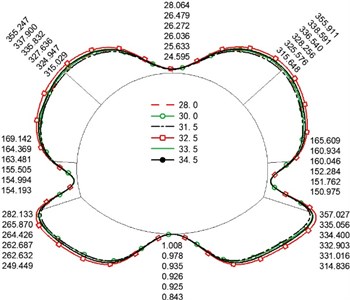
Fig. 5Maximum dynamic bending moment diagram (unit: Kn·m)
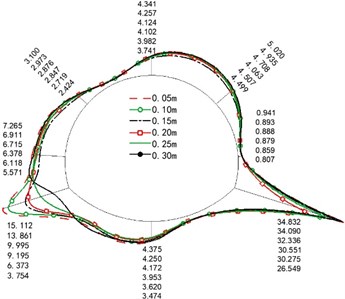
a) Crack depth
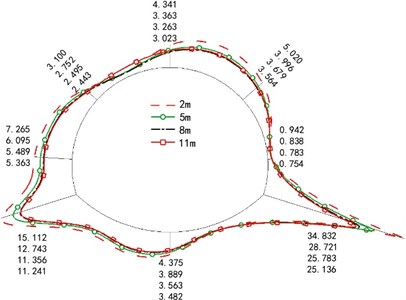
b) Crack length
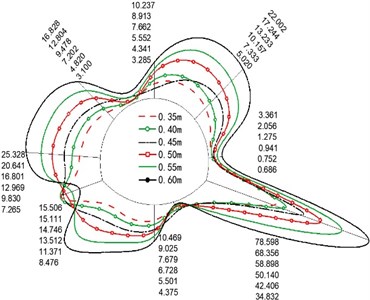
c) Thickness of secondary lining
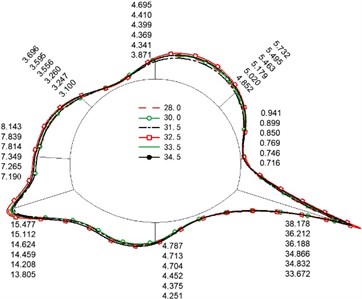
d) Elastic modulus of the secondary lining
Fig. 5 show the distribution of the maximum dynamic bending moment of four variables. Due to the asymmetric seismic load, the bending moment at the right arch foot was larger than the left arch foot because of the cracks. Its position and the internal force of the nearby parts were more prominent, followed by the right arch shoulder stress, focusing on the parts above. At the same time, we found that the crack depth and the thickness of the second lining relatively influence the internal force significantly, followed by the crack length and the elastic modulus of the second lining material (with the least influence).
With the deepening of the crack depth, the structural stiffness decreased as the bearing section at the crack reduced, while the bearing capacity was gradually lost. However, with the increase in the thickness of the second lining, the bearing capacity of each part increased significantly. The bending moment of the left arch foot crack section increased with the lining thickness. However, it decreased when the thickness exceeded 0.45 m, which was more challenging to produce bending deformation and further cracking.
Fig. 6 are the distribution diagram of the maximum dynamic axial force of the four variables. Overall, the axial force of the left and right arch shoulder and arch foot is larger, which is the shear stress of horizontal seismic wave makes the position on the diagonal of "X" bear larger tensile stress. Fig. 6(a) depicts that the increase in the crack depth leads to the rapid decrease of axial force. For example, the axial force decreased 6.15 times when the crack depth increased from 1/7H (0.05 m) to 6/7H (0.3 m).
The axial force decreased with the increase in crack length. The variable of secondary lining thickness makes the axial force show a regular trend, and the internal force increased at a gradient level of 5 %-10 % with an increase in lining thickness. The increase in secondary lining material barely affects the axial force.
Fig. 6Maximum dynamic axis force diagram (unit: Kn)
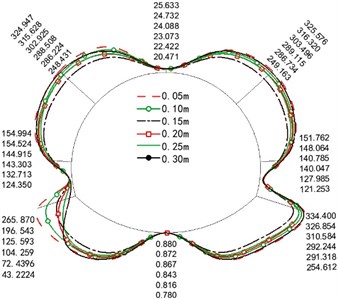
a) Crack depth
b) Crack length
c) Thickness of secondary lining
d) Elastic modulus of the secondary lining
5. Security analysis
The overall failure mode of the lining structure is difficult to determine. In design, the most dangerous lining section is generally used for safety checks to ensure lining safety. According to Eq. (8) [25], the corresponding safety factor is obtained by calculating the internal force of the lining section. Whether the safety factor meets the specified value is used as an index to evaluate the safety of the lining. However, in addition to calculating the dynamic safety factor and obtaining the minimum safety factor, the stability of the crack tip needs to be judged to evaluate the safety of the fractured tunnel. Therefore, to analyze the influence of multiple random variables on the safety of fractured tunnels, the crack is assumed to be in a stable and unexpanded state under a 0.2 g earthquake. Therefore, the variation law of dynamic safety factor is focused:
where, is the safety factor; is the lining bending moment; is the axial force of lining; is the width of the section; is the thickness of the section; is the longitudinal bending coefficient of the component; is the influence coefficient of eccentricity of the axial force; is the ultimate compressive strength of masonry; is the ultimate tensile strength of masonry; is the sectional eccentricity.
5.1. Univariate analysis
To explore the influence of single factor change on the safety of tunnel structure, we extracted the internal forces at the cross-sections of each control point at each moment. The curve of each section in the whole time history analysis under a single factor change is drawn, and the distribution of the section is obtained (Fig. a) in 7–10). At the same time, to establish the relationship between the factors and the safety factor of the crack section (mathematical model), based on the least square method, the fitting function expression corresponding to each variable (the real line in the graph) is obtained by using the MATLAB correlation function, to further analyze the influence of various factors on the left arch foot crack section. The 95 % confidence interval of the parameters (the imaginary line in the graph) is given, as shown in the b) graph in Figs. 7–10.
Fig. 7Crack depth variation
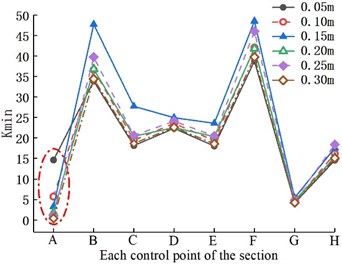
a) Safety factor of section control points
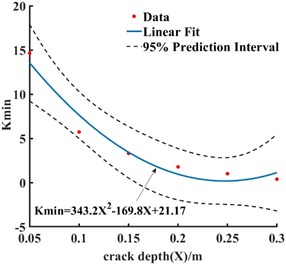
b) Fitting curve of section safety factor at the crack
In the whole dynamic analysis process, the values of the arch shoulder, arch foot, and arch bottom are small (Fig. 7(a)), and the force is relatively unfavorable, making it the weak link in the lining structure. At the same time, because the stress concentration at the crack is more pronounced, the change in the crack depth size has a greater impact on the crack area of the left arch foot. Also, the of the control section decreases gradually while the value of other control points increases slightly, having a high safety reserve. Identically, we observed that with the increase in crack depth (Fig. 7(b)), the safety factor of the crack section of the left arch foot decreased; decreased 2.5 times, especially when it deepened from 0.05 to 0.1 m (close to the 30 % of the lining thickness). Further, as the crack depth deepens to 0.2 m (close to 57 % of the lining thickness), the value became less than the specification, and the safety reserve was small. When the depth reaches 70 % of the lining thickness, attention should be paid to the lining stability.
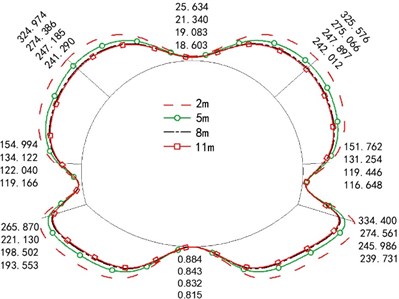
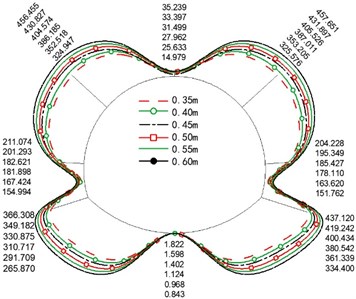
Fig. 8 illustrates that the of the cross-section increased with the crack length. The main reason was that the stress concentration at the axial tip of the crack was more severe than that in the radial direction. It also indicates that the crack would expand in the longitudinal direction first. In Fig. 9, the increases with the increase in the secondary lining thickness. The increasing trend gradually reduces when it reaches 0.45 m. In Fig. 10, the also increases with the increase in the elastic modulus of the secondary lining concrete, and the increasing trend is no longer noticeable at C35. Hence, the thickness size of the secondary lining and the strength grade of concrete were directly better when larger. The correct selection helps to control the cost.
Fig. 8Crack length variation
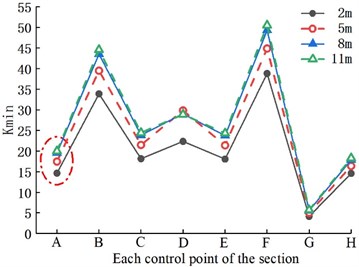
a) Safety factor of section control points
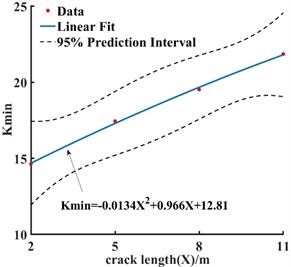
b) Fitting curve of section safety factor at the crack
Fig. 9Second lining thickness change
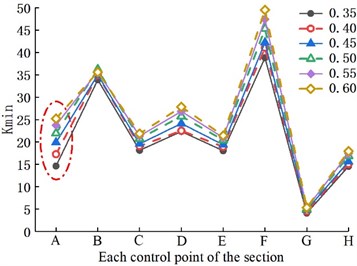
a) Safety factor of section control points
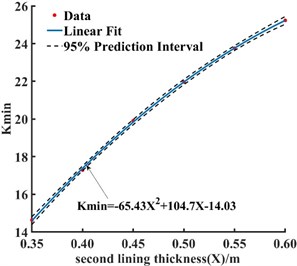
b) Fitting curve of section safety factor at the crack
Fig. 10Change in the elastic modulus of the second lining
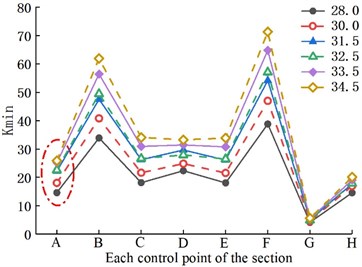
a) Safety factor of section control points
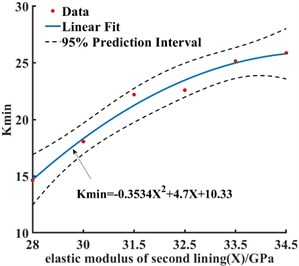
b) Fitting curve of section safety factor at the crack
In general, the safety reserve of the structural arch wall is 2-3 times that of other weak positions. Each part’s dynamic safety factor values are large, and there are sufficient safety reserves. They are all in a safe state, and the cracks are also stable. At this time, the seismic performance of the structure meets the requirements.
5.2. Multi-factor nonlinear regression analysis
From the analysis results in Section 5.1, we observed that the safety factor of the lining is inseparable from these four factors. Therefore, based on the fitting equation of each factor for the dependent variable in Section 5.1, this section constructs the following formula with the crack depth, crack length, secondary lining thickness, and secondary lining elastic modulus as independent variables:
where is the crack depth, is the crack length; is the secondary lining thickness; is the secondary lining elastic modulus independent variable; , , , , , , , and are the independent variable coefficient; is a constant coefficient.
The SPSS software established the multivariate nonlinear regression analysis, and the results are provided in Table 5 and Table 6.
Table 5Estimated nonlinear regression parameters
Parameter | Estimated value | Standard error | 95 % confidence interval | |
Lower limit | Upper limit | |||
375.457 | 47.398 | 273.059 | 477.855 | |
–0.074 | 0.042 | –0.165 | 0.016 | |
–79.155 | 47.398 | –181.553 | 23.243 | |
–7.799×10⁻²⁰ | 0.000 | –2.306×10⁻¹⁹ | 7.461×10⁻²⁰ | |
–183.674 | 15.517 | –217.196 | –150.152 | |
1.603 | 0.515 | 0.490 | 2.716 | |
118.824 | 43.761 | 24.284 | 213.364 | |
6.690×10⁻⁹ | 0.000 | –2.727×10⁻⁹ | 1.611×10⁻⁸ | |
–138.461 | 69.166 | –287.885 | 10.962 | |
Table 6Analysis of variance table
Fountain | Quadratic sum | Degree of freedom | The mean square |
Return | 6,988.959 | 9 | 776.551 |
Residuals | 9.282 | 13 | 0.714 |
Total before correction | 6,998.241 | 22 | – |
Total after correction | 1,440.523 | 21 | – |
1 – (residual sum of squares)/(Square sum after correction) = 0.994 | |||
Table 6 informs that the nonlinear regression equation is 0.994, and the fitting degree is high.
Therefore, the regression equation is as follows:
6. Interaction analysis of multiple cracks
To study the interaction between cracks, the left arch foot crack was the main crack A (designated as model 1). In contrast, the secondary crack B was arranged vertically and parallel to the upper side of the position. The spacing between the two cracks was 0.5 and 1 m, respectively, and the depth was 0.1 m. They are named model 2, model 3, model 4, and model 5.
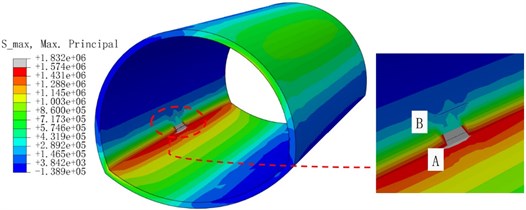
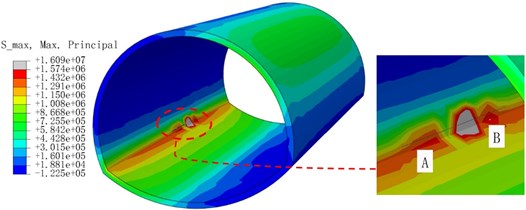
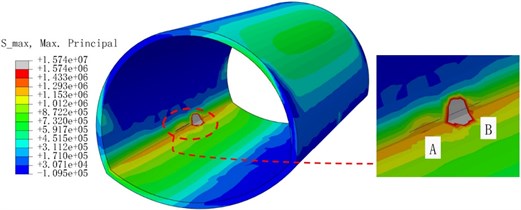
Fig. 11Cloud diagram of maximum principal stress extremum
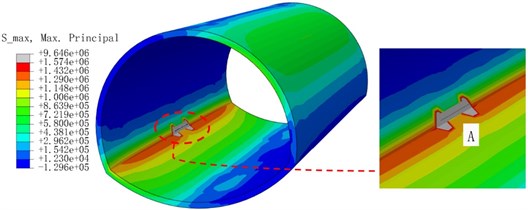
a) Model 1
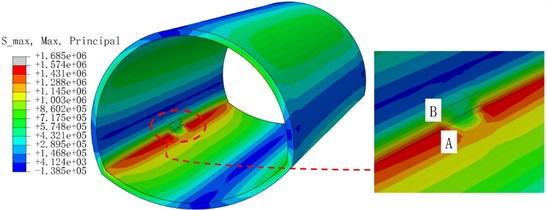
b) Model 2
c) Model 3
d) Model 4
e) Model 5
Fig. 11(a) is the cloud image of the crack model only with the left arch foot. Fig. 11(b-e) are the cloud images of the secondary cracks distributed in different directions of the main crack. The cloud images are taken as the extreme value of the maximum principal stress value in each part of the seismic loading process. We observed that the stress concentration of the cloud image was more pronounced when a secondary crack occurs in the right direction to the main crack than when the secondary crack is vertically oriented. On the one hand, the tip stress fields of the two cracks are superimposed, and the interaction is enhanced. Moreover, the previous analysis revealed that cracks are more likely to expand in the longitudinal direction. The distribution of the stress field of the main crack is weakened vertically. Overall, the stress state of the structure is more unfavorable when the two cracks are parallel.
7. Conclusions
This paper adopts single factor analysis to assess four factors (viz., crack depth, crack length, secondary lining thickness, and secondary lining elastic modulus) that influence cracks in tunnel lining structures. The dynamic bending moment and axial force of each section of the structure are extracted, and then the dynamic safety factor is calculated using the standard formula. Meanwhile, the fitting formula and 95 % confidence interval of the minimum safety factor of the crack section under each single factor change are obtained. Then, through multivariate nonlinear regression analysis, the expression of the minimum safety factor about all random variables is obtained. Finally, the degree of interaction between the two cracks is explored, and the following conclusions are drawn.
1) The internal force of the arch shoulder and arch foot is relatively apparent. The maximum dynamic bending moment distribution is the “snail” type, and the maximum dynamic axial force is the "X" diagonal type. In the single factor analysis, the crack depth and lining thickness hugely influence the internal force of the structure, especially when the crack depth increases from 1/7 to 6/7 H, the axial force decreases 6.15 times. In addition, the internal force increases at a gradient level of 5 %-10 % as the lining thickness increases.
2) With the increase in the crack depth, the safety factor of the left arch foot crack section decreases, especially when the crack depth increases from 0.05 to 0.1 m (close to the lining thickness of 30 %), and decreases 2.5 times. The value is less than the specification when the crack depth deepens to 0.2 m (close to the lining thickness of 57 %), and the safety reserve is small. Attention should be paid to the stability of the lining when the depth reaches 70 % of the lining thickness. The stress concentration at the axial tip of the crack is more evident than that in the radial direction, indicating that the crack will expand in the longitudinal direction first. As the thickness of the secondary lining increases to 0.45 m, the increasing trend of gradually slows down. The safety reserve of the structural arch wall is 2-3 times those of other weak positions.
3) The fitting degree of the multi-factor nonlinear regression equation and the accuracy of this prediction model are high, providing a specific reference for the safety performance prediction of the cracked lining.
4) The stress concentration of the two collinear parallel cracks is more prominent than that of the vertical arrangement of the secondary cracks, indicating that the tip stress fields of the two cracks have superposition and reinforcement effects, which makes the structural stress state more unfavorable.
5) In the actual project, many factors affect lining safety, so future studies can comprehensively consider establishing a safety evaluation system.
References
-
W. L. Wang, T. T. Wang, J. J. Su, C. H. Lin, C. R. Seng, and T. H. Huang, “Assessment of damage in mountain tunnels due to the Taiwan Chi-Chi Earthquake,” Tunnelling and Underground Space Technology, Vol. 16, No. 3, pp. 133–150, Jul. 2001, https://doi.org/10.1016/s0886-7798(01)00047-5
-
P.-Y. Jeannin, A. Malard, D. Rickerl, and E. Weber, “Assessing karst-hydraulic hazards in tunneling-the Brunnmühle spring system-Bernese Jura, Switzerland,” Environmental Earth Sciences, Vol. 74, No. 12, pp. 7655–7670, Dec. 2015, https://doi.org/10.1007/s12665-015-4655-5
-
L. Zhang, X. Wu, Q. Chen, M. J. Skibniewski, and J. Zhong, “Developing a cloud model based risk assessment methodology for tunnel-induced damage to existing pipelines,” Stochastic Environmental Research and Risk Assessment, Vol. 29, No. 2, pp. 513–526, Feb. 2015, https://doi.org/10.1007/s00477-014-0878-3
-
M. Proto et al., “Transport infrastructure surveillance and monitoring by electromagnetic sensing: the ISTIMES project,” Sensors, Vol. 10, No. 12, pp. 10620–10639, Nov. 2010, https://doi.org/10.3390/s101210620
-
H. Mashimo, N. Isago, T. Kitani, and T. Endou, “Effect of fiber reinforced concrete on shrinkage crack of tunnel lining,” Tunnelling and Underground Space Technology, Vol. 21, No. 3-4, pp. 382–383, May 2006, https://doi.org/10.1016/j.tust.2005.12.194
-
B. Chiaia, A. P. Fantilli, and P. Vallini, “Evaluation of crack width in FRC structures and application to tunnel linings,” Materials and Structures, Vol. 42, No. 3, pp. 339–351, Apr. 2009, https://doi.org/10.1617/s11527-008-9385-7
-
J. Lai et al., “Structural safety assessment of existing Multiarch tunnel: a case study,” Advances in Materials Science and Engineering, Vol. 2017, pp. 1–11, 2017, https://doi.org/10.1155/2017/1697041
-
A. Inokuma and S. Inano, “Road tunnels in Japan: Deterioration and countermeasures,” Tunnelling and Underground Space Technology, Vol. 11, No. 3, pp. 305–309, Jul. 1996, https://doi.org/10.1016/0886-7798(96)00026-0
-
D. Qiao, Technical Specification for Highway Tunnel Maintenance: JTG H12 – 2015. China: People’s Communications Press Co., LTD., 2015.
-
J. Lai et al., “Characteristics of seismic disasters and aseismic measures of tunnels in Wenchuan earthquake,” Environmental Earth Sciences, Vol. 76, No. 2, pp. 1–19, Jan. 2017, https://doi.org/10.1007/s12665-017-6405-3
-
Z. Chen, C. Shi, T. Li, and Y. Yuan, “Damage characteristics and influence factors of mountain tunnels under strong earthquakes,” Natural Hazards, Vol. 61, No. 2, pp. 387–401, Mar. 2012, https://doi.org/10.1007/s11069-011-9924-3
-
W. Song, H. Lai, Y. Liu, W. Yang, and Z. Zhu, “Field and laboratory study of cracking and safety of secondary lining for an existing highway tunnel in loess ground,” Tunnelling and Underground Space Technology, Vol. 88, No. 6, pp. 35–46, Jun. 2019, https://doi.org/10.1016/j.tust.2019.02.018
-
Y. Shen, B. Gao, X. Yang, and S. Tao, “Seismic damage mechanism and dynamic deformation characteristic analysis of mountain tunnel after Wenchuan earthquake,” Engineering Geology, Vol. 180, pp. 85–98, Oct. 2014, https://doi.org/10.1016/j.enggeo.2014.07.017
-
S. Hou et al., “Dynamic response of portal section of mountain tunnels under seismic SH wave action,” (in Chinese), Chinese Journal of Rock Mechanics and Engineering, Vol. 34, No. 2, pp. 340–348, 2015, https://doi.org/10.13722/j.cnki.jrme.2015.02.013
-
Z. Z. Wang, Y.-J. Jiang, C. A. Zhu, and T. C. Sun, “Shaking table tests of tunnel linings in progressive states of damage,” Tunnelling and Underground Space Technology, Vol. 50, No. 8, pp. 109–117, Aug. 2015, https://doi.org/10.1016/j.tust.2015.07.004
-
M. Antoniou, N. Nikitas, I. Anastasopoulos, and R. Fuentes, “Scaling laws for shaking table testing of reinforced concrete tunnels accounting for post-cracking lining response,” Tunnelling and Underground Space Technology, Vol. 101, No. 7, p. 103353, Jul. 2020, https://doi.org/10.1016/j.tust.2020.103353
-
T. Sun, Z. Yue, B. Gao, Q. Li, and Y. Zhang, “Model test study on the dynamic response of the portal section of two parallel tunnels in a seismically active area,” Tunnelling and Underground Space Technology, Vol. 26, No. 2, pp. 391–397, Mar. 2011, https://doi.org/10.1016/j.tust.2010.11.010
-
B. Aicha, S. Mezhoud, B. Tayeb, K. Toufik, and N. Abdelkader, “Parametric study of shallow tunnel under seismic conditions for Constantine motorway tunnel, Algeria,” Geotechnical and Geological Engineering, Vol. 40, No. 4, pp. 2307–2318, Apr. 2022, https://doi.org/10.1007/s10706-021-02029-x
-
N. A. Nariman, A. M. Ramadan, and I. I. Mohammad, “Application of coupled XFEM-BCQO in the structural optimization of a circular tunnel lining subjected to a ground motion,” Frontiers of Structural and Civil Engineering, Vol. 13, No. 6, pp. 1495–1509, Dec. 2019, https://doi.org/10.1007/s11709-019-0574-y
-
L. Z. Wang et al., “Dynamic response analyses of operational tunnel lining with cracks under great earthquake excitation,” (in Chinese), Science Technology and Engineering, Vol. 19, No. 28, pp. 325–332, 2019.
-
W. Qiu et al., “Seismic capacity assessment of cracked lining tunnel based on the pseudo-static method,” Tunnelling and Underground Space Technology, Vol. 97, p. 103281, Mar. 2020, https://doi.org/10.1016/j.tust.2020.103281
-
H. Zhang et al., “Study on dynamic response of soft rock tunnel under combined action of highgeostress and earthquake,” (in Chinese), Railway Engineering, Vol. 61, No. 6, pp. 49–53, 2021, https://doi.org/10.3969/j.issn.1003-1995.2021.06.12
-
J. B. Liu, Y. Gu, and Y. X. Du, “Consistent viscous-spring artificial boundaries and viscous-spring boundary elements,” (in Chinese), Chinese Journal of Geotechnical Engineering, Vol. 28, No. 9, pp. 1070–1075, 2006, https://doi.org/10.3321/j.issn:1000-4548.2006.09.004
-
S. P. Jiang, “Specifications for Seismic Design of Highway Tunnels: JTG/T 2232-01-2019,” Ministry of Transport of the People’s Republic of China, China, 2019.
-
S. P. Jiang, “Highway tunnel design Code: JTG 3370.1-2018,” Industry Standard of the People’s Republic of China, China, 2018.
About this article

Thanks to the funding support from National Natural Science Fund (No: 51778095).
Dongmei You wrote the manuscript. Feng Gao reviewed the manuscript. Dongmei You, Hangchen Lin and Hangling Chen processed the data and images.
