Abstract
For the seismic safety of tunnels with cavity behind lining, based on the finite element method, the viscoelastic artificial boundaries are introduced to study the influence of the location of cavity behind lining on the seismic response of tunnel structure under vertically incident SV wave. The analysis results show that the cavity behind the lining has a significant effect on the seismic response of tunnel structure, and the appearance of cavity behind lining will significantly change the dynamic characteristics of tunnel structure; when the incidence frequency of wave is close to the natural vibration frequency of tunnel structure, the lining stress has the largest amplification when the cavity appears behind the vault; Regardless of the cavity location, the maximum of lining stresses always appears at the arched foot, and the vault stress has the largest amplification; Under the Taft wave, the maximum stress 1.642 MPa of lining without cavity appears at the arched foot, and the minimum 0.118MPa at the arched waist, the stress amplification at the vault can reach about 760 %, which is unfavorable to tunnels. In addition, the soil property also has a great influence on the tunnel; the layered site will lead to the obvious change of the seismic wave, hence the geological data should be collected in detail in the seismic design of tunnel. Meanwhile it is proposed that the PE material can be filled back into the cavities behind the tunnel lining to reduce the earthquake damage of tunnels.
Highlights
- The viscoelastic artificial boundaries are introduced to study the influence of the location of cavity behind lining on the seismic response of tunnel structure under vertically incident SV wave.
- Regardless of the cavity location, the maximum of lining stresses always appears at the arched foot, and the vault stress has the largest amplification.
- It is proposed that the PE material can be filled back into the cavities behind the tunnel lining to reduce the earthquake damage of tunnels.
1. Introduction
A large number of tunnel earthquake damage investigations have shown that strong earthquakes will cause various degrees of damage to the tunnel lining structure, and the tunnel earthquake damage may be more serious when there exist some cavities behind the lining [1]. Most of the cavities behind the linings of the active tunnels such as the Uonuma Tunnel in Japan, the Haitangshan Tunnel in Liaoning Province, the Meishan Railway Tunnel in Guangdong Province and the Galongla Tunnel in Tibet have appeared. The existence of these cavities will inevitably affect the seismic performance of tunnel structure. Therefore, it is of great practical engineering importance to study the seismic performances of lining tunnel with cavity.
The seismic response of lining tunnel has been thoroughly studied by many researchers with the analytical methods and numerical methods. the wave function expansion method or the integral transform technique has been used to solve the scattering of seismic waves for a tunnel, e.g. the solutions for SH wave or for P, SV and Rayleigh waves [2-8]. However, the complexity of practical problems limits the application of analytical method, it is necessary to develop more efficient methods, which include the finite element method (FEM) [9-18], the finite difference method (FDM) [19-22] and boundary element method (BEM) [22-25]. In addition, it is worth mentioning that that the shaking table tests [27-32] also provide the beneficial engineering experiences for the seismic damage of tunnel.
It is well known that the appearance of cavity behind tunnel lining is one of the tunnel disasters. Based on the static test, the finite element method or their combination, many researchers have implemented the static analysis of the influence of the cavity behind the lining on the tunnel. Li et al. [33] combined the construction monitoring and the finite element method to study the displacement and stress characteristics of the Xishanping tunnel through coal and the goaf area, the results shows that after the tunnel is in operation, due to the disturbance of the vehicle load, it may have an adverse effect on the stability of the surrounding rock-support system. Song et al. [34] analyzed the influence of different positions, sizes and cavity groups behind the lining on the safety factor of each section of the structure by the plane elastic-plastic analysis method. The results show that the lack of tightness between the lining structure and surrounding rock is an important reason for deterioration of lining stress and lining crack. Peng et al. [35] studied the stress state of lining structure of Bayi and Xiangyang tunnels for the existence of cavity, the results show that the original equilibrium state of the lining structure will be broken by the cavity, and when there is no cavity in the vault, the lower edge of the haunch is compressed and the lower edge of the vault is tension, when there is a cavity in the vault, the stress situation is just the opposite. She et al. [36] and He et al. [37] used the model test to find that under the horizontal force, the damage caused by the cavity behind vault is greater than the one by the cavity behind the arched waist. By the elastoplastic finite element analysis, Meguid and Dang [38] studied the influence of the cavity behind the tunnel lining caused by erosion on the inner wall stress of tunnel, as a result, it is believed that the cavity size will have a huge impact on the lining. Kamel and Meguid [39] used the finite element method to investigate the influence of different cavity size and position on the tunnel lining, and believed that the appearance of cavity would cause the damage of tunnel lining structure. Zhang et al. [40] proposed a method of identifying the main cause of tunnel lining disease based on the correspondence analysis model, and studied the main cause of tunnel lining disease, the results show that the main cause of the sample tunnel lining disease are the cavity behind the lining, the insufficient lining thickness, the improper treatment of surrounding rock and the plastic ground pressure. Liu and Zhong [41] used the finite element method to analyze the internal forces of tunnels with vault cavities and the initial support structure, and the results show that the maximum positive bending moment of the tunnel appears at the vault, and the larger the cavity, the greater the bending moment. Wang et al. [42] used the elastic-plastic finite element numerical method to analyze the influence of cavities with different sizes, positions and depths on the lining, the results show that the cavity may lead to lining cracks or even damage, and change the stress distribution of surrounding rock, which is prone to greater damage. Xie and Zhou [43] used the stratum structure method to analyze the influence of the different positions and widths of the cavity behind the lining on the pressure distribution of surrounding rock, the results show that the arched waist is the most dangerous. Zhang et al.[44] studied the safety of the tunnel structure with double cavities through simulation experiments, the results show that the existence of double cavities behind the lining significantly changes the internal force distribution of the tunnel structure and deteriorates the force state of the structure. From the above static analysis, it can be seen that the cavity behind the lining has a great influence on the lining and the vault or the arched waist is prone to damage.
In terms of the dynamic research on the lining with cavity, Yu [45] used the finite element method to investigate the influence of the cavity behind the lining vault on the seismic capacity of the tunnel structure, the results show that the cavity will cause the insufficient support for the structure, thereby reduce the load-bearing performance of structure. Jiang [46] discussed the influence of factors such as the location and size of cavities by the finite element method, the analysis shows that the cavity causes the tunnel lining to bulge and deform toward the surrounding rock, the safety factor of the lining section decreases, the plastic zone of the surrounding rock increases. Zhao [47] analyzed the influence of different earthquake intensities on the acceleration and strain of the tunnel structure through the shaking table test and the finite element simulation when a cavity appears behind the lining vault, and the results show that the acceleration, stress and strain of the lining structure near the cavity will increase significantly. Based on the shaking table test, Xin et al. [48] discussed the acceleration amplification factors, tension-compression strains and damage patterns of tunnel linings, some valuable conclusions were given, e.g. the existence of void on the crown reduces the aseismic capacity and changes the damage modes of tunnel structures, the strongest seismic responses occur at lining crown, the unexpected high tension strains and annular cracks occur at the outer surface of lining crown and spandrel mainly due to the vertical excitation. Naotoshi et al. [49] combined the substructure method and the point-matching method to investigate the effect of voids on the 3D seismic response of the tunnel, the numerical results show that the presence of a void does not lead to a large stress concentration on the lining under an oblique-incidence of seismic waves. However, high correlation between large stress concentration on the lining caused by voids before an earthquake and seismic damage of tunnels is suggested.
It can be seen that the seismic dynamic response analysis of tunnels with cavities is relatively few, most of the boundary implement methods and seismic input methods are simple, and no effective improvements were proposed. In this study, the method of applying equivalent nodal forces on the viscoelastic boundary nodes is adopted to accurately simulate the ground motions of two-dimensional tunnel with cavity behind lining at both time domain and frequency domain, and the reinforcement measures for the cavity will be proposed.
2. Viscoelastic boundary and ground motion input
2.1. Viscoelastic artificial boundary
When simulating an unbounded domain, in order to eliminate the wave reflection on the truncated boundary and reduce the degree of freedom of calculation, it is necessary to deal with the local foundation boundary. The commonly used artificial boundaries include the viscous boundary, the transmission boundary and the viscoelastic boundary, where the viscous boundary is prone to the so-called overall structural drift, the transmission boundary is prone to the high-frequency instability, and the viscoelastic boundary can overcome both the low-frequency drift and the high-frequency instability[50]. Therefore, this study choose the viscoelastic artificial boundary [51-52], adopts the COMBIN14 spring element in ANSYS to simulate, and the normal and tangential spring stiffness and damping coefficients at the nodes are respectively:
where the normal spring correction coefficient 1.33, the tangential spring correction coefficient 0.67, is the foundation shear modulus, is the distance from the scattered wave source to the artificial boundary, , and are the density, the compression wave velocity and the shear wave velocity of soil, respectively, is the influence area of the boundary node.
2.2. Seismic input
When the viscoelastic boundary completely absorbs the scattered waves in the calculation area, the free field motion can be transformed into the equivalent nodal force on the artificial boundary node. He et al. [53] and Zhao et al. [54] converted the required stress of the free field into the displacement and velocity of the free field, and the free field motion can be simulated by applying equivalent nodal forces on the artificial boundary.
By the stress relationship at the viscoelastic boundary of the truncated soil, the equivalent nodal force formula on the viscoelastic artificial boundary can be obtained:
where is the stress at the corresponding node in the continuous medium, and is the stress generated by the free field motion on the viscoelastic artificial boundary of the truncated soil, and its formula is expressed as:
where is the free field displacement vector at the node.
By the substitution of Eq. (4) into Eq. (3) and the combination of one-dimensional wave theory and the constitutive equation, the vertical equivalent nodal force is zero, and the horizontal equivalent nodal force is as follows:
where is the time and is the distance from the bottom boundary to the ground surface.
3. Validation of accuracy
The accuracy will be validated by comparing the numerical results of the finite element method with the ones of the indirect boundary integral equation method in the literature. The calculation model for validation is shown in Fig. 1. The buried depth of the circular lining 10 m, the inner diameter of the lining 5 m, the outer diameter of the lining 5.2 m, the shear wave velocity of lining structure 3000 m/s, the density 2500 kg/m3, the shear wave velocity of soil 600 m/s, the density 2000 kg/m3, the Poisson ratio of soil and lining are all taken as 0.25, the damping ratio is 0.001. The mesh size of the finite element model is 0.1 m, using PLANE42 plane strain element. Fig. 2 shows the comparison with the reference [55]. It can be seen that the numerical calculation results of the two methods are in good agreement, which validates the accuracy.
Fig. 1Schematic diagram of validation model
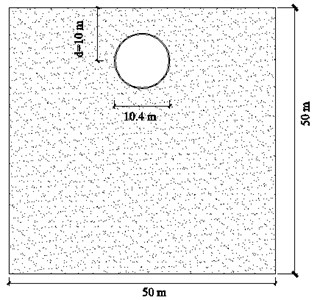
Fig. 2Comparison with the result [56]
![Comparison with the result [56]](https://static-01.extrica.com/articles/22010/22010-img2.jpg)
4. Numerical analysis
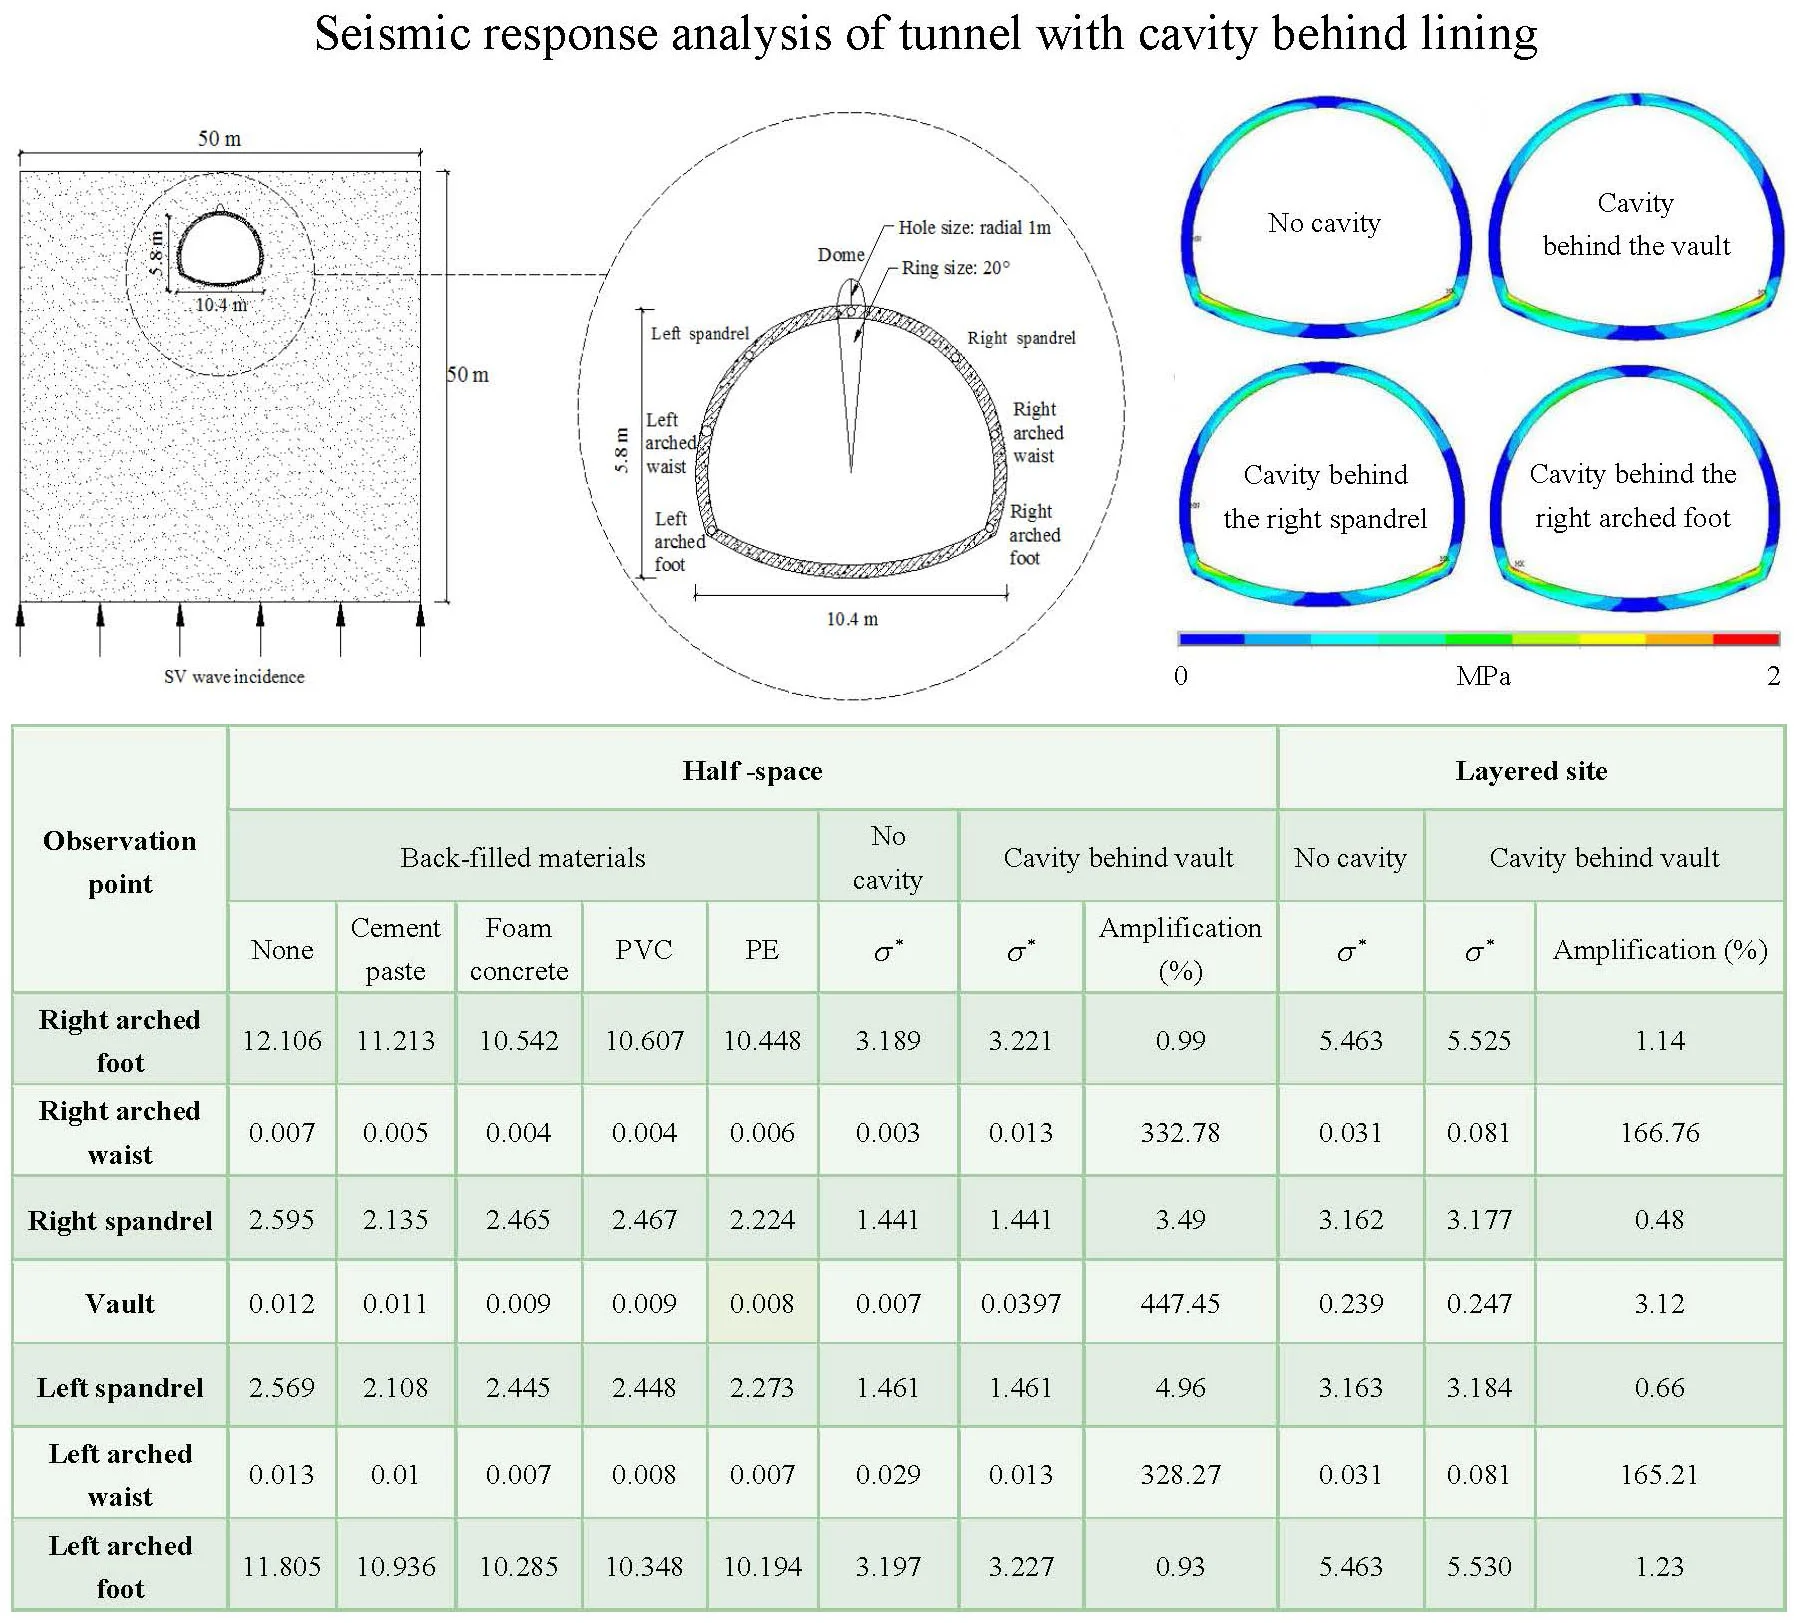
The calculation model of a lining tunnel with a cavity behind lining is shown in Fig. 3. The mesh size of the finite element model is 0.1 m, and PLANE42 plane strain elements are used. The tunnel structure parameters are shown in Table 1. To facilitate analysis, seven observation points are chosen and shown in Fig. 3. It is assumed that the plane SV wave propagates vertically from the bedrock.
The mode analysis of the finite element model is first performed, and the natural vibration frequencies corresponding to the first three modes of the structure are shown in Table 2. It can be seen that when the cavity appears behind the right spandrel or the right arched foot, the natural vibration frequency of structure changes very little, and when the cavity is behind the lining vault, the significant reduction of basic natural vibration frequency of structure demonstrates that the Cavity behind the vault greatly weakens the restraint of the surrounding rock on the lining structure and has an great impact on the dynamic characteristics of the structure.
Fig. 3Lining tunnel model with Cavity behind the vault
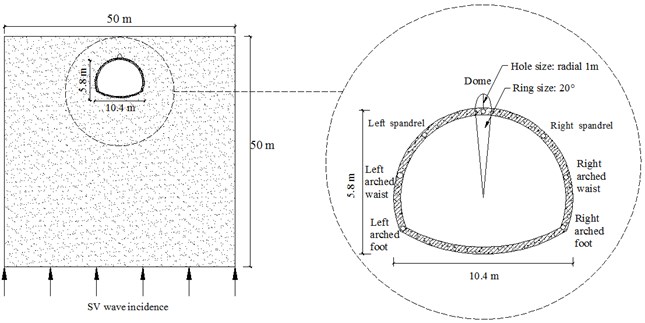
Table 1Mechanical parameters of calculation model
Tunnel structure | Elastic modulus (MPa) | Shear wave velocity (m/s) | Poisson’s ratio | Density (kg/m3) | Damping ratio |
Soil | 300 | 600 | 0.25 | 2 000 | 0.001 |
Lining | 30000 | 3000 | 0.25 | 2 500 | 0.001 |
Table 2Natural vibration frequency of lining structure/Hz
Mode | No cavity | Cavity behind the vault | Cavity behind the right spandrel | Cavity behind the right arched foot |
1 | 0.9576 | 0.3767 | 0.9582 | 0.9576 |
2 | 1.3104 | 0.8288 | 1.3102 | 1.3084 |
3 | 1.3739 | 1.0820 | 1.3744 | 1.3736 |
4.1. Frequency domain analysis of lining structure in a half space
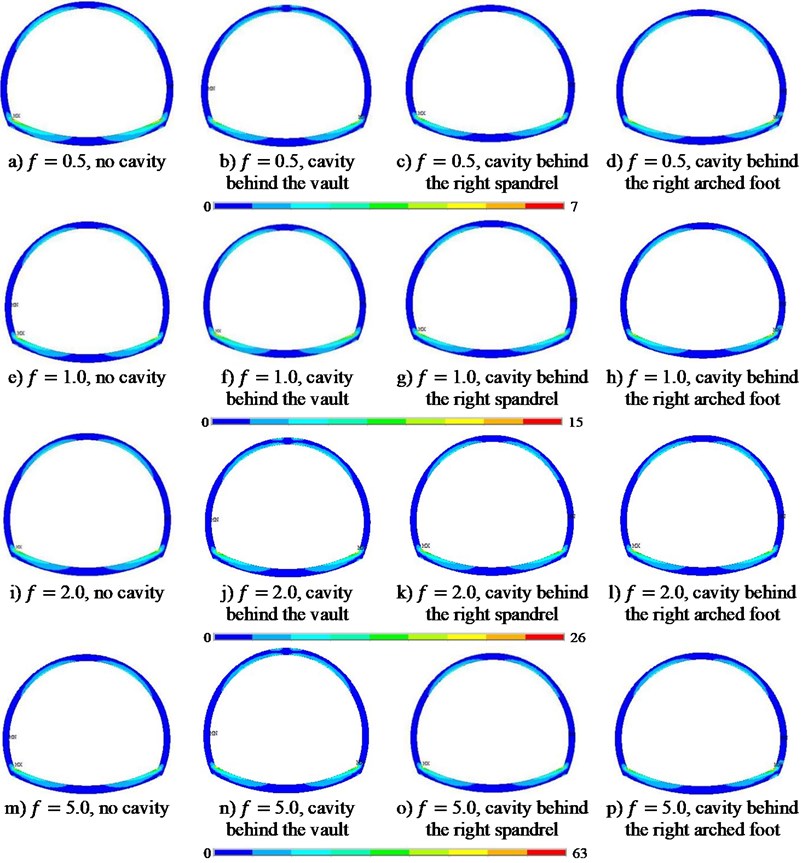
Suppose that the incident wave is the unit sine wave, the incidence frequency is 0.5 Hz, 1.0 Hz, 2.0 Hz, and 5.0 Hz, respectively. the seismic response of tunnel lining structure is calculated and analyzed for the cavity located behind the vault, the right spandrel and the right arched foot, respectively. The relative stress is defined as , where is the stress amplitude of incident wave.
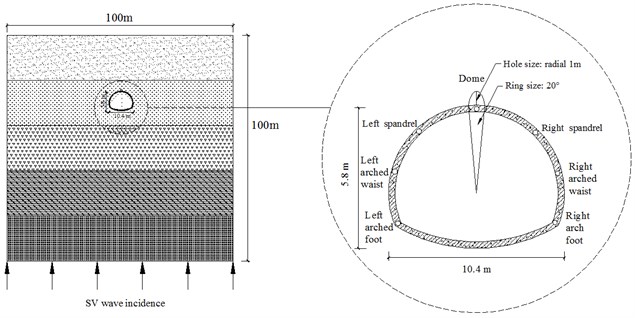
Fig. 4 shows the cloud diagram of the principal stress distribution of tunnel lining when the incidence frequency of SV wave is 0.5 Hz, 1.0 Hz, 2.0 Hz and 5.0 Hz, respectively. It can be seen that for the individual frequency, regardless of the cavity location, the maximum value (MX) of the lining stress always appears at the arch foot and the minimum (MN) always at the arched waist. In addition, as the incidence frequency of wave increases, the lining stress increases, and the lining stress distribution (relative magnitude) is analogous under different incidence frequencies.
Table 3 shows the relative amplitude of the principal stress at each observation point for 0.5 Hz, 1.0 Hz, 2.0 Hz, and 5.0 Hz, respectively. It can be seen that as the incidence frequency of wave increases, the stress of lining structure also increases. When the incidence frequency of wave is 1.0 Hz, which is close to the natural vibration frequency of tunnel structure, the resonance effect results in a significant amplification of lining stress and a nearly 6 times increase compared with the tunnel without cavity. Except for the resonance frequency 1.0 Hz, the analogous stress amplification appears for other frequencies.
Fig. 4Maximum principal stress distribution of lining structure
For the incidence frequency of wave 0.5 Hz, compared with the results of the lining without cavity, when the cavity appears behind the vault, the principal stress at the vault has the largest amplification by 194.83 %, and the stress amplification at the right arch foot is the smallest with an amplification by 1.38 %; When the cavity appears behind the right arched shoulder, the principal stress at the vault has the largest amplification by 576.99 %, and the one at the left arched foot is the smallest amplification by 0.58 %; when the cavity appears behind the right arched foot, the principal stress at the vault has the largest amplification by 975.225 % and the one at the right spandrel the smallest amplification by 0.82 %.
For the incidence frequency 1.0 Hz, compared with the no-cavity, when the cavity is behind the vault, the principal stress at the vault has the largest amplification by 762 %, and the one at the right spandrel has the smallest amplification by 44 %; When the cavity appears behind the right spandrel, the principal stress at the vault has the largest amplification by 1267.03 %, and the one at the left spandrel has the smallest amplification by 0.64 %; when the cavity appears behind the right arched foot, the principal stress at the vault has the largest amplification by 2316.69 %, the smallest amplification with 0.64 % appears at the left spandrel.
Table 3Relative principal stress at each observation point
/ Hz | Observation point | The location of cavity | |||
No cavity | Cavity behind the vault | Cavity behind the right spandrel | Cavity behind the right arched foot | ||
0.5 | Right arched foot | 5.756 | 5.836 | 5.807 | 6.956 |
Right arched waist | 0.004 | 0.004 | 0.007 | 0.006 | |
Right spandrel | 1.409 | 1.470 | 1.447 | 1.420 | |
Vault | 0.005 | 0.015 | 0.035 | 0.056 | |
Left spandrel | 1.380 | 1.444 | 1.412 | 1.421 | |
Left arched waist | 0.009 | 0.011 | 0.010 | 0.017 | |
Left arched foot | 5.616 | 5.685 | 5.648 | 5.825 | |
1.0 | Right arched foot | 10.879 | 2.140 | 10.687 | 13.053 |
Right arched waist | 0.007 | 0.013 | 0.009 | 0.002 | |
Right spandrel | 2.594 | 3.737 | 2.642 | 2.631 | |
Vault | 0.005 | 0.096 | 0.061 | 0.109 | |
Left spandrel | 2.569 | 3.714 | 2.586 | 2.602 | |
Left arched waist | 0.004 | 0.007 | 0.004 | 0.004 | |
Left arched foot | 11.125 | 2.180 | 11.675 | 11.332 | |
2.0 | Right arched foot | 21.152 | 15.041 | 21.444 | 25.624 |
Right arched waist | 0.015 | 0.024 | 0.003 | 0.026 | |
Right spandrel | 5.050 | 5.266 | 5.271 | 5.096 | |
Vault | 0.019 | 0.122 | 0.056 | 0.197 | |
Left spandrel | 4.947 | 5.066 | 5.175 | 5.093 | |
Left arched waist | 0.037 | 0.066 | 0.043 | 0.068 | |
Left arched foot | 20.636 | 20.673 | 20.890 | 21.429 | |
5.0 | Right arched foot | 51.884 | 52.760 | 52.389 | 62.925 |
Right arched waist | 0.033 | 0.040 | 0.062 | 0.057 | |
Right spandrel | 12.781 | 13.304 | 13.142 | 12.869 | |
Vault | 0.049 | 0.143 | 0.318 | 0.528 | |
Left spandrel | 12.521 | 13.065 | 12.821 | 12.890 | |
Left arched waist | 0.083 | 0.097 | 0.090 | 0.155 | |
Left arched foot | 50.637 | 51.407 | 50.955 | 52.601 | |
For the incidence frequency 2.0 Hz, when the cavity appears behind the vault, the principal stress at the vault has the largest amplification by 549.09 %, and the one at the left arch foot has the smallest amplification by 0.18 %; When the cavity is behind the right spandrel, the vault has the largest amplification by 194.76 % and the left arched foot the smallest amplification by 1.23 %; when the cavity appears behind the right arched foot, the stress amplification by the vault is the largest with 948.12 %, and the right spandrel smallest with 0.9 %.
For the incidence frequency 5.0 Hz, when the cavity is located behind the vault, the principal stress at the vault has the largest amplification by 194.41 %, and the left arched foot has the smallest amplification by 1.49 %; When the cavity is behind the right spandrel, the vault has the largest amplification by 555.92 % and the left arched foot the smallest amplification by 0.61 %; when the cavity appears behind the right arched foot, the stress amplification by the vault is the largest with 988.63 % and the right spandrel the smallest with 0.68 %.
4.2. Time domain analysis of lining structure under actual seismic wave
Taking the Taft wave as an example, the peak value is reduced to 0.1 g as seismic input. Fig. 5 shows the time history of adjusted Taft wave and its Fourier amplitude spectrum. The same calculation model as the one in Fig. 3 will be adopted for the time domain analysis, the seismic response of tunnel lining will be studied under the actual seismic wave when the cavity appear behind the vault, the spandrel and the arched foot, respectively, and the comparison analysis will be performed to determine the most unfavorable case and the most dangerous point.
Fig. 5Adjusted Taft wave and its Fourier amplitude spectrum
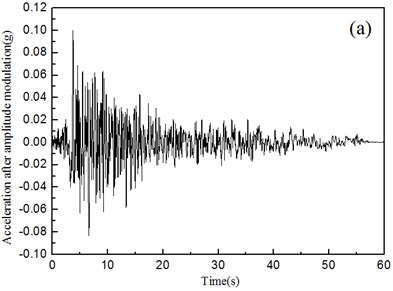
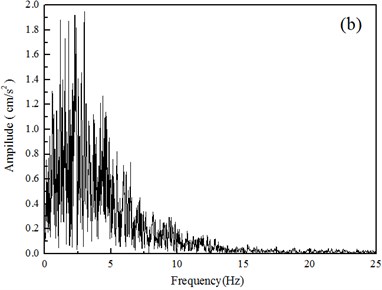
Fig. 6 shows that the time domain analysis can also derive the same trend as the frequency domain analysis, i.e. regardless of the cavity location, the maximum principal stress always appears at the arched foot and the minimum always at the arched waist. When the cavity appears behind the vault, the principal stress at the vault has the largest amplification by 758.71 %, the right arched foot by 2.76 %, the right arched waist by 23.85 %, the right spandrel by 1.97 %, the left spandrel by 4.49 %, the left arched waist by 23.8 % and the left arched foot by 6.6 %; When the cavity appears behind the right spandrel, the vault has the largest amplification by 1852.56 %, the right arched foot by 0.44 %, the right arched waist by 8.76 %, the right spandrel by 11.76 %, the left spandrel by 0.52 %, the left arched waist by 2.54 %, and the left arched foot by 2.71 %; When the cavity is behind the right arched foot, the vault and the right arched waist have a larger amplification, in which the vault amplification by 2656.05 %, the right arched foot by 15.03 %, the right arched waist by 27.6 %, the right spandrel by 8.95 %, the left spandrel by 1.04 %, the left arched waist by 6.68 % and the left arched foot by 11.9 %.
Fig. 6Maximum principal stress distribution of lining structure
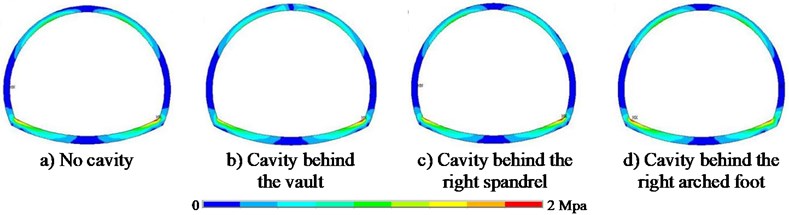
Table 4 shows the maximum principal stress and stress amplification of each observation point under the actual seismic wave. It can be seen that the maximum stress of lining is 1.642 MPa at the arched foot, and the minimum stress 0.108 MPa at the arch waist. When the cavity appears behind the lining, the vault stress has the largest amplification, especially the cavity often appears behind the vault, and the stress amplification can reach about 760 %, which is quite unfavorable to tunnels.
Table 4Maximum principal stress and stress amplification for a half space
Observation point | No cavity | Cavity behind the vault | Cavity behind the right spandrel | Cavity behind the right arched foot | |||
/ MPa | / MPa | Amplification (%) | / MPa | Amplification (%) | / MPa | Amplification (%) | |
Right arched foot | 1.642 | 1.688 | 2.76 | 1.649 | 0.44 | 1.889 | 15.03 |
Right arched waist | 0.109 | 0.134 | 23.85 | 0.118 | 8.76 | 0.138 | 27.6 |
Right spandrel | 0.511 | 0.521 | 1.97 | 0.571 | 11.76 | 0.557 | 8.95 |
Vault | 0.0006 | 0.0055 | 758.71 | 0.0126 | 1852.56 | 0.0178 | 2656.05 |
Left spandrel | 0.518 | 0.520 | 4.49 | 0.521 | 0.52 | 0.523 | 1.04 |
Left arched waist | 0.108 | 0.133 | 23.8 | 0.111 | 2.54 | 0.115 | 6.68 |
Left arched foot | 1.492 | 1.591 | 6.6 | 1.533 | 2.71 | 1.670 | 11.9 |
4.3. Stress analysis of tunnel in layered site
The stress analysis of tunnel with a cavity in a half space has been discussed above. However, it is known that the actual engineering site usually consists of different types of soil in profile. Generally, it can be assumed that the site consists of multiple horizontal layered soils, and the free-field response of site can be derived directly through the direct stiffness method [56]. The calculation model of layered site is shown in Fig. 7 and the material parameters in Table 5. Without loss of generality, it is assumed that a cavity appears behind the vault and a plane SV wave with the incidence frequency of wave 1.0 Hz propagates vertically from the bedrock.
Fig. 7The calculation model of layered site
The maximum principal stress and stress amplification for layered site is shown in Table 6. It can be seen that, regardless of the half space or the layered site, the maximum stress of tunnel lining structure always appears at the arched foot and the minimum stress at the arched waist. However, there exist some difference between the results of the half space and the ones of the layered site, e.g. for the layered site, the largest amplification of stress occurs at the arched waist with an amplification by 166.76 %, followed by the vault by 3.12 %, which was much smaller than the amplification for the half space, the smallest amplification by 0.48 % occurs at the spandrel; for the half space, the largest amplification of stress occurs at the vault with an amplification by 447.45 %, followed by the arched waist by 332.78 %, the smallest amplification occurs at the arched foot with an amplification by 0.93 %, which illustrates that the soil properties have a significant influence on the tunnel, the layered site can cause the obvious change of seismic wave, so the geological data should be collected in detail in the seismic design of tunnel.
Table 5Mechanical parameters of calculation model
Soil layer | Thickness of soil layer / m | S-wave velocity / m/s | P-wave velocity / m/s | Elastic modulus / MPa | Density / kg/m³ | Damping |
1 | 20 | 150 | 280 | 103 | 1750 | 0.05 |
2 | 20 | 175 | 327 | 141 | 1775 | 0.05 |
3 | 20 | 200 | 374 | 187 | 1800 | 0.05 |
4 | 20 | 250 | 467 | 300 | 1850 | 0.05 |
5 | 20 | 300 | 561 | 445 | 1900 | 0.05 |
Table 6Maximum principal stress and stress amplification for layered site
Observation point | Half space | Layered site | ||||
No cavity | Cavity behind vault | No cavity | Cavity behind vault | |||
Amplification (%) | Amplification (%) | |||||
Right arched foot | 3.189 | 3.221 | 0.99 | 5.463 | 5.525 | 1.14 |
Right arched waist | 0.003 | 0.013 | 332.78 | 0.031 | 0.081 | 166.76 |
Right spandrel | 1.441 | 1.441 | 3.49 | 3.162 | 3.177 | 0.48 |
Vault | 0.007 | 0.0397 | 447.45 | 0.239 | 0.247 | 3.12 |
Left spandrel | 1.461 | 1.461 | 4.96 | 3.163 | 3.184 | 0.66 |
Left arched waist | 0.029 | 0.013 | 328.27 | 0.031 | 0.081 | 165.21 |
Left arched foot | 3.197 | 3.227 | 0.93 | 5.463 | 5.530 | 1.23 |
4.4. Reinforcement measures for the cavity behind tunnel lining
The treatment of lining void disease can be divided into two categories, i.e. back-filled grouting and lining reinforcement. Taking the most unfavorable situation that the cavity appears behind the vault as an example, the calculation model is shown in Fig. 3, where the incidence frequency of wave is 1.0 Hz. The different materials are filled separately back into the cavity to investigate the engineering safety, and the material parameters from the literature [57] are shown in Table 7.
Table 7Parameters of lining and back-filled materials
Material | Density (Kg/m³) | Elastic modulus (GPa) | Poisson’s ratio | |
Lining | C30 concrete | 2500 | 31 | 0.2 |
Back-filled material | Cement paste | 2000 | 15 | 0.25 |
Foam concrete | 300 | 4 | 0.21 | |
PVC tube + Cement paste | 1400 | 3.5 | 0.2 | |
PE ball + Cement paste | 1000 | 0.55 | 0.3 | |
Table 8 shows the relative principal stress at observation points when the different materials are separately filled back into the cavity. It can be seen that the back-filling of cement paste, foam concrete, PVC tube + Cement paste or PE ball + Cement paste into the cavity behind vault can lead to the obvious reduction of lining principal stress and thus effectively eliminates the impact of cavity on the safety of tunnels in service, in which the PE material with the smaller elastic modulus has the better reduction effect than other materials, especially for the arched foot and vault of lining. In general, the PE material without active chemical properties has the advantages of excellent corrosion resistance, high toughness and low cost, and can be used normally for about fifty years, which can reduce the engineering cost and earthquake risk of tunnels.
Table 8Relative principal stress at observation points for different back-filled materials
Observation point | Back-filled materials | ||||
Cavity behind vault | Cement paste | Foam concrete | PVC | PE | |
Right arched foot | 12.106 | 11.213 | 10.542 | 10.607 | 10.448 |
Right arched waist | 0.007 | 0.005 | 0.004 | 0.004 | 0.006 |
Right spandrel | 2.595 | 2.135 | 2.465 | 2.467 | 2.224 |
Vault | 0.012 | 0.011 | 0.009 | 0.009 | 0.008 |
Left spandrel | 2.569 | 2.108 | 2.445 | 2.448 | 2.273 |
Left arched waist | 0.013 | 0.01 | 0.007 | 0.008 | 0.007 |
Left arched foot | 11.805 | 10.936 | 10.285 | 10.348 | 10.194 |
5. Conclusions
Aiming at the seismic safety of tunnel structure with cavity behind the lining, the viscoelastic artificial boundary and equivalent node force load are introduced, and the influence of cavity behind the lining on the seismic response of tunnel structure is studied and analyzed by finite element method. Taft seismic wave is introduced in the time domain solution. In the frequency domain solution, the equivalent load in the time domain is transformed into the equivalent load in the frequency domain through fast Fourier transform, and harmonic response analysis is introduced. This paper mainly studies the influence of cavity on the seismic response of lined tunnel in frequency domain and time domain, and the seismic response analysis of lined tunnel with cavity in layered site. Finally, the reinforcement measures of cavity behind tunnel lining are put forward.
1) The location of cavity behind the lining has a significant impact on the lining structure. The cavity behind the spandrel or arced foot of the lining has less impact on the dynamic response of the lining structure, while the common cavity behind the vault will significantly change the dynamic characteristics of the structure. When the cavity appears behind the vault, the vault stress has the largest amplification, and when the cavity is behind the spandrel or the arch foot, the vault or the arched waist stress has the larger amplification.
2) Regardless of the cavity location, the maximum lining stress always appears at the arched foot and the minimum at the arched waist. However, it should be noted that the largest amplification, up to about 760 % under the Taft wave, of vault stress easily leads to the vault damage, which is unfavorable to the tunnel in a half space; hence the cavity behind vault should be detected and repaired thoroughly for the tunnels in service.
3) Regardless of the half space or the layered site, the maximum lining stress always appears at the arched foot and the minimum at the arched waist. However, the difference from the result of the half space that the largest amplification is at the vault and the smallest at the arced foot is that the largest amplification of stress occurs at the arched waist and the minimum one at the spandrel shoulder. Therefore, except the vault, the attention should also be paid to the unfavorable effect of cavity on the arched waist.
4) The influence of several materials filled into the cavity on the lining stress is analyzed and it is found that the lining stress can be reduced to certain extent, in particular, the PE material has the better reduction effect and its reduction can reach over 10 %. It is proposed that the PE material can be chosen and filled back into the cavities behind the tunnel lining to reduce the earthquake damage of tunnels.
This study preliminarily explores the seismic response of tunnel lining with rock cavity, and the influence of other factors, such as the oblique incidence of seismic wave, wave type and nonlinearity, on the lining structure needs to be further studied.
References
-
Ge S. S., “Causes analysis on cavity behind tunnel primary support,” (in Chinese), Transportation Standardization, Vol. 13, pp. 110–112, 2012.
-
V. W. Lee and M. D. Trifunac, “Response of tunnels to incident SH-Waves,” Journal of the Engineering Mechanics Division, Vol. 105, No. 4, pp. 643–659, Aug. 1979, https://doi.org/10.1061/jmcea3.0002511
-
J. Liang, H. Luo, and V. W. Lee, “Diffraction of plane SH waves by a semi-circular cavity in half-space,” Earthquake Science, Vol. 23, No. 1, pp. 5–12, Feb. 2010, https://doi.org/10.1007/s11589-009-0084-4
-
C. A. Davis, V. W. Lee, and J. P. Bardet, “Transverse response of underground cavities and pipes to incident SV waves,” Earthquake Engineering and Structural Dynamics, Vol. 30, No. 3, pp. 383–410, Mar. 2001, https://doi.org/10.1002/eqe.14
-
J.-W. Liang, H. Zhang, and V. W. Lee, “A series solution for surface motion amplification due to underground group cavities: Incident P waves,” Acta Seismologica Sinica, Vol. 17, No. 3, pp. 296–307, May 2004, https://doi.org/10.1007/s11589-004-0052-y
-
Q. Liu and R. Wang, “Dynamic response of twin closely-spaced circular tunnels to harmonic plane waves in a full space,” Tunnelling and Underground Space Technology, Vol. 32, pp. 212–220, Nov. 2012, https://doi.org/10.1016/j.tust.2012.07.001
-
H. Yu, Z. Zhang, J. Chen, A. Bobet, M. Zhao, and Y. Yuan, “Analytical solution for longitudinal seismic response of tunnel liners with sharp stiffness transition,” Tunnelling and Underground Space Technology, Vol. 77, pp. 103–114, Jul. 2018, https://doi.org/10.1016/j.tust.2018.04.001
-
X. Zhang, Y. Jiang, G. Wang, Y. Cai, and T. Iura, “Three-dimensional seismic performance of mountain tunnel with imperfect interface considering P wave,” Tunnelling and Underground Space Technology, Vol. 108, p. 103720, Feb. 2021, https://doi.org/10.1016/j.tust.2020.103720
-
M. Karakus, A. Ozsan, and H. Başarır, “Finite element analysis for the twin metro tunnel constructed in Ankara Clay, Turkey,” Bulletin of Engineering Geology and the Environment, Vol. 66, No. 1, pp. 71–79, Feb. 2007, https://doi.org/10.1007/s10064-006-0056-z
-
I. Shahrour, F. Khoshnoudian, M. Sadek, and H. Mroueh, “Elastoplastic analysis of the seismic response of tunnels in soft soils,” Tunnelling and Underground Space Technology, Vol. 25, No. 4, pp. 478–482, Jul. 2010, https://doi.org/10.1016/j.tust.2010.01.006
-
Zhuang H. Y., Long H., and Chen G. X., “Analysis of the nonlinear earthquake responses of a large complicated subway underground station,” Earthquake Engineering and Engineering Vibration, Vol. 33, No. 2, pp. 192–199, 2013.
-
Y. B. Yang, H.-H. Hung, K.-C. Lin, and K.-W. Cheng, “Dynamic response of elastic half-space with cavity subjected to P and SV waves by finite/infinite element approach,” International Journal of Structural Stability and Dynamics, Vol. 15, No. 7, p. 1540009, Oct. 2015, https://doi.org/10.1142/s021945541540009x
-
K. C. Lin, H. H. Hung, J. P. Yang, and Y. B. Yang, “Seismic analysis of underground tunnels by the 2.5D finite/infinite element approach,” Soil Dynamics and Earthquake Engineering, Vol. 85, pp. 31–43, Jun. 2016, https://doi.org/10.1016/j.soildyn.2016.03.005
-
Q. Sun and D. Dias, “Seismic behavior of circular tunnels: influence of the initial stress state,” Soil Dynamics and Earthquake Engineering, Vol. 126, p. 105808, Nov. 2019, https://doi.org/10.1016/j.soildyn.2019.105808
-
Yu H. T., Zhang Z. W., and Li P., “Improved equivalent response acceleration method for seismic design of underground structures,” Rock and Soil Mechanics, Vol. 41, No. 7, pp. 2401–2410, 2020, https://doi.org/10.16285/j.rsm.2019.1324
-
W. Qiu et al., “Seismic capacity assessment of cracked lining tunnel based on the pseudo-static method,” Tunnelling and Underground Space Technology, Vol. 97, p. 103281, Mar. 2020, https://doi.org/10.1016/j.tust.2020.103281
-
D. Lyu et al., “Effects of oblique incidence of SV waves on nonlinear seismic response of a lined arched tunnel,” Shock and Vibration, Vol. 2020, pp. 1–12, Feb. 2020, https://doi.org/10.1155/2020/8093804
-
Liang J. W., Zhu Y. Z., Zhao H., and Ba Zh. N., “Study on applicability of integral forced response displacement method for seismic analysis of shield tunnel,” (in Chinese), Earthquake engineering and engineering vibration, Vol. 40, No. 3, pp. 1–10, 2020.
-
M. Cai, “Influence of stress path on tunnel excavation response – Numerical tool selection and modeling strategy,” Tunnelling and Underground Space Technology, Vol. 23, No. 6, pp. 618–628, Nov. 2008, https://doi.org/10.1016/j.tust.2007.11.005
-
D. Deb and K. C. Das, “Bolt-grout interactions in elastoplastic rock mass using coupled FEM-FDM techniques,” Advances in Civil Engineering, Vol. 2010, pp. 1–13, 2010, https://doi.org/10.1155/2010/149810
-
G. D. Manolis, S. L. Parvanova, K. Makra, and P. S. Dineva, “Seismic response of buried metro tunnels by a hybrid FDM-BEM approach,” Bulletin of Earthquake Engineering, Vol. 13, No. 7, pp. 1953–1977, Jul. 2015, https://doi.org/10.1007/s10518-014-9698-6
-
E. Sandoval and A. Bobet, “Effect of input frequency on the seismic response of deep circular tunnels,” Soil Dynamics and Earthquake Engineering, Vol. 139, p. 106421, Dec. 2020, https://doi.org/10.1016/j.soildyn.2020.106421
-
A. Rodriguez-Castellanos, “Multiple scattering of elastic waves by subsurface fractures and cavities,” Bulletin of the Seismological Society of America, Vol. 96, No. 4A, pp. 1359–1374, Aug. 2006, https://doi.org/10.1785/0120040138
-
H. Alielahi, M. Kamalian, and M. Adampira, “Seismic ground amplification by unlined tunnels subjected to vertically propagating SV and P waves using BEM,” Soil Dynamics and Earthquake Engineering, Vol. 71, pp. 63–79, Apr. 2015, https://doi.org/10.1016/j.soildyn.2015.01.007
-
H. Alielahi and M. Adampira, “Evaluation of 2D seismic site response due to hill-cavity interaction using boundary element technique,” Journal of Earthquake Engineering, Vol. 22, No. 6, pp. 1137–1167, Jul. 2018, https://doi.org/10.1080/13632469.2016.1277437
-
Chen G. X. et al., “Analysis of large-scale shaking table test of dynamic soil-subway station interaction,” Engineering and Engineering Vibration, Vol. 27, No. 2, pp. 171–176, 2007, https://doi.org/10.13197/j.eeev.2007.02.027
-
Shen Y. S. et al., “Research on model test of mountain tunnel in high seismic intensity area,” Modern Tunnelling Technology, Vol. 45, No. 5, pp. 38–43, 2008.
-
G. Tsinidis, E. Rovithis, K. Pitilakis, and J. L. Chazelas, “Seismic response of box-type tunnels in soft soil: Experimental and numerical investigation,” Tunnelling and Underground Space Technology, Vol. 59, pp. 199–214, Oct. 2016, https://doi.org/10.1016/j.tust.2016.07.008
-
Q. Ren et al., “Experimental study on acceleration response laws of shallow-buried bias tunnels with a small distance,” Journal of Vibroengineering, Vol. 22, No. 7, pp. 1661–1673, Nov. 2020, https://doi.org/10.21595/jve.2020.21374
-
C. Su, T. Baizan, Z. Haiyang, W. Jianning, L. Xiaojun, and Z. Kai, “Experimental investigation of the seismic response of shallow-buried subway station in liquefied soil,” Soil Dynamics and Earthquake Engineering, Vol. 136, p. 106153, Sep. 2020, https://doi.org/10.1016/j.soildyn.2020.106153
-
X. Cheng, X. Zhou, H. Liu, Y. Zhou, and W. Shi, “Numerical analysis and shaking table test of seismic response of tunnel in a loess soil considering rainfall and traffic load,” Rock Mechanics and Rock Engineering, Vol. 54, No. 3, pp. 1005–1025, Mar. 2021, https://doi.org/10.1007/s00603-020-02291-0
-
C. M. Darli, T. Aiping, H. Delong, and Z. Jiqiang, “Large scale shaking table model test and analysis on seismic response of utility tunnel in non-homogeneous soil,” Earthquake Engineering and Engineering Vibration, Vol. 20, No. 2, pp. 505–515, Apr. 2021, https://doi.org/10.1007/s11803-021-2035-6
-
Li X. H. et al., “Study on deformation character of surrounding rock masses and numerical modeling of Xishanping tunnel through coal and working out area,” Chinese Journal of Rock Mechanics and Engineering, Vol. 21, No. 5, pp. 667–670, 2002.
-
Song R. G. and Zhang D. L., “Analysis on cause of fracturing failure of tunnel lining,” The Chinese Journal of Geological Hazard and Control, Vol. 15, No. 4, pp. 69–72, 2004.
-
Peng N. et al., “Numerical analysis of mechanical properties of tunnel lining with cavities at vault,” in 10th Symposium on Soil Mechanics and Geotechnical Engineering of Chinese society of Civil Engineering, 2007.
-
She J. et al., “Study on effect of cavities behind linings on bearing capacity of tunnel structure by model test,” Highway and Transportation Science and Technology, Vol. 25, No. 1, pp. 104–110, 2008.
-
He C. et al., “Research on effect of inner surface reinforcing on structure bearing capacity by model test in defective tunnel,” Rock and Soil Mechanics, Vol. 30, No. 2, pp. 406–412, 2009, https://doi.org/10.16285/j.rsm.2009.02.015
-
M. A. Meguid and H. K. Dang, “The effect of erosion voids on existing tunnel linings,” Tunnelling and Underground Space Technology, Vol. 24, No. 3, pp. 278–286, May 2009, https://doi.org/10.1016/j.tust.2008.09.002
-
Kamel S. and Meguid M. A., “A three-dimensional study of the effect of soil erosion on rigid pipes,” North American Society for Trenchless Technology, p. F104, 2011.
-
Zhang S. L. et al., “Discovering the main causes of tunnel lining damage based on correspondence analysis model,” China Railway Science, Vol. 33, No. 2, pp. 54–58, 2012.
-
Liu H. R. and Zhong Z. L., “The effect of cavity in vault on the stability of tunnel surrounding rock and primary lining,” Chinese Journal of Underground Space and Engineering, Vol. 10, No. 3, pp. 619–623, 2014.
-
J. Wang, H. Huang, X. Xie, and A. Bobet, “Void-induced liner deformation and stress redistribution,” Tunnelling and Underground Space Technology, Vol. 40, pp. 263–276, Feb. 2014, https://doi.org/10.1016/j.tust.2013.10.008
-
Xie F. and Zhou Y., “Research on influence of cavities behind the lining of highway tunnels on pressure distribution of wall rocks,” Technology of Highway and Transport, Vol. 3, pp. 100–104, 2014.
-
Zhang C. P. et al., “Effect of double voids behind lining on safety state of tunnel structures,” Chinese Journal of Geotechnical Engineering, Vol. 37, No. 3, pp. 487–493, 2015.
-
Yu Y. Y., “Study on seismic damage mechanism of mountain tunnel lining structure,” Recent Development in World Seismology, Vol. 4, p. 48, 2014.
-
Jiang Y. B., “Study on the influence of cavity behind lining on dynamic stability of tunnels,” Master Thesis, China University of Mining and Technology, 2015.
-
Zhao H. J., “Study on the influence of tunnel top voids on the dynamic characteristics of tunnels in a certain district,” Master Thesis, Hebei University of Technology, 2016.
-
C. L. Xin, Z. Z. Wang, and B. Gao, “Shaking table tests on seismic response and damage mode of tunnel linings in diverse tunnel-void interaction states,” Tunnelling and Underground Space Technology, Vol. 77, pp. 295–304, Jul. 2018, https://doi.org/10.1016/j.tust.2018.03.010
-
N. Yasuda, K. Tsukada, and T. Asakura, “Three-dimensional seismic response of a cylindrical tunnel with voids behind the lining,” Tunnelling and Underground Space Technology, Vol. 84, pp. 399–412, Feb. 2019, https://doi.org/10.1016/j.tust.2018.11.026
-
He C. R., Yan L., and Liu Z. X., “Influence of urban intensive building groups on the ground motion amplification effect of an alluvial valley,” China Earthquake Engineering Journal, Vol. 41, No. 4, pp. 1035–1045, 2019.
-
L. Jingbo and L. Yandong, “A direct method for analysis of dynamic soil-structure interaction based on interface idea,” Developments in Geotechnical Engineering, Vol. 31, No. 3, pp. 261–276, 1998, https://doi.org/10.1016/s0165-1250(98)80018-7
-
Liu J. B., Du Y. X., and Yan Qiushi, “The implementation of viscous-spring boundary and seismic motion input in general finite element software,” Chinese Journal of Disaster Prevention and Mitigation Engineering, Vol. 27, pp. 37–42, 2007.
-
He J. T. et al., “Method and realization of seismic motion input of viscous-spring boundary,” Chinese Journal of Hydraulic Engineering, Vol. 41, No. 8, pp. 960–969, 2010.
-
Zhao W. S. et al., “Research on method of seismic motion input in aseismic analysis for underground structure,” China Civil Engineering Journal, Vol. 43, pp. 554–559, 2010.
-
Liu Z. X., Liang J. W., and Zhang H., “Scattering of plane P and SV waves by a lined tunnel in elastic half space (Ⅱ): numerical results,” Journal of Natural Disasters, Vol. 19, No. 4, pp. 77–88, 2010.
-
Wolf J. P., Dynamic Soil-structure Interaction. Englewood Cliffs: Prentice-Hall, 1985.
-
Fan Y. J. et al., “Remediation technology for the long segment and large-scale cavity behind vault linings of an operating railway tunnel,” Railway Standard Design, Vol. 64, No. 11, pp. 116–121, 2020.
Cited by
About this article

This work was supported by the National Natural Science Foundation of China under grants (No. 51878434, No. 51908401), the Key projects of Tianjin Natural Science Foundation of China (No. 18JCZDJC39200) and Tianjin Municipal Science and Technology Bureau (No. 19PTZWHZ00080). All supports are gratefully acknowledged.
