Abstract
The mechanical characteristics of coral reef sandy soil is significantly different from the sand and clay soils. Currently, Terzaghi's bearing capacity equation is still commonly applied to evaluate the bearing capacity of coral reef, while the calculation result is not consistent with the actual condition. Based on a port project in east Africa, plate loading test of the coral reef sandy soil has been conducted and the P-S curves are obtained, and the bearing capacity values obtained from the plate loading test results are compared with the calculated results based on the Terzaghi’s bearing capacity equation. According to multiple linear regression and the optimal regression equation selected by the significance test, the modified Terzaghi foundation equation of bearing capacity in coral reef sandy soil area is proposed, and the modified Terzaghi foundation equation has important reference value for the calculating of the bearing capacity of the coral reef sandy soil foundations.
Highlights
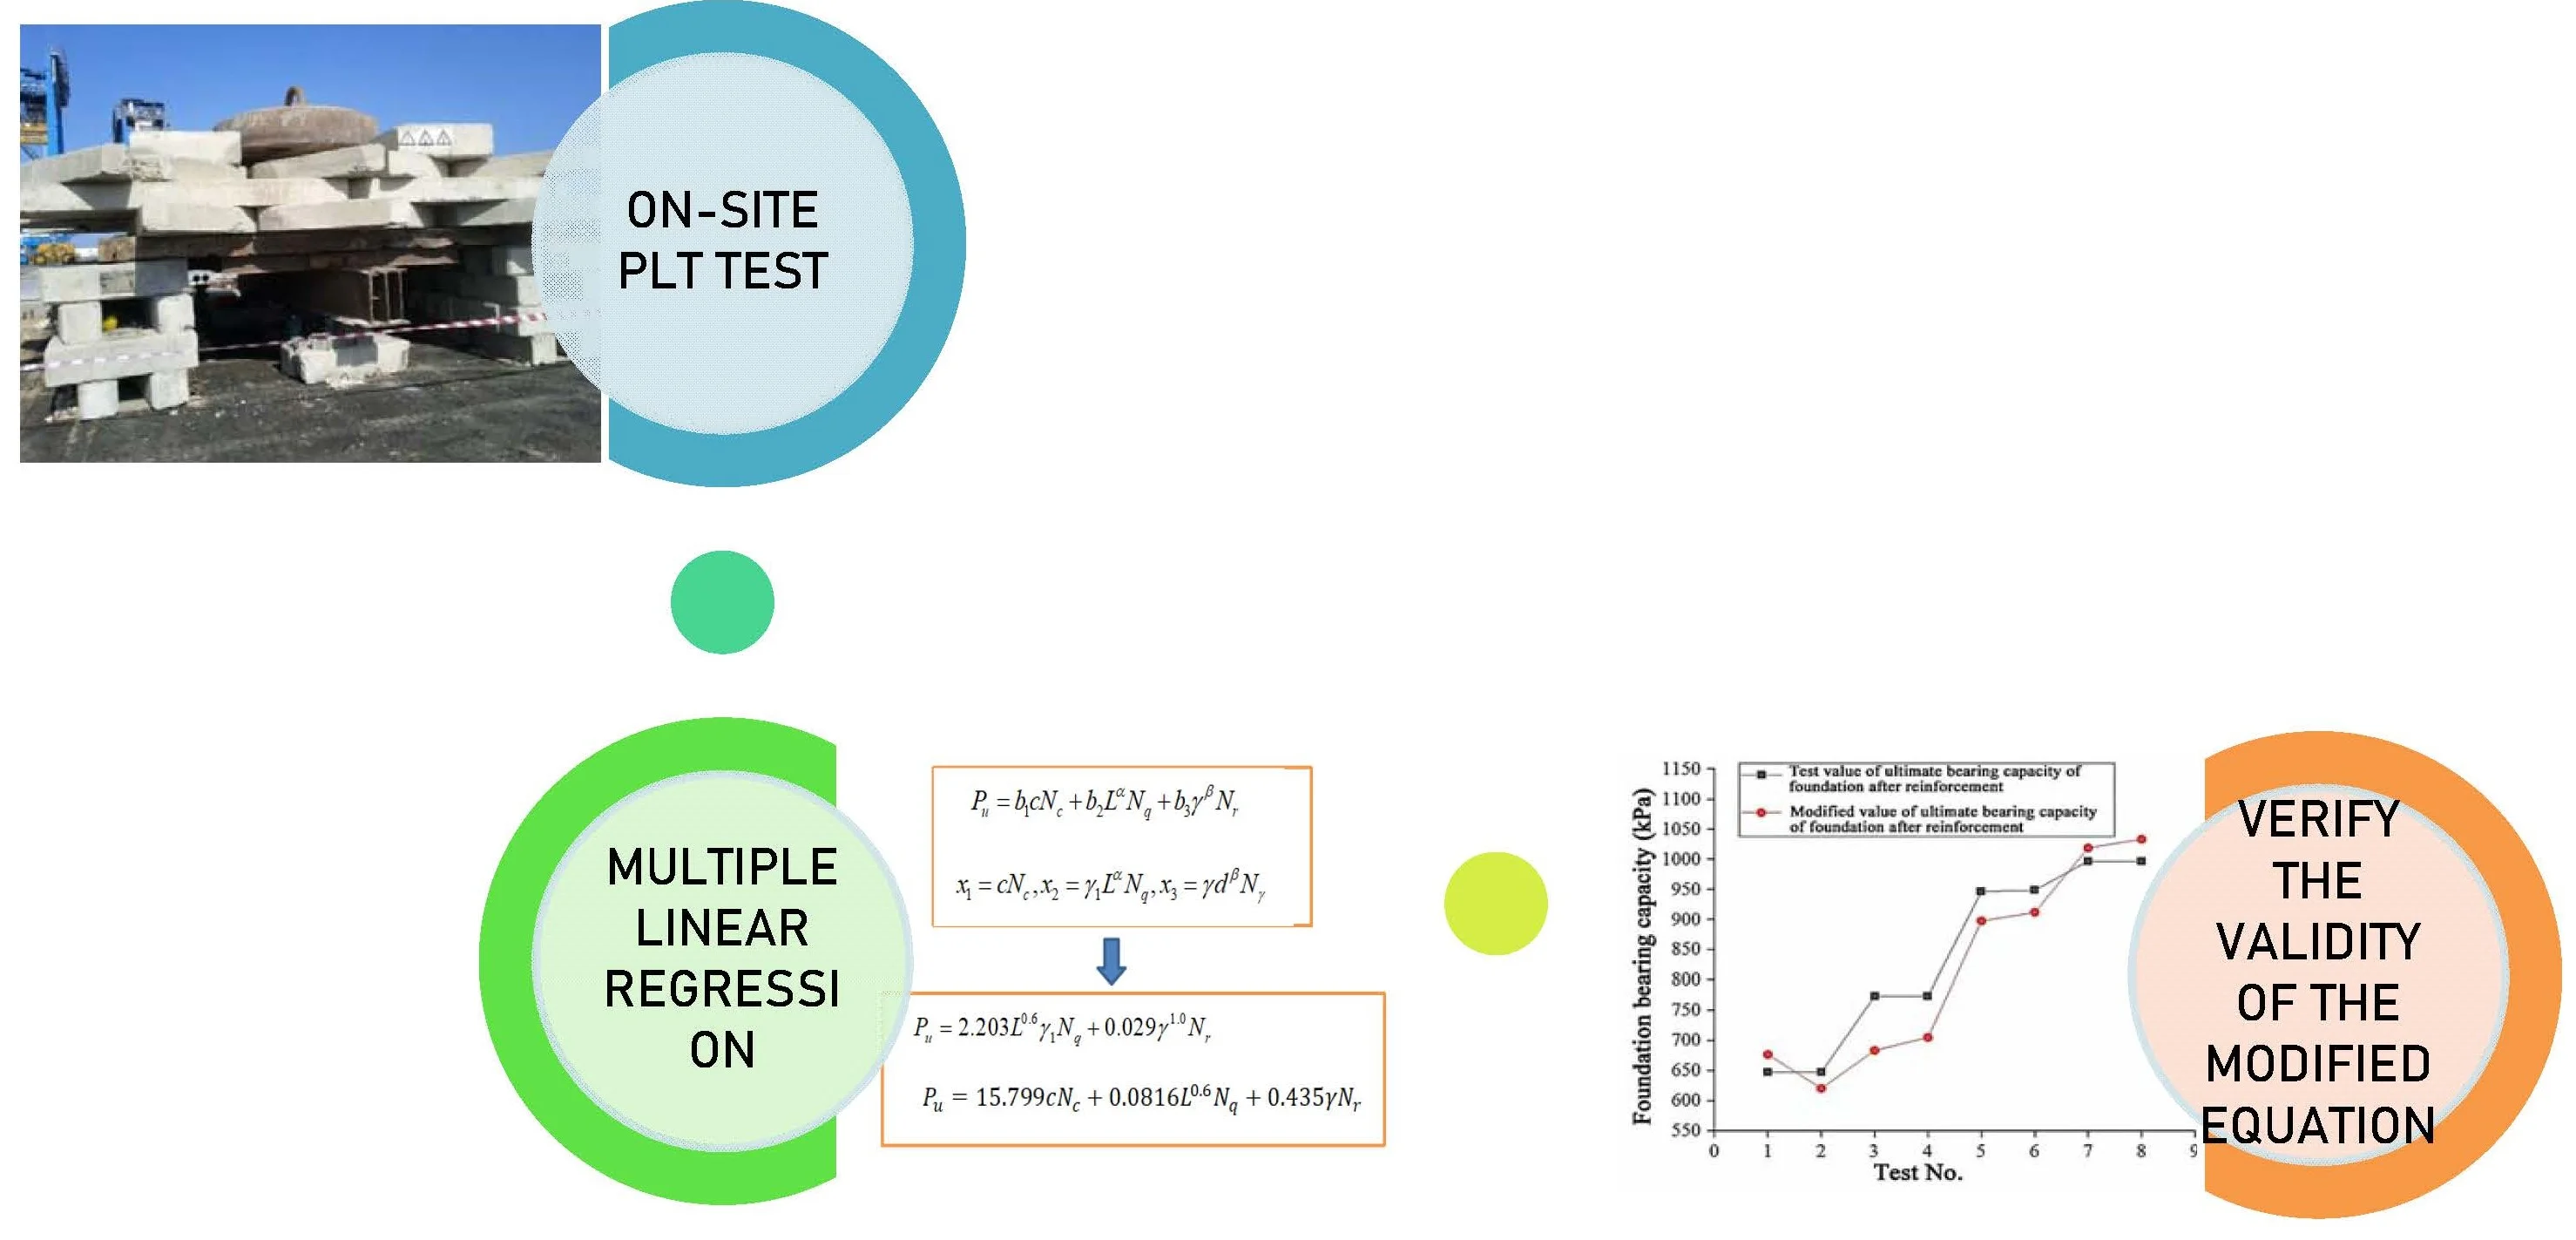
- Based on the project in East Africa, a further research has been conducted for the coral reef sandy soil through on-site Plate Loading Test
- Classify, summarize the PLT test results through multiple linear regression and the optimal regression equation selected by the significance test, the modified Terzaghi foundation equation of bearing capacity in coral reef sandy soil area is proposed
- Verify the validity of the modified Terzaghi's foundation equation of bearing capacity in coral reef sandy soil with the test results and estimate the accuracy and the error range
1. Introduction
Coral reef sandy soil is a special natural geological body mainly formed by coral reefs and their associated microorganisms after a series of biochemical processes under different natural geological conditions. It primarily features friable particles in irregular shapes, high content of calcium carbonate, and a high void ratio, which allows it to have special engineering mechanical properties compared with general soil bodies. According to the classical theory of soil mechanics, solid particles are incompressible and unbreakable. However, coral reef particles are easily broken due to various types of intragranular pores and have high friction angles and high compressibility. It is believed that particle breakage is the major factor affecting deformation and strength [1], making coral sand differ significantly from terrigenous sand formed in continental deposits in terms of engineering mechanical properties [2]-[4]. Coral reef sandy soil has so far not been listed as a category in the Code for Investigation of Geotechnical Engineering in China, and with respect to the bearing capacity of the coral reef sandy soil foundation [5], relatively few experimental studies have been conducted by domestic and foreign scholars. Zhu [6] et al. analyzed the bearing capacity characteristics of the coral sand foundation through field tests and pointed out that the deformation modulus of the foundation soil is positively correlated with the blow count N10 of the light dynamic penetration test. The test results of Wang [7] et al. showed that the bearing capacity and deformation modulus of artificially filled coral soil foundations were significantly higher than those of naturally formed reef flat facies and sandbank foundations and that the resilient modulus of coral soil increased with the increase of the degree of compaction; Yang et al. [8] using the least square method proved the correlativity between the eigenvalue of foundation bearing capacity and the blow count N of standard penetration test (SPT) and the blow count N63.5 of heavy dynamic penetration test with modified eigenvalue of foundation bearing capacity; Li et al. [9] conducted a plate loading model test study on coral sand foundation and found that the settlement of coral sand was 50 % to 67 % of the value calculated with the empirical equation. Huang et al. [10] pointed out that the effective overlaying stress increases with the increasing of the buried depth of the soil layer and groundwater level. On the whole, few studies on the ultimate bearing capacity of the coral reef sandy soil foundation have been conducted at home and abroad. The conventional Terzaghi's bearing capacity equation is still employed to calculate the bearing capacity of the coral reef sandy soil foundation, however, the calculation result is usually inconsistent with what is actually measured and cannot meet the actual engineering needs.
2. Field plate loading test
2.1. Test program
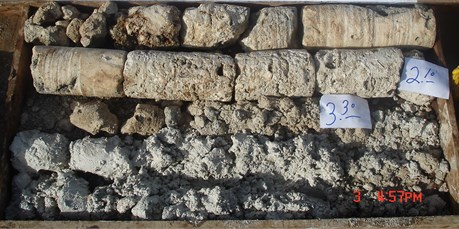
Based on a container terminal project in East Africa, the strata disclosed at the site of geotechnical investigation are mainly coral reef limestone and its debris formed by biochemical sedimentation, as shown in Fig. 1. According to the geological survey and SPT, the SPT blow count of the surface coral reef backfill is about 8 to 12; the second stratum, consisting of 2 to 8 m thick undisturbed coral reef limestone residual soil, has an SPT blow count of about 18, and a local SPT blow count of less than 8. The stratum downward is strongly weathered coral reef limestone, with an SPT blow count of about 30. The coral reef backfill is bulky and powdery granular soil. The foundation composed of such type of soil is generally treated through vibration rolling, dynamic compaction, etc.
Fig. 1Core sample of coral reef sandy soil foundation
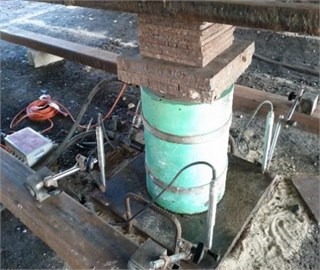
The coral reef backfill was treated by dynamic compaction and vibration rolling of different energy levels, and shallow plate loading tests were conducted on the coral reef sandy soil before and after reinforcement, as shown in Fig. 2 and Fig. 3.
Fig. 2Field plate loading test
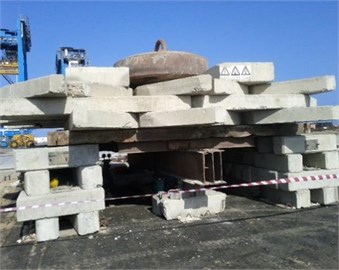
Fig. 3Plate Size 0.5×0.5 m
The tests were conducted according to the requirements, procedures and machinery of the loading test as specified in the 2018 edition of Code for Investigation of Geotechnical Engineering [11]. The test site was divided into four test zones, i.e. vibration rolling zone, and 500 kJ, 1000 kJ and 3000 kJ dynamic compaction zones and in each zone, eight points were selected. For further determination of the effect of reinforcement, the plate loading tests were conducted in the test zones respectively before and after the reinforcement. During the test, the measuring points were arranged in the center of the vibration rolling zone and between the rammers in the dynamic compaction test zones. The deformation modulus was calculated by using Eq. (1) as follows:
where is the deformation modulus (MPa); is the shape factor of the loading plate (0.886 for a square loading plate); is the total load (kPa); is the settlement (mm) under the effect of total load imposed on the plate; is the side length of the plate (0.50 m here); is the Poisson’s ratio (0.27 for gravelly soil and 0.30 for sandy soil).
The 0.5 m×0.5 m plate used in the field loading test was loaded in levels according to the actual situation, and a load of 100 kPa was added at each level. It was decided to end the test (that is, to stop loading) when the soil body extruded significantly around the loading plate or the soil body around the loading plate presented obvious uplift or radial crack propagation. The P-S value was summarized and the P-S curve as shown in Fig. 4 was drawn to evaluate the reinforcement effect of the backfilled foundation.
Fig. 4P-S Curve of loading test before and after reinforcement of test zone
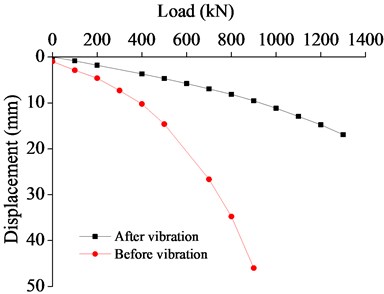
a) Before and after vibration
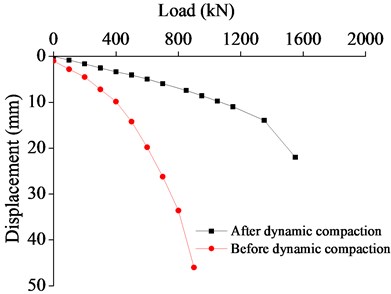
b) Before and after dynamic compaction (500 kJ)
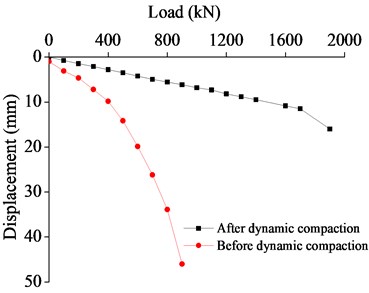
c) Before and after dynamic compaction (1000 kJ)
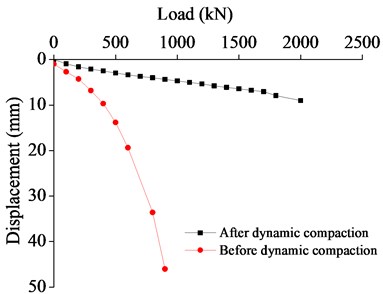
d) Before and after dynamic compaction (3000 kJ)
As can be seen from the above figures, the P-S curve of coral reef backfill gradually drops and nearly becomes a straight line, lacking the three typical and obvious stages of the typical P-S curve and making it difficult to acquire the proportional limit.
2.2. Determination of bearing capacity
The bearing capacity of coral reef foundation soil can be determined according to the relevant specifications on coral reef geology in the Code for Investigation of Geotechnical Engineering [11] and the Code for Geotechnical Investigation on Port and Waterway Engineering [12], that is, for the relatively flat section of the P-S curve, the stress corresponding to a relative settlement of not greater than 0.02 is taken as the allowable bearing capacity; if the ultimate load is smaller than twice the , is taken as the allowable bearing capacity. Considering the high compressibility of coral sand, (0.02, 1/2) for general clay or soft soil is taken as the eigenvalue of bearing capacity . Then, the ultimate bearing capacities obtained from the plate loading test on the foundation soil before and after reinforcement are shown in the Table 1 and Table 2.
Table 1Results of plate loading test on foundation soil before reinforcement
Test No. | Depth (m) | Diameter of loading plate (m) | Ultimate bearing capacity (KN) |
SY-1 | 0.5 | 0.5 | 410 |
SY-2 | 0.5 | 0.5 | 410 |
SY-3 | 0.5 | 0.5 | 430 |
SY-4 | 0.5 | 0.5 | 430 |
SY-5 | 0.5 | 0.5 | 420 |
SY-6 | 0.5 | 0.5 | 420 |
SY-7 | 0.5 | 0.5 | 430 |
SY-8 | 0.5 | 0.5 | 430 |
Table 2Results of plate loading test on foundation soil after reinforcement
Test No. | Reinforcing method | Depth (m) | Diameter of loading plate (m) | Ultimate bearing capacity (KN) |
SY-1 | Vibration rolling | 0.5 | 0.5 | 650 |
SY-2 | Vibration rolling | 0.5 | 0.5 | 650 |
SY-3 | 500 kJ dynamic compaction | 0.5 | 0.5 | 775 |
SY-4 | 500 kJ dynamic compaction | 0.5 | 0.5 | 775 |
SY-5 | 1000 kJ dynamic compaction | 0.5 | 0.5 | 950 |
SY-6 | 1000 kJ dynamic compaction | 0.5 | 0.5 | 950 |
SY-7 | 3000 kJ dynamic compaction | 0.5 | 0.5 | 1000 |
SY-8 | 3000 kJ dynamic compaction | 0.5 | 0.5 | 1000 |
3. Modification of Terzaghi’s bearing capacity equation
Regarding the bearing characteristics of the foundation, Terzaghi proposed a theoretical equation for the calculation of the ultimate bearing capacity considering the foundation dead load as early as 1940. Over the years, although many scholars have modified the equation according to different construction conditions, the form of the equation for the ultimate bearing capacity of the foundation has not changed, and only the bearing capacity coefficient has been adjusted according to different engineering geological conditions. Moreover, the mechanical properties of coral reef calcareous soil are different from those of common sandy soil and clay foundations. Considering that derivation is to be conducted for the backfilled foundation, the original Terzaghi’s bearing capacity equation for a shallow foundation is therefore listed for further derivation. In 1943, scholars first proposed an equation for calculating the bottom bearing capacity of a shallow foundation based on the failure mechanism of the shallow foundation:
where, is the equivalent volumetric weight of the soil body above the foundation in kN.m-3; is the diameter of the pile foundation in m; is the volumetric weight of the foundation soil in kN/m3; c is the cohesion of the foundation soil. , and are the foundation bearing capacity coefficients, and the equations are as shown from Eq. (4) to Eq. (6):
where, is the internal friction angle of the foundation soil in deg.
Although the ultimate bearing capacity equation proposed by Terzaghi for circular foundations is widely used, it is relatively simple and is not applicable to specific geological stratum. Therefore, the ultimate bearing capacity results obtained from the field plate loading test are used as the reference to verify the calculation results of the original equation. The deformation modulus is calculated for the foundation soil under each level of load applied in the plate loading test and the results are summarized in Table 3. For the calculation with the Terzaghi’s bearing capacity equation, the natural volumetric weight of coral reef sandy soil is taken as 17.2 kN.m-3, the cohesion of coral reef sandy soil is almost 0 and the internal friction angle varies within the range of 40-42°.
Table 3Calculation results of unmodified Terzaghi’s bearing capacity equation for foundation before reinforcement
Test No. | Depth (m) | Diameter of loading plate (m) | Cohesion (kPa) | Internal friction angle (°) | Deformation modulus (kPa) | Ultimate bearing capacity (kN) |
SY-1 | 0.5 | 0.5 | 0 | 41.11 | 11.22 | 1016.3716 |
SY-2 | 0.5 | 0.5 | 0 | 41.06 | 11.02 | 1008.7585 |
SY-3 | 0.5 | 0.5 | 0 | 40.49 | 8.74 | 926.4538 |
SY-4 | 0.5 | 0.5 | 0 | 40.4 | 8.4 | 914.1885 |
SY-5 | 0.5 | 0.5 | 0 | 40.97 | 10.69 | 995.2185 |
SY-6 | 0.5 | 0.5 | 0 | 42.02 | 14.89 | 1167.5714 |
SY-7 | 0.5 | 0.5 | 0 | 40.59 | 9.16 | 940.3092 |
SY-8 | 0.5 | 0.5 | 0 | 40.39 | 8.37 | 912.8324 |
Note: The internal friction angle and deformation modulus in the Table are obtained by regression analysis of the SPT blow count | ||||||
According to Table 3, the values calculated with unmodified Terzaghi’s bearing capacity equation for the foundation before reinforcement deviate significantly from the measured ones, about twice greater. As a result, the original Terzaghi's bearing capacity equation is not applicable to the coral reef sandy soil foundation and cannot be directly used in engineering design.
3.1. Modification of Terzaghi's bearing capacity equation for foundation before reinforcement
The theoretical equation is mainly modified with the mathematical statistics method. The coefficients in the original equation are modified based on the mathematical statistics analysis for the plate loading test. According to previous research results, there is a nonlinear relationship between the bearing properties of the foundation soil and the mechanical parameters of the soil body including cohesion and internal friction angle. Therefore, the power function fitting is used to modify the bearing capacity parameter, as shown in Eq. (7) and Eq. (8):
The power law constants and vary in the range of 0.5 to 1.0. For , the acting forms of cohesion and internal friction angle remain unchanged. , , are calculated using Eqs. (4), (5) and (6). After the relationship between and the two variables is analyzed, Terzaghi’s ultimate bearing capacity equation is kept unchanged for comparison with the theoretical equation. The variables are included in a trinomial equation to acquire the hypothetical regression equation, as shown in Eq. (9):
where, , , and are regression coefficients, and other parameters have the same meanings as defined above. Regression analysis is conducted based on the eight bearing capacity test values in the Table in combination with mathematical statistics.
To simplify the analysis steps, the following assumptions are made: , , . Then the above equation can be transformed into the Eq. (10):
The above equation is a multivariate linear equation. With different values assumed for and , the corresponding regression coefficients , and are solved according to the linear regression equation. Then the significance test is conducted to select the optimal regression equation. It is assumed that the ultimate bearing capacity value is a dependent variable and , and are independent variables that vary with the variation of the internal friction angle . Thus, the internal friction angle is defined as the variable factor of the multivariate linear equation. Considering that all three independent variables are selected through the correlation coefficient method, the screening step is not considered during the regression analysis.
“INPUT” is selected as the regression method for full regression analysis. By comparing the linear correlation coefficient, likelihood ratio, regression equation fitting information and its significance level, and the significance level of the linear coefficient standard value, it is found that when 0.6 and 1.0, the regression equation has the highest significance level and the best goodness of fit; the coefficient of multiple determination is 0.981; the linear regression coefficients are as follows: 0, 2.203, 0.029. Thus, the regression equation is shown in Eq. (11):
The multiple linear regression model passes the F-test and the significance level of the linear regression equation is found to be very high according to the residual statistics. In addition, the standardized predicted value based on regression analysis also passes the T-test and presents a high significance level. Through the T-test with a 90 % confidence level, it is determined that the significance levels of regression coefficients , and meet the requirements.
Table 4Fitting information of bearing capacity regression equation
Variable name | Standardized coefficient | Significance | Tolerance | T-test | VIF |
0 | 0.919 | 0.27 | 0.536 | 3.70 | |
2.203 | 0.943 | 0.34 | 0.518 | 2.94 | |
0.029 | 0.908 | 0.34 | 0.684 | 2.94 |
Based on the above analysis results, Terzaghi's bearing capacity equation for foundation before reinforcement is shown in Eq. (12):
where is the equivalent volumetric weight of the soil body above the foundation in kN.m-3; is the diameter of the pile foundation in m; is the volumetric weight of the foundation soil in kN/m-3; is the cohesion of the foundation soil.
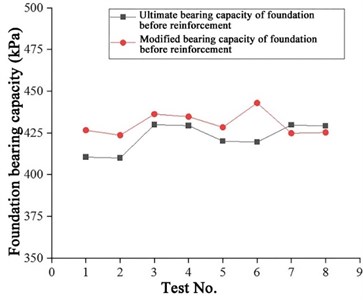
Terzaghi’s ultimate bearing capacity coefficients remain unchanged as , , , and their values can be calculated with Eqs. (4), (5) and (6) respectively. The internal friction angle and cohesion are put into the fitting equation of the bearing capacity for foundation before reinforcement, and the calculated results are compared with the actual measured values. It can be seen from Fig. 5 that the calculated values are different from the actual measured values. Most results of the modified Terzaghi’s theoretical bearing capacity equation is larger than the measured values, but the values differ from each other generally within a small range, not exceeding 10 %.
Fig. 5Comparison between modified value and measured value curves before reinforcement
3.2. Modification of Terzaghi’s bearing capacity equation for foundation before reinforcement
The field loading test values of the bearing capacity for the foundation after reinforcement are summarized as shown in Table 5. It can be found that after vibration rolling and dynamic compaction, the cohesion of the soil body has increased compared with that before reinforcement, but limited to a small scale, and its value is taken within the range of 0-1; the internal friction angle has increased significantly compared with that before reinforcement, indicating that the strength of the soil body has been further improved, and the ultimate bearing capacity of the foundation has increased significantly. Now Terzaghi's bearing capacity equation for foundation is modified, mainly by the same steps as stated above.
It can be seen from Table 5 that the calculation results of the bearing capacity are rather large by using the original Terzaghi’s bearing capacity equation for coral reef sandy soil foundation after reinforcement. They deviate largely from the measured data and are about 2 times larger, and some 3 times larger. The calculation results of the unmodified Terzaghi’s bearing capacity equation for coral reef sandy soil present large errors and are inconsistent with the actual engineering conditions.
The assumed regression equation is the same as Eq. (11). When different values are assumed for and , the corresponding regression coefficients , and are solved according to the linear regression equation, and then the significance testing is conducted to select the optimal regression equation. It is assumed that the ultimate bearing capacity value is the dependent variable and , and are independent variables and vary with the variation of the internal friction angle , so the internal friction angle ψ is defined as the variable factor of the multivariate linear equation. Considering that all three independent variables are selected through the correlation coefficient method, the screening step is not considered during the regression analysis. Inputs are selected in the regression method for full regression analysis. By comparing the indicators including linear correlation coefficient, likelihood ratio, regression equation fitting information and its significance level, and the significance level of the linear coefficient standard value, it is found that when 0.6, 1.0, the regression equation is at the highest significance level. At this time, the fitting of the equation is optimal. The coefficient of multiple determination is 0.827, and the linear regression coefficients are as follows: 18.799, 0.0816, 0.735, then the modified Terzaghi’s foundation bearing capacity equation after reinforcement are shown in Eq. (13) and Eq. (14):
where is the equivalent volumetric weight of the soil body above the foundation in kN.m -3; is the diameter of the pile foundation in m; is the volumetric weight of the foundation soil in kN/m-3; is the cohesion of the foundation soil.
Table 5Calculation results of original Terzaghi's bearing capacity equation for foundation before reinforcement
Test No. | Reinforcing method | Depth | Diameter of loading plate | Cohesion | Internal friction angle | Deformation modulus | Ultimate bearing capacity |
SY-1 | Vibration rolling | 0.5 | 0.5 | 0~10 | 48.65 | 41.38 | 1378.2393 |
SY-2 | Vibration rolling | 0.5 | 0.5 | 0~10 | 48 | 38.81 | 1228.0331 |
SY-3 | 500 kJ dynamic compaction | 0.5 | 0.5 | 0~10 | 47.16 | 35.42 | 1061.7567 |
SY-4 | 500 kJ dynamic compaction | 0.5 | 0.5 | 0~10 | 47.23 | 35.73 | 1074.5639 |
SY-5 | 1000 kJ dynamic compaction | 0.5 | 0.5 | 0~10 | 50.03 | 46.92 | 1776.1019 |
SY-6 | 1000 kJ dynamic compaction | 0.5 | 0.5 | 0~10 | 50.27 | 47.87 | 1858.5464 |
SY-7 | 3000 kJ dynamic compaction | 0.5 | 0.5 | 0~10 | 52.17 | 55.48 | 2700.6564 |
SY-8 | 3000 kJ dynamic compaction | 0.5 | 0.5 | 0~10 | 53.21 | 59.63 | 3352.9516 |
Note: The internal friction angle and deformation modulus in the Table are obtained by regression analysis of the SPT blow count | |||||||
The multiple linear regression model passes the F-test and the significance level of the linear regression equation is found to be very high according to the residual statistics. In addition, the normal expected value of regression analysis also passes the T-test and presents a high significance level. Through the T-test with the confidence level at 90 %, it is determined that the significance levels of regression coefficients , and meet the requirements.
Table 6Fitting information of bearing capacity regression equation
Variable name | Standardized coefficient | Significance | Tolerance | T-test | VIF |
15.799 | 0.961 | 0.32 | 0.52 | 3.12 | |
0.0816 | 0.832 | 0.38 | 0.639 | 2.63 | |
0.435 | 0.826 | 0.41 | 0.672 | 2.42 |
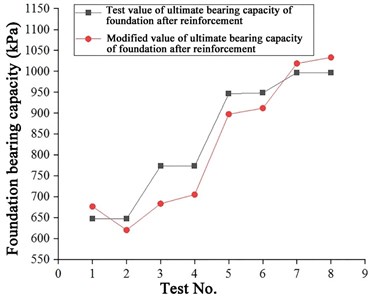
Terzaghi’s ultimate bearing capacity coefficients remain unchanged as , , . After calculation, the internal friction angle and cohesion are put into the fitting equation of the foundation bearing capacity after reinforcement, and the calculated results are compared with the measured values. It can be seen from Fig. 6 that the calculated values are different from the measured values. Most results of Terzaghi’s theoretical bearing capacity equation are smaller than the field measured values. Among them, the modified value of bearing capacity after 500 kJ dynamic compaction differs from the test value largely, nearly 10 %. The modified values after other reinforcement measures are basically consistent with the test values, generally with a small deviation. This modified equation can provide a feasible method for calculating the bearing capacity of the coral reef sandy soil or calcareous soil foundation after reinforcement.
Fig. 6Comparison between modification value and measured value curves after reinforcement
4. Conclusions
Based on the field plate loading test data and the multiple linear regression model, the optimal regression equation is selected out through the significance testing and Terzaghi’s bearing capacity equation is modified. The modified bearing capacity equations suitable for foundations in the coral reef sandy soil area are proposed, which are Terzaghi’s bearing capacity equations for coral reef sandy soil foundation before and after reinforcement, and these two equations provide a simple and practical method for determining the bearing capacity of coral reef sandy soil foundations in the Red Sea Area and provide a certain reference for engineering construction in similar areas.
References
-
N. Stark, R. Wilkens, V. B. Ernstsen, M. Lambers-Huesmann, S. Stegmann, and A. Kopf, “Geotechnical properties of sandy seafloors and the consequences for dynamic penetrometer interpretations: quartz sand versus carbonate sand,” Geotechnical and Geological Engineering, Vol. 30, No. 1, pp. 1–14, Feb. 2012, https://doi.org/10.1007/s10706-011-9444-7
-
H. Shahnazari and R. Rezvani, “Effective parameters for the particle breakage of calcareous sands: An experimental study,” Engineering Geology, Vol. 159, pp. 98–105, Jun. 2013, https://doi.org/10.1016/j.enggeo.2013.03.005
-
Y. Jafarian, H. Javdanian, and A. Haddad, “Dynamic properties of calcareous and siliceous sands under isotropic and anisotropic stress conditions,” Soils and Foundations, Vol. 58, No. 1, pp. 172–184, Feb. 2018, https://doi.org/10.1016/j.sandf.2017.11.010
-
Bai Xiaoyu, “Study on geotechnical properties of calcareous soil,” Geotechnical Engineering, Qingdao University of Technology, 2010.
-
Wang Xinzhi et al., “Interlocking mechanism of calcareous soil,” Rock and Soil Mechanics, Vol. 39, No. 9, pp. 3113–3120, 2018.
-
S. Huang, Y. Lyu, H. Sha, and L. Xiu, “Seismic performance assessment of unsaturated soil slope in different groundwater levels,” Landslides, Vol. 18, No. 8, pp. 2813–2833, Aug. 2021, https://doi.org/10.1007/s10346-021-01674-w
-
S. Huang, Y. Lyu, and Y. Peng, “Application research of new cementitious composite materials in saline soil subgrade aseismic strengthening,” Advances in Civil Engineering, Vol. 2020, pp. 1–18, Jan. 2020, https://doi.org/10.1155/2020/7525692
-
Ju Yanfei and Ming Daogui, “Evaluation of bearing capacity characteristics of coral mixed soil foundation,” Chinese Journal of Underground Space and Engineering, Vol. 13, No. S2, pp. 684–687, 2017.
-
X. Wang, R. Wang, Q. Meng, and J. Chen, “Research on characteristics of coral reef calcareous rock in Nansha Islands,” Chinese Journal of Rock Mechanics and Engineering, Vol. 27, No. 11, pp. 2221–2226, Nov. 2008.
-
Zhu Changqi and Liu Chongquan, “Engineering behaviors of coral sands at Yongxing of Xisha islands,” Rock and Soil Mechanics, Vol. 1995, No. 2, pp. 35–41, 1995.
-
Sun Zongxun and Lu Bo, “Elastic wave properties of coral reef rock in Nansha island,” Journal of Engineering Geology, Vol. 7, No. 2, pp. 175–180, Apr. 1999.
-
Wang Xinzhi et al., “Field test study on engineering characteristics of coral reef foundation,” Rock and Soil Mechanics, Vol. 38, No. 7, pp. 2065–2070, 2017.
-
Yang Yongkang et al., “Experimental research on bearing capacity characteristics of Coral Sand in Xisha islands,” Journal of Guangzhou University (SCI), Vol. 16, No. 3, pp. 61–66, 2017.
-
Li Yangyang et al., “Study of plate load model test on coral sand foundation,” Journal of Chongqing University of Technology (SCI), Vol. 31, No. 10, pp. 114–121, 2017.
-
S. Huang, M. Huang, and Y. Lyu, “A novel approach for sand liquefaction prediction via local mean-based pseudo nearest neighbor algorithm and its engineering application,” Advanced Engineering Informatics, Vol. 41, p. 100918, Aug. 2019, https://doi.org/10.1016/j.aei.2019.04.008
-
R. M. Semple, Engineering for Calcareous Sediments. CRC Press, 1988, pp. 807–835.
-
M. R. Coop and D. W. Airey, “Characterisation and engineering properties of natural soil,” in Proceedings of the Second International Workshop on Characterisation and Engineering Properties of Natural Soils, pp. 1049–1086, 2003.
-
“GB50021-2018. Code for Investigation of Geotechnical Engineering,” China Architecture and Building Press, 2018.
-
“JTS 133-2013. Code for Geotechnical Investigation on Port and Waterway Engineering,” China Communications Press, 2013.
-
Salenon, J., and A. Pecker, “Ultimate bearing capacity of shallow foundations under inclined and eccentric loads,” European Journal of Mechanics – A/Solids, Vol. 14, No. 3, pp. 349–375, 1995.
Cited by
About this article

This work is financially supported by the National Natural Science Foundation of China (Grant No. 51708516), the National Natural Science Foundation of China (Grant No. 51708516), China Postdoctoral Science Foundation (2021M691391), the Open Foundation of the United Laboratory of Numerical Earthquake Forecasting (Grant No. 2021LNEF04).
