Abstract
Fault diagnosis of bearings is a crucial part of the maintenance process of the rotary machinery. Extracting the cyclic characteristics of the impact force is of significant importance for the bearing diagnosis. To highlight the fault features from signals combined with heavy background noise, a novel approach for bearing fault diagnosis based on the short-time processing is proposed. Fault signals are regarded as periodic impulse response signals. Firstly, a vibration signal is band-pass filtered with a subsequent spectral analysis. Then we integrate the energy of the filtered signal with a constant length, and the natural logarithm is considered to obtain the energy curve. The energy curve is a straight decaying curve, and its spectral energy is more concentrated on the fault characteristic frequency compared with envelope. Finally, the fault characteristic frequency of the bearing is found by the spectral analysis of the energy curve. The effectiveness of the proposed method is verified by simulation and experiments. The harmonics and sidebands in logarithmic energy spectrum are suppressed well, and the fault characteristic frequency is highlighted. Comparison of the proposed method with Hilbert envelope method shows that the proposed method can highlight the fault characteristic frequency.
Highlights
- To highlight the fault features from signals combined with heavy background noise, a novel approach for bearing fault diagnosis based on the short-time processing is proposed.
- The logarithmic energy curve is a straight decaying curve, and its spectral energy is more concentrated on the fault characteristic frequency compared with envelope.
- The harmonics and sidebands of the fundamental frequencies in logarithmic energy spectrum are suppressed well.
- The proposed method highlights the fundamental frequency rather than harmonics, which is different from the envelope demodulation and the energy operator, and provides a different path for fault feature extraction of rolling element bearings.
1. Introduction
Rolling element bearing is an important component of the rotary machinery equipment. Studies show that a bearing failure can occur due to many reasons such as improper machining, installation and maintenance procedures. Accordingly, monitoring and fault diagnosis of bearings is of significant importance in the field of fault diagnosis of the rotary machinery [1-4].
Vibration detection is commonly used in the fault diagnosis of rolling element bearings [5-7]. When the contact surface of rolling element bearing was defected, and the roller passes it, an impact occurs, which relates to the rotational speed. Then there is a high-frequency vibration, which is modulated by the impact period. The high-frequency part is the carrier of vibration signal, and the modulation frequency is the fault characteristic frequency [8]. However, it is not easy to identify the fault characteristic frequency due to noise and other frequency components.
There are two steps in bearings diagnosis process. The first step is de-noising, which include narrowband filter, wavelet and EMD [9]. The second step is to extract the fault characteristic frequency. The resonance demodulation is the main way to extract the fault characteristic frequency [10-11]. Resonance demodulation methods include envelope demodulation [12-14], cyclostationary demodulation [15, 16] and energy demodulation [17-20].
In the envelope demodulation, the envelope is obtained by Hilbert transform, and then the spectrum analysis of the envelope is performed. The envelope of impact signal is exponentially decaying, so the fault characteristic frequency and its harmonics can be observed in the envelope spectrum. There are also other frequency components, especially the rotational frequency with its harmonics in the envelope demodulation spectrum, which brings difficulties to the diagnosis of faults [21]. When the SNR (Signal to Noise Ratio) decreased, the error obtained by Hilbert transform would increase [22].
Energy-based methods are widely used in speech analysis [23-24]. The characteristic frequency of bearing can also be observed based on energy [25-27], such as Teager energy and short-time energy. Teager energy operator is a square formed of axes of instantaneous amplitude and instantaneous frequency, which enhances the factors of signal energy and frequency in signal recognition. Teager energy is helpful to improve the SNR, and harmonics are enhanced particularly. However, some difficulties are observed in terms of identifying the fault characteristic frequency and in terms of enhancing the harmonics of rotational frequency [25]. The logarithmic integral of energy is a statistical energy method, which is widely used to measure the decay curves of pulse tone, named integrated-tone-burst method in the acoustic field [28]. Since it can reduce noise and extract the characteristics similar to envelope, the impact period should be observed in the logarithmic energy curve. Thus a fault feature extraction method of rolling element bearings using logarithm of short-time energy is proposed. In the logarithmic energy curve, the noise and harmonics are suppressed well, and the fault characteristic frequency of rolling element bearing is enhanced.
This study is focused on extracting of the fault characteristic frequency, and the pre-process step adopts narrowband filtering. The paper structure is presented as follows. Section 2 introduces the theoretical basis for short-time energy evaluation for bearings vibration. In Section 3, simulation signals are used to demonstrate the effectiveness of the method in the feature extraction of periodic impact signals, and the difference between the method and the Hilbert envelope is discussed. In Section 4, a diagnosis method is described. In Section 5, the validity of the proposed method is verified by experiment and compared with Hilbert envelope. Finally, the conclusions are summarized in Section 6.
2. Theoretical basis
If a certain part of the rolling element bearing is stimulated by random vibration in a certain frequency band, then the vibration signal on the part can be written as:
where is the impulse response function of the stimulation, is the random vibration with the time .
Energy is gotten by a square of signals as follows:
Since the auto-correlation function of white noise signal is:
where is the energy in the bandwidth.
The cross-correlation function of white noise signal is only related to the time difference between the two signals.
The square of signals is averaged as follows:
Only when, . The impulse response functions are independent of each other. Eq. (4) can be transformed into the following form:
Further it can be rewritten as:
According to Eq. (6), the average energy of the bearing, which is stimulated continuously, is equal to times the energy integral of a single impulse. In other words, for a pulse signal, its energy integral is equal to the average energy of the signal at a certain time. In fact, the integral upper limit shall not be infinite. It is enough to cover the duration of the impulse [28]. The energies of all modals are summarized. When the modal characteristics are approximately the same, the logarithmic energy curve is also approximately the same [29].
Since bearing vibration signal of bearing has periodic impulses, then it is necessary to simplify the operative expression. The energy of a certain point of the bearing vibration signal is defined as:
where is the cycle corresponding to the central frequency of a signal, and can be 1, 2, 3 ,…
Thus, can be further expressed as:
The logarithm of is:
3. Simulation
3.1. Single impact simulation
Let the vibration signal of bearing after a single impact be:
where is the damping ratio, is the natural frequency, is the initial amplitude and is the initial phase.
The average energy at time point is as follows:
the equation is solved and generalized as:
Since, Eq. (12) can be written as:
According to Eq. (7), the short-time energy is:
Then:
The logarithm of short-time energy is:
where is the linear curve decaying with time.
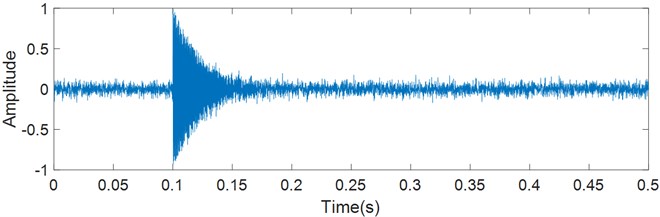
As an example, a signal is defined as 1, 0.02, 2000, 0°. 5 % gaussian white noise is added to simulate the background noise. The generated signal is shown in the Fig. 1.
Fig. 1Simulated signal of single impact
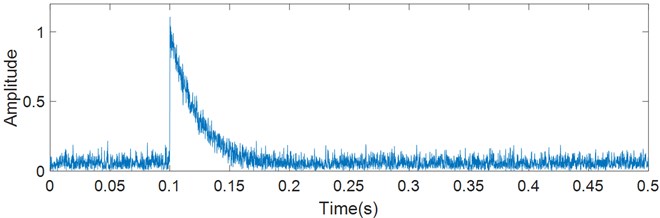
The logarithmic energy curve and envelope of the simulated signal are extracted respectively. The logarithmic energy curve in the form of approximately a right-angle triangle is shown in Fig. 2. It is possible to see that the noise is reduced, and the decaying segment is nearly flat.
Fig. 2Logarithmic energy curve of simulated signal
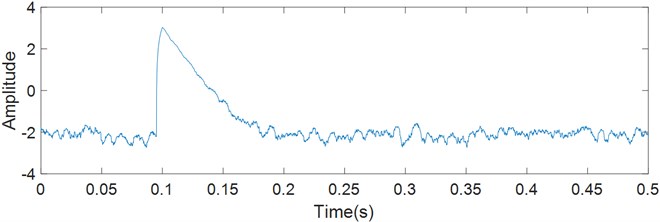
The Hilbert envelope is shown in Fig. 3. There is much noise due to the absence of narrowband filtering. The decaying curve is exponentially negative.
Fig. 3Hilbert envelope of simulated signal
3.2. Periodic impact simulation
The vibration signal of fault bearing is taken as periodic impulses and the period is the fault characteristic frequency . Let an impulse signal be , in frequency domain of which is . Let a be , Then the vibration signal is:
Then using the Fourier transform of it is possible to calculate the frequency domain of the periodic sequence signal expressed as :
The spectrum density function of the periodic sequence signal has still periodic sequence with its intensity and intervals expressed as . According to the convolution theorem of frequency domain, the spectrum of periodic impulse signal is obtained by sampling the spectrum of signal with equal intervals in . Then the spectrum density functions of the logarithmic energy curve and envelope are compared.
The Hilbert envelope is an exponential decaying signal:
Its Fourier transform is:
The amplitude spectrum is:
The amplitude spectrum of the envelope decays slowly along with frequency, which results in a lot of energy distributed to harmonics. Therefore, the fault characteristic frequency is found in terms of harmonics by applying the envelope demodulation. When the SNR decreases, the harmonics may be masked by noise that makes it difficult to identify the fault characteristic frequency.
The logarithmic energy curve can be taken as a right triangle:
Its Fourier series is:
The magnitude of cosine is . The amplitude spectrum of a single triangle decays by , which is faster than the amplitude spectrum of envelope.
There is a more significant characteristic frequency and fewer harmonics in the amplitude spectrum of a single triangle compared with the envelope.
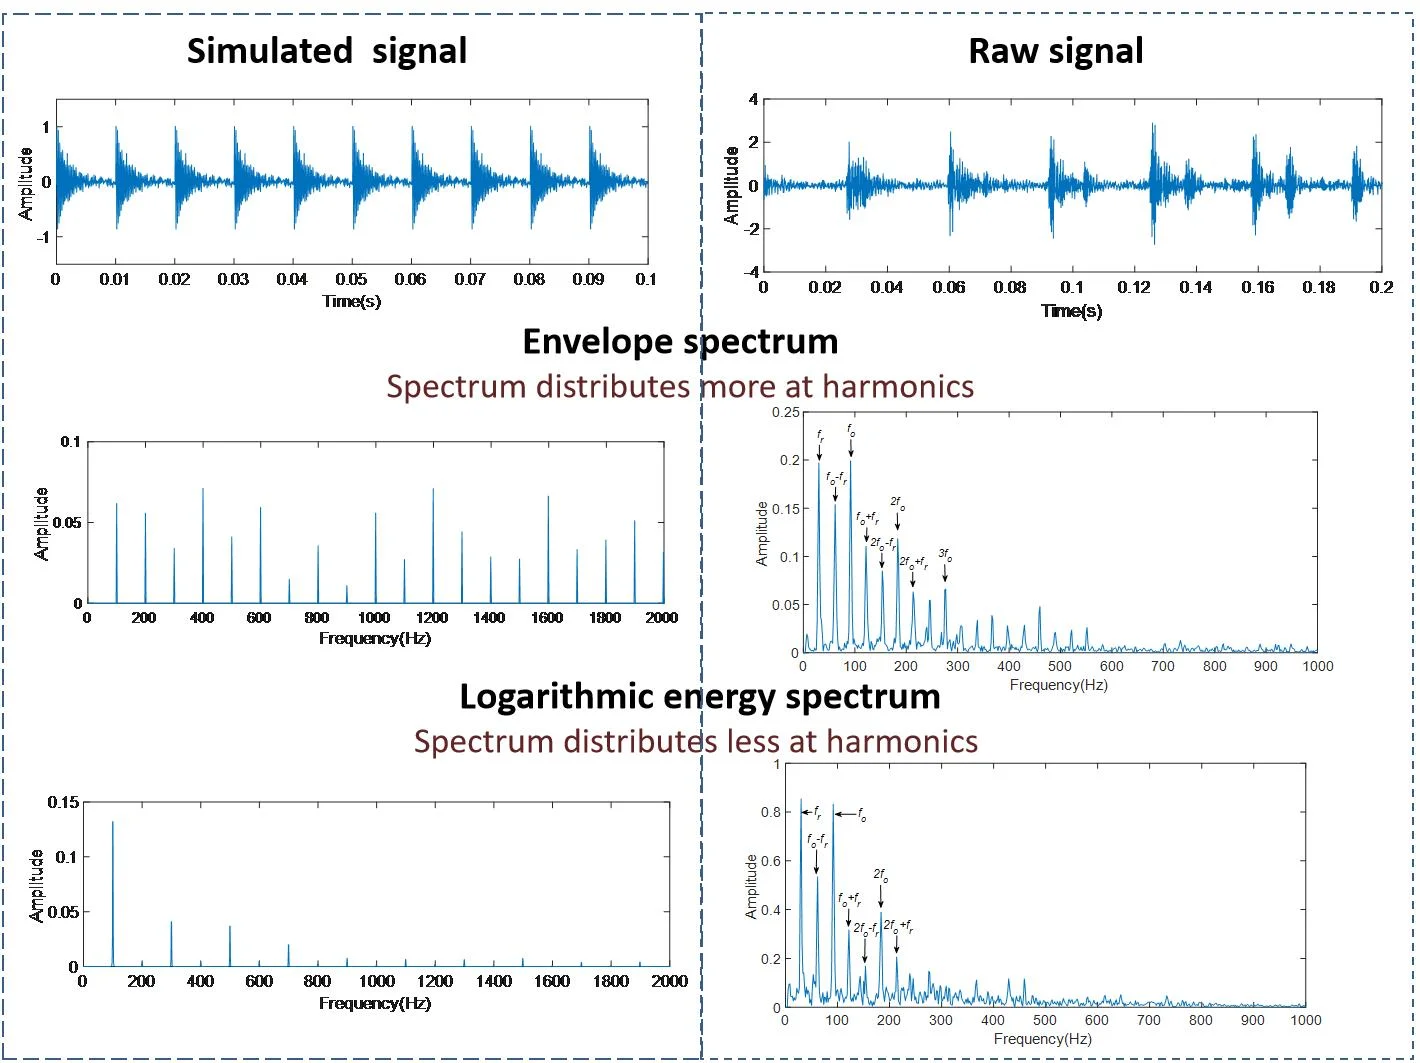
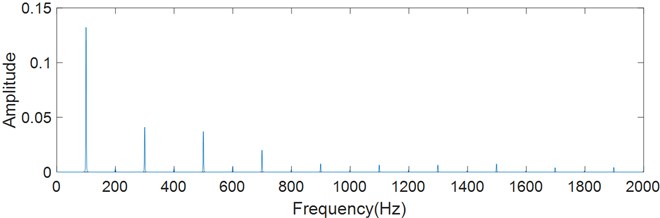
In order to simulate the vibration signal, twenty impulses with amplitude decaying exponentially are generated (Fig. 4). The interval of impulses is 0.01 seconds, and the fault characteristic frequency is 100 Hz. Gaussian white noise is added with account of 5 % standard deviation. Spectral analysis is performed on the logarithmic energy curve and envelope of the signal. The spectrum of envelope in Fig. 5(a) distributes more at harmonics, while the spectrum of logarithmic energy curve in Fig. 5(b) distributes less at harmonics.
Fig. 4Simulated vibration signal of faulty bearing
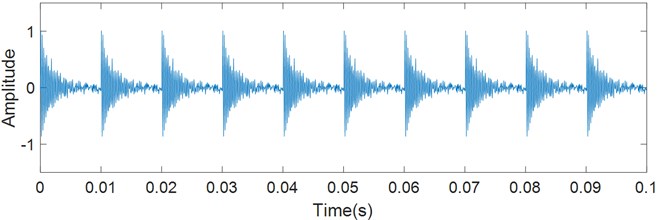
Fig. 5Spectrum of simulated signal (noise with 5 % standard deviation added)
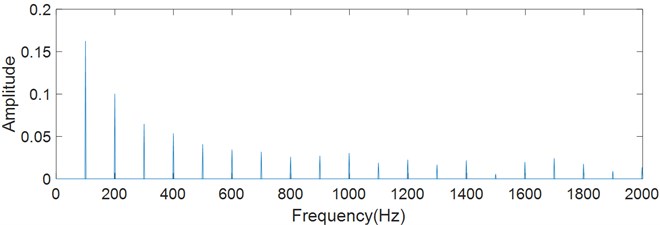
a) Envelope
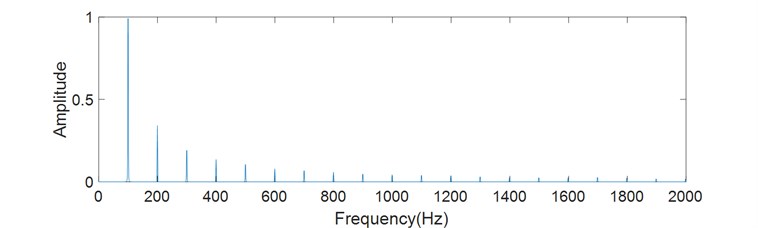
b) Logarithmic energy curve
Further, Gaussian white noise is increased to 30 % standard deviation, and the effect of noise on characteristic extraction is evaluated. The spectrums are shown in Fig. 6. The characteristic frequency and harmonics of envelope have nearly the same amplitudes, and the amplitude distribution is also very unstable, which brings difficulties to fault diagnosis. On the other hand, the characteristic frequency can be clearly identified in the spectrum of logarithmic energy curve.
Fig. 6Spectrum of the simulated signal (noise with 30 % standard deviation added)
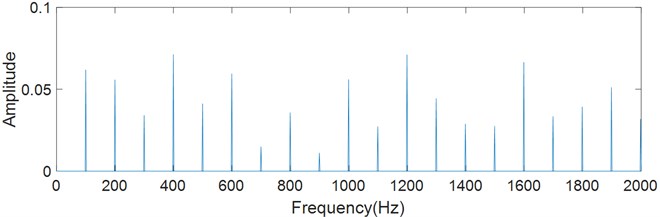
a) Envelope
b) Logarithmic energy curve
3.3. Integral time determination
The integral time in Eq. (8) shall be considered. Longer integral time smooth the signal, and shorter integral time weakens the denoise effect. The appropriate integral length shall minimize harmonics and enhance the characteristic frequency. The spectral entropy is used to evaluate the distribution of frequencies, and it is defined as follows:
where , , . is the amplitude spectrum of a time-domain signal sequence , and is the amplitude spectrum entropy.
When the frequency distribution of the signal is concentrated, the spectral entropy is low. When there is only one frequency component, the spectral entropy is 0. When there is uniform distribution in the whole frequency band, the spectral entropy reaches its maximum value of 1.
Fig. 7Spectral entropy of different integral times
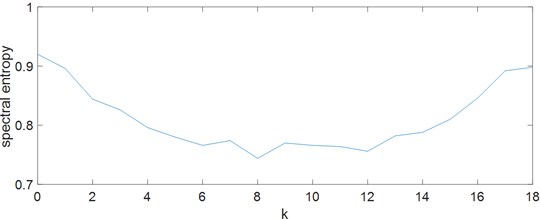
Given a simulation signal shown in Fig. 4, it is possible to set from 0 to 18 and observe the spectral entropy (Fig. 7). It can be observed that the spectral entropy is the lowest when is between 6 and 12.
4. Diagnostic process
When components of bearing pass through the defect, an impact occurs and stimulates vibration of the bearing. But the vibration decays rapidly due to lubrication and structural damping. Therefore, the vibration caused by the impact can be considered as a decaying signal [30-33], which contains various modal. Although the modal frequency and amplitude caused by impact are different each time, the damping ratio and the energy decay rate keep stable within the frequency band, according to the viewpoint of the statistical energy method. So the logarithmic energy curve of bearing can be considered as a right triangle.
The logarithmic energy curve is related to the impact. The frequency of energy is as the same as the frequency of impact. So, the primary frequency of logarithmic energy curve is the fault characteristic frequency. According to this principle, the fault feature extraction method of rolling element bearing is presented in this paper. This process shown in Fig. 8 is as follows:
1) find the domain frequency band containing fault characteristics in the spectrum of vibration signal;
2) obtain a signal with fault characteristics by means of a band-pass filter;
3) integrate the energy for a certain time at each point of the signal, and draw the logarithmic energy curve;
4) calculate the spectrum of the logarithmic energy curve;
5) find the primary frequency in the spectrum, and compare it with the fault characteristic frequency.
Fig. 8Fault feature extraction process

5. Validation
5.1. Artificially seeded damage bearing
Bearing fault data from the Bearing Data Center of the Western Reserve University were adopted [34]. The bearing type is 6203-2RS with the geometry parameters listed in Table 1. The sampling frequency of vibration signal was 12 kHz. A single defect with a diameter of 0.1778 mm and a depth of 0.2794 mm was eliminated by electro-discharge machining of the bearing. Accelerometers were located at the bearing housing of fan-drive ends. The motor speed was 1797 RPM, and the rotational frequency was 29.95 Hz. The fault characteristic frequency of inner race was 148.16 Hz, the fault characteristic frequency of outer race was 91.44 Hz, the fundamental train frequency (cage speed) was 11.43 Hz, and the fault characteristic frequency of roller was 59.72 Hz, often dominated by the harmonic at 119.42 Hz.
Table 1Geometry parameters of 6203-2RS bearing
Inside diameter | Outside diameter | Thickness | Ball diameter | Pitch diameter |
17.00 mm | 40.00 mm | 12.00 mm | 6.75 mm | 28.50 mm |
The spectrums of a fault-free signal are shown in Fig. 9, which come from envelope and logarithmic energy curve respectively. The rotational frequency can be observed in the below two figures.
The raw signal (Fig. 10) of bearing outer race fault exhibits a series of reasonably uniform impulse responses from the passage of each ball over the fault. A raw signal is processed in the same way as above. It is observed in Fig. 11 that the frequencies concentrate within the range of 3000 to 4500 Hz. Then the Hilbert transformation and logarithmic energy calculation are respectively performed after band-pass filtering. Finally, the FFT is performed to obtain the envelope spectrum and logarithmic energy spectrum.
Fig. 9Fault-free signal spectrum
a) Envelope
b) Logarithmic energy curve
Fig. 10Raw signal of artificial outer race fault
Characteristic frequencies and their harmonics can be found from the envelope spectrum and logarithmic energy spectrum as shown in Fig. 12. The fault characteristic frequency in the envelope spectrum is 91.67 Hz, and it is 91.84 Hz in the logarithmic energy spectrum. They are consistent with the characteristic frequency calculated theoretically.
It is noticeable that some frequencies in Fig. 12(a) are similar with the fault characteristic frequency and its harmonics. So it is possible to measure the main frequencies of envelope spectrum, which include the rotational frequency , the fault characteristic frequency and its harmonics with sidebands spaced at . In fact, the fault characteristic frequency could be surrounded by strong sidebands at a shaft speed, cage speed, or low harmonics at the shaft speed [35]. In Fig. 13(a), the harmonics of the rotation frequency, the harmonics of the fault characteristic frequency and the sidebands are similar with each other, which affects the fault identification. In some situation, the harmonics and sidebands look like noise, which seriously affects the fault identification. Therefore, it is not always possible find the fault characteristic frequency clearly from the envelope spectrum.
Fig. 11Spectrum of artificial outer race fault
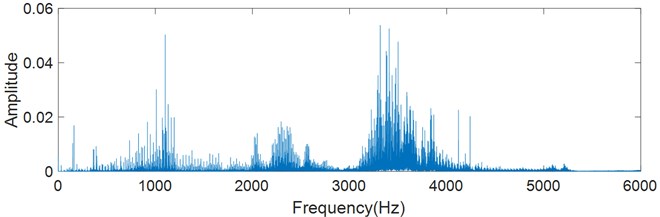
Fig. 12Fault characteristic frequency of artificial outer race
a) Envelope
b) Logarithmic energy curve
The logarithmic energy method focuses more on the spectrum energy with the fundamental frequency and reduce the energy of its harmonics. In Fig. 12(b), the second-order and higher harmonics of the fault frequency is significantly depressed compared to the fault characteristic frequency, compared with Fig. 13(a). The sidebands of the fault characteristic frequency is also significantly depressed. They highlight the rotational frequency and the fault characteristic frequency. The sidebands produced by frequency modulation is also depressed by the short-time integration of signal energy. Therefore, it is easier to find the fault characteristic frequency in the spectrum.
5.2. Run-to-failure bearing diagnosis
To verify the effectiveness of the proposed method in practical applications, a run-to-failure bearing in a bearing test rig is selected [7]. Bearing test rig comprises four bearings that are installed at one shaft. The rotation speed of shaft is controlled at 2100 rpm and a radial load of 12 kN is placed on the shaft. The sampling rate is 25600 Hz. LDK UER204 rolling element bearings are used in the test with geometry parameters listed in Table 2.
Table 2Structural parameters of LDK UER204 bearing
29.30 mm | 39.80 mm | 8 | 0 | 35 Hz | 107.91 Hz |
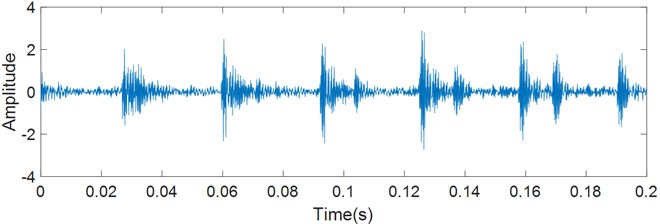
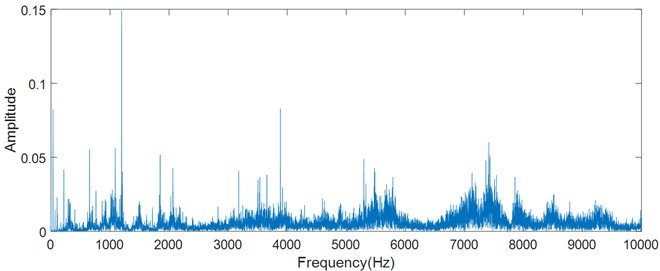
The bearing works continuously until it is damaged on the bearing test rig. Vibration signals of bearings in the horizontal direction were collected every 1 minute, and each sampling time is 1.28 seconds. A bearing with damaged outer race was selected for analysis. The early vibration signal of failure was collected as shown in Fig. 13. It can be observed that there are some impacts, and it is difficult to identify the fault. FFT is applied for the signal. It is clearly seen that there are more spectral energy distributed at high frequencies in Fig. 14.
Fig. 13Raw signal of outer race fault
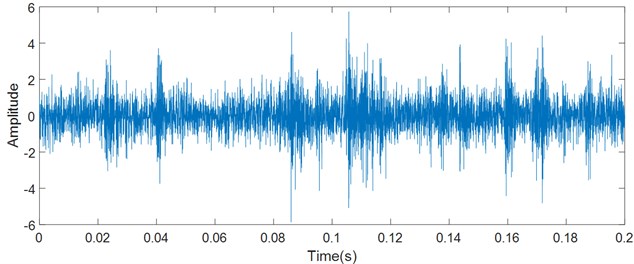
Fig. 14Spectrum of outer race fault
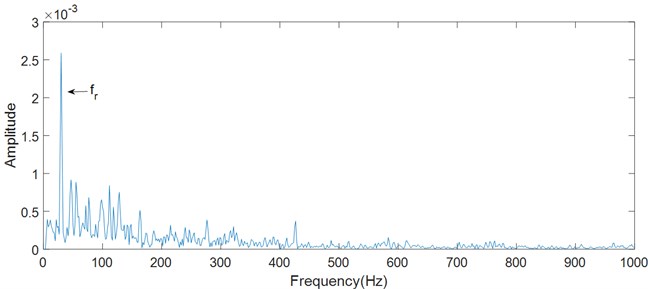
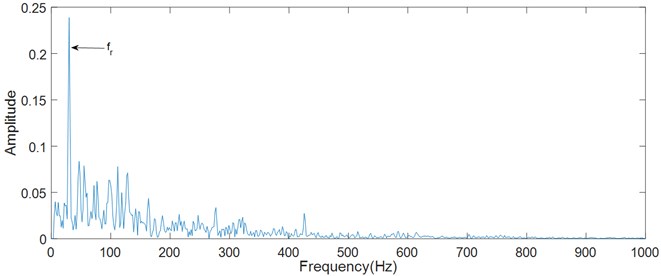
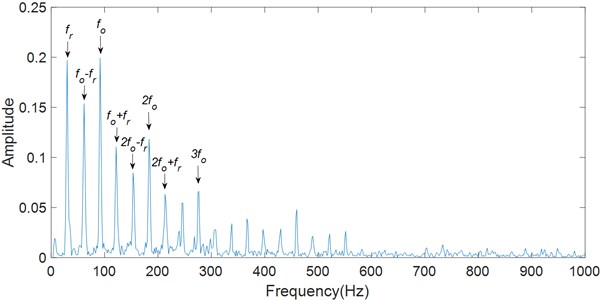
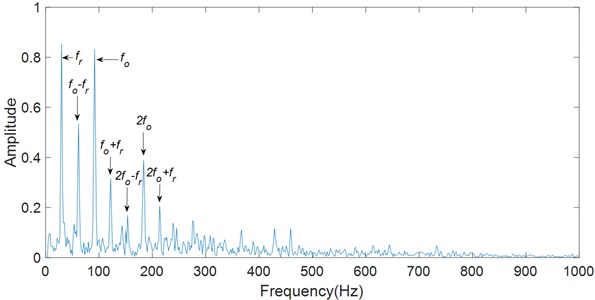
The Hilbert transformation and logarithmic energy calculation are respectively performed after band-pass filtering as shown in Fig. 15. The fault characteristic frequency is 108.6 Hz, and the rotational frequency is 34.77 Hz in the logarithmic energy spectrum and envelope spectrum. They are consistent with the characteristic frequency calculated theoretically. However, the harmonics and band sides of fault characteristic frequency are covered by noise, and it is difficult to identify the fault characteristic frequency by the harmonics. In the case, it is a better choice to highlight the fault characteristic frequency. The main frequencies in the logarithmic energy spectrum are highlighted, which is beneficial to identify the early fault.
Fig. 15Characteristic frequency of outer race fault
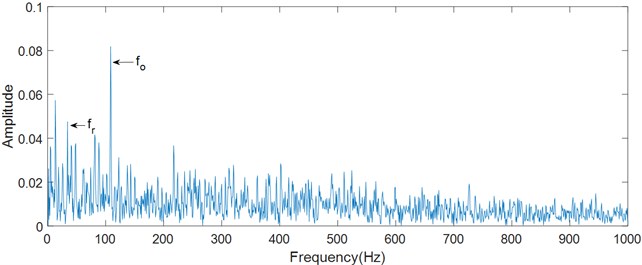
a) Envelope
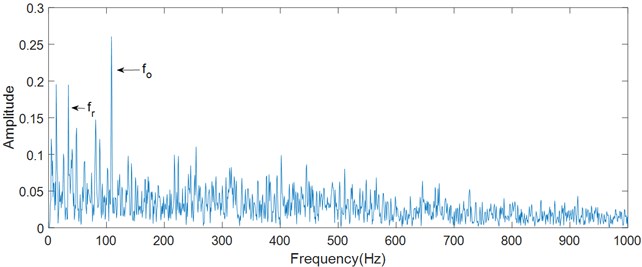
b) Logarithmic energy curve
6. Conclusions
In this paper, a fault feature extraction method based on short-time processing is proposed for the early fault diagnosis in rolling element bearings. Fault characteristics of bearing closely relate to structural vibration caused by impact. Fault signals can be regarded as periodic impulse response signals. Since the energy integral is equal to the average energy of the signal at a certain time for a pulse signal, the short-time energy of impulse response signal reflects the total energy at each time point. The logarithm of short-time energy is a straight decaying curve, and its spectral energy is more concentrated on the fault characteristic frequency. The envelope of an impulse response signal is an exponential decaying curve, and its spectral energy distributes smoothly on respective harmonics. The appropriate integral length is necessary for minimizing harmonics and enhancing the characteristic frequency. Analysis of test data shows that the harmonics and sidebands in the logarithmic energy spectrum are suppressed well. The fault characteristic frequency is more prominent, especially after the harmonics and sidebands of rotational frequency are suppressed, which is beneficial to an early fault diagnosis of rolling element bearing. The proposed method highlights the fundamental frequency rather than harmonics, which is different from the envelope demodulation and the energy operator and provides a different path for a bearing fault diagnosis.
References
-
R. B. Randall and J. Antoni, “Rolling element bearing diagnostics-A tutorial,” Mechanical Systems and Signal Processing, Vol. 25, No. 2, pp. 485–520, Feb. 2011, https://doi.org/10.1016/j.ymssp.2010.07.017
-
W. Wang and M. Pecht, “Economic analysis of canary-based prognostics and health management,” IEEE Transactions on Industrial Electronics, Vol. 58, No. 7, pp. 3077–3089, Jul. 2011, https://doi.org/10.1109/tie.2010.2072897
-
Wei, Li, Xu, and Huang, “A review of early fault diagnosis approaches and their applications in rotating machinery,” Entropy, Vol. 21, No. 4, p. 409, Apr. 2019, https://doi.org/10.3390/e21040409
-
N. Gebraeel, M. Lawley, R. Liu, and V. Parmeshwaran, “Residual life predictions from vibration-based degradation signals: a neural network approach,” IEEE Transactions on Industrial Electronics, Vol. 51, No. 3, pp. 694–700, Jun. 2004, https://doi.org/10.1109/tie.2004.824875
-
M. S. Patil, J. Mathew, and P. K. Rajendrakumar, “Bearing signature analysis as a medium for fault detection: a review,” Journal of Tribology, Vol. 130, No. 1, pp. 125–128, Jan. 2008, https://doi.org/10.1115/1.2805445
-
A. Rai and S. H. Upadhyay, “A review on signal processing techniques utilized in the fault diagnosis of rolling element bearings,” Tribology International, Vol. 96, pp. 289–306, Apr. 2016, https://doi.org/10.1016/j.triboint.2015.12.037
-
B. Wang, Y. Lei, N. Li, and N. Li, “A hybrid prognostics approach for estimating remaining useful life of rolling element bearings,” IEEE Transactions on Reliability, Vol. 69, No. 1, pp. 401–412, Mar. 2020, https://doi.org/10.1109/tr.2018.2882682
-
Y. Yang, C. Liu, D. Jiang, and K. Behdinan, “Nonlinear vibration signatures for localized fault of rolling element bearing in rotor-bearing-casing system,” International Journal of Mechanical Sciences, Vol. 173, p. 105449, May 2020, https://doi.org/10.1016/j.ijmecsci.2020.105449
-
W. Chen, J. Li, Q. Wang, and K. Han, “Fault feature extraction and diagnosis of rolling bearings based on wavelet thresholding denoising with CEEMDAN energy entropy and PSO-LSSVM,” Measurement, Vol. 172, p. 108901, Feb. 2021, https://doi.org/10.1016/j.measurement.2020.108901
-
G. Zhang, H. Wang, and T. Q. Zhang, “Cascaded nonlinear mass fluctuation stochastic resonance system and its application in bearing fault diagnosis,” Fluctuation and Noise Letters, Vol. 20, No. 5, p. 2150045, Oct. 2021, https://doi.org/10.1142/s0219477521500450
-
M. Segla, S. Wang, and F. Wang, “Bearing fault diagnosis with an improved high frequency resonance technique,” in 2012 10th IEEE International Conference on Industrial Informatics (INDIN), pp. 580–585, Jul. 2012, https://doi.org/10.1109/indin.2012.6301378
-
A. Soualhi, B. El Yousfi, H. Razik, and T. Wang, “A novel feature extraction method for the condition monitoring of bearings,” Energies, Vol. 14, No. 8, p. 2322, Apr. 2021, https://doi.org/10.3390/en14082322
-
M. S. Hoseinzadeh, S. E. Khadem, and M. S. Sadooghi, “Modifying the Hilbert-Huang transform using the nonlinear entropy-based features for early fault detection of ball bearings,” Applied Acoustics, Vol. 150, pp. 313–324, Jul. 2019, https://doi.org/10.1016/j.apacoust.2019.02.011
-
N. E. Huang et al., “The empirical mode decomposition and the Hilbert spectrum for nonlinear and non-stationary time series analysis,” Proceedings of the Royal Society of London. Series A: Mathematical, Physical and Engineering Sciences, Vol. 454, No. 1971, pp. 903–995, Mar. 1998, https://doi.org/10.1098/rspa.1998.0193
-
I. Antoniadis and G. Glossiotis, “Cyclostationary analysis of rolling-element bearing vibration signals,” Journal of Sound and Vibration, Vol. 248, No. 5, pp. 829–845, Dec. 2001, https://doi.org/10.1006/jsvi.2001.3815
-
A. Mauricio and K. Gryllias, “Cyclostationary-based multiband envelope spectra extraction for bearing diagnostics: the combined improved envelope spectrum,” Mechanical Systems and Signal Processing, Vol. 149, p. 107150, Feb. 2021, https://doi.org/10.1016/j.ymssp.2020.107150
-
T. Han, Q. Liu, L. Zhang, and A. C. C. Tan, “Fault feature extraction of low speed roller bearing based on Teager energy operator and CEEMD,” Measurement, Vol. 138, pp. 400–408, May 2019, https://doi.org/10.1016/j.measurement.2019.02.053
-
Y. Zhao, J. Zhang, M. Liu, and L. Kong, “An improved higher-order analytical energy operator with adaptive local iterative filtering for early fault diagnosis of bearings,” Journal of Vibroengineering, Vol. 22, No. 1, pp. 67–82, Feb. 2020, https://doi.org/10.21595/jve.2019.20794
-
Y. Wang, L. Gu, and Y. Xu, “Enhancement of bearing fault detection using an alternative analytic energy operator and sparse Bayesian step-filtering,” Journal of Mechanical Science and Technology, Vol. 35, No. 3, pp. 905–920, Mar. 2021, https://doi.org/10.1007/s12206-021-0204-1
-
B. Pang, G. Tang, and T. Tian, “Rolling bearing fault diagnosis based on SVDP-based kurtogram and iterative autocorrelation of teager energy operator,” IEEE Access, Vol. 7, pp. 77222–77237, 2019, https://doi.org/10.1109/access.2019.2921778
-
K. Ding and L. Mi, “Investigation on limitations for demodulation analysis application in failure diagnosis,” (in Chinese), Journal of Vibration Engineering, Vol. 10, No. 1, pp. 13–20, 1997.
-
L. Mei, J. Lin, G. Ji, and L. He, “Envelope extraction based on phase-shifting wavelet method,” (in Chinese), Chinese Journal of Scientific Instrument, No. 6, pp. 1122–1128, 2007, https://doi.org/10.3321/j.issn:0254-3087.2007.06.031
-
M. R. Kamble and H. A. Patil, “Detection of replay spoof speech using teager energy feature cues,” Computer Speech and Language, Vol. 65, p. 101140, Jan. 2021, https://doi.org/10.1016/j.csl.2020.101140
-
Y. Shi, J. Bai, P. Xue, and D. Shi, “Fusion feature extraction based on auditory and energy for noise-robust speech recognition,” IEEE Access, Vol. 7, pp. 81911–81922, 2019, https://doi.org/10.1109/access.2019.2918147
-
Y. Lv, M. Ge, Y. Zhang, C. Yi, and Y. Ma, “A novel demodulation analysis technique for bearing fault diagnosis via energy separation and local low-rank matrix approximation,” Sensors, Vol. 19, No. 17, p. 3755, Aug. 2019, https://doi.org/10.3390/s19173755
-
B. Wang, H. Pan, and W. Yang, “A complementary approach for fault diagnosis of rolling bearing using canonical variate analysis based short-time energy feature,” Journal of Vibration and Control, Vol. 24, No. 18, pp. 4195–4210, Sep. 2018, https://doi.org/10.1177/1077546317721844
-
X. H. Fan, C. Q. Zhang, X. B. Liu, and L. X. Zhang, “Signal impact feature extraction based on short-time weighted kurtosis,” (in Chinese), Journal of Academy of Armored Force Engineering, Vol. 30, No. 5, pp. 73–76, 2016.
-
M. R. Schroeder, “New method of measuring reverberation time,” The Journal of the Acoustical Society of America, Vol. 37, No. 3, pp. 409–412, Mar. 1965, https://doi.org/10.1121/1.1909343
-
B. H. Yin, M. Q. Wang, and X. D. Wu, “Decay method for measuring structural vibration damping,” (in Chinese), Journal of Vibration and Shock, Vol. 33, No. 4, pp. 100–106, 2014.
-
A. Had and K. Sabri, “A two-stage blind deconvolution strategy for bearing fault vibration signals,” Mechanical Systems and Signal Processing, Vol. 134, p. 106307, Dec. 2019, https://doi.org/10.1016/j.ymssp.2019.106307
-
H. Cheng, Y. Zhang, W. Lu, and Z. Yang, “Research on ball bearing model based on local defects,” SN Applied Sciences, Vol. 1, No. 10, p. 1219, Oct. 2019, https://doi.org/10.1007/s42452-019-1251-4
-
L. Niu, H. Cao, H. Hou, B. Wu, Y. Lan, and X. Xiong, “Experimental observations and dynamic modeling of vibration characteristics of a cylindrical roller bearing with roller defects,” Mechanical Systems and Signal Processing, Vol. 138, p. 106553, Apr. 2020, https://doi.org/10.1016/j.ymssp.2019.106553
-
S. M. Jafari, R. Rohani, and A. Rahi, “Experimental and numerical study of an angular contact ball bearing vibration response with spall defect on the outer race,” Archive of Applied Mechanics, Vol. 90, No. 11, pp. 2487–2511, Nov. 2020, https://doi.org/10.1007/s00419-020-01733-z
-
Case Western Reserve University Bearing Data Center Website, http://csegroups.case.edu/bearingdatacenter/home
-
W. A. Smith and R. B. Randall, “Rolling element bearing diagnostics using the Case Western Reserve University data: A benchmark study,” Mechanical Systems and Signal Processing, Vol. 64-65, pp. 100–131, Dec. 2015, https://doi.org/10.1016/j.ymssp.2015.04.021
Cited by
About this article

This work has been funded by the Guangdong Province Natural Science Foundation of China (Grant No. 2018A0303013196).
