Abstract
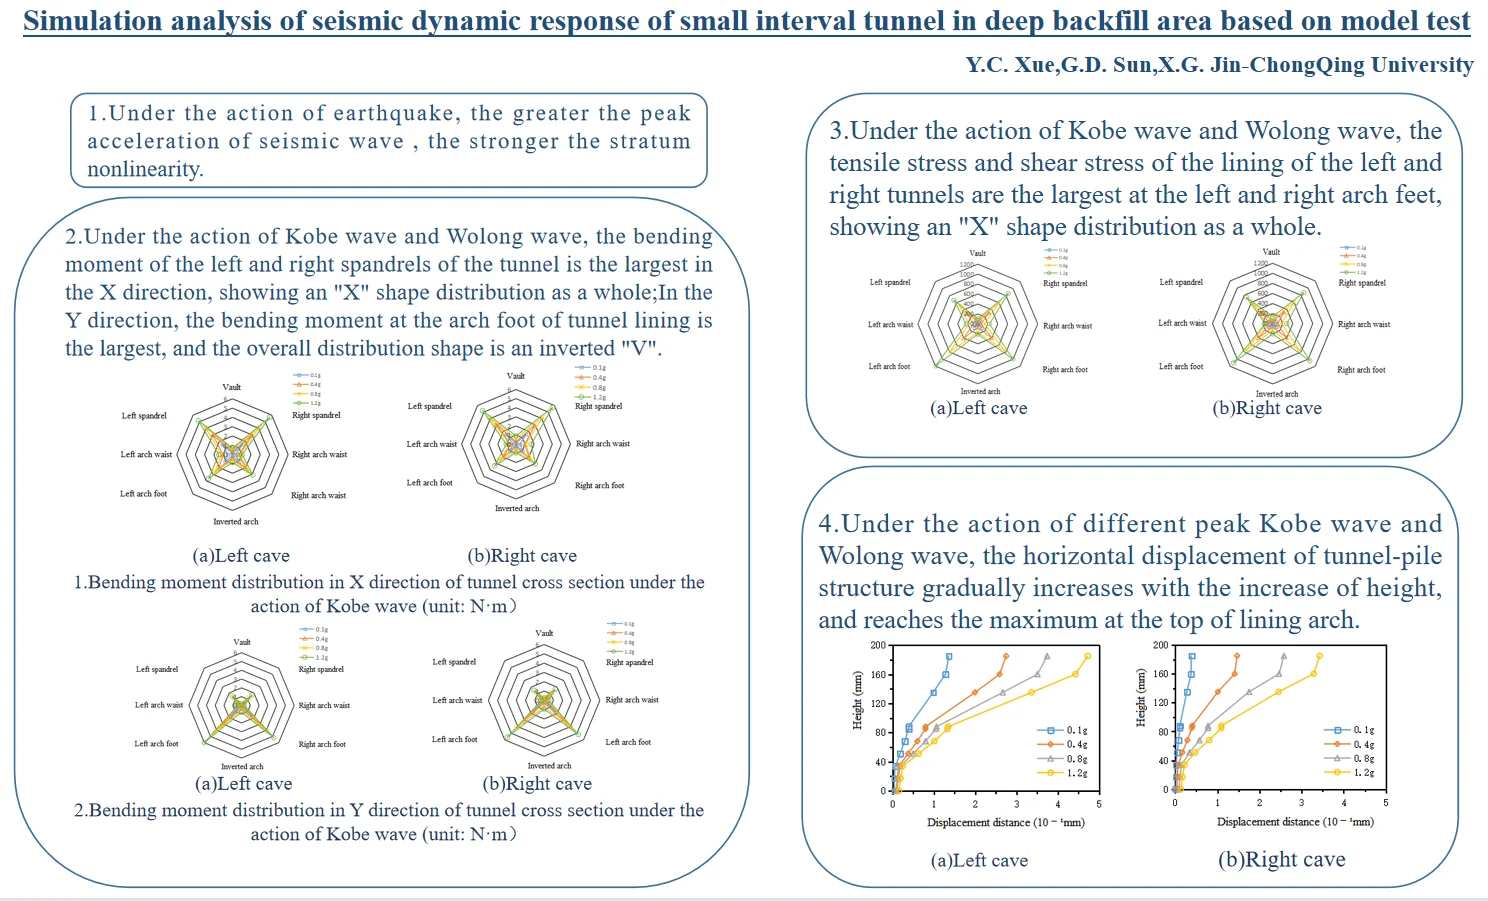
In order to reveal the seismic dynamic response law of small interval tunnel in soil rock backfill area, relying on the subway section tunnel project, a three-dimensional finite element model is established on the basis of model test to analyze the seismic dynamic response of tunnel lining structure and foundation pile. The results show that: 1) under the action of earthquake, the greater the peak acceleration of seismic wave , the stronger the stratum nonlinearity; 2) under the action of Kobe wave and Wolong wave, the bending moment of the left and right spandrels of the tunnel is the largest in the direction, showing an “” shape distribution as a whole; In the direction, the bending moment at the arch foot of tunnel lining is the largest, and the overall distribution shape is an inverted “”; 3) under the action of Kobe wave and Wolong wave, the tensile stress and shear stress of the lining of the left and right tunnels are the largest at the left and right arch feet, showing an “” shape distribution as a whole; 4) under the action of different peak Kobe wave and Wolong wave, the horizontal displacement of tunnel-pile structure gradually increases with the increase of height, and reaches the maximum at the top of lining arch.
Highlights
- Under the action of earthquake, the greater the peak acceleration of seismic wave, the stronger the stratum nonlinearity.
- Under the action of Kobe wave and Wolong wave, the bending moment of the left and right spandrels of the tunnel is the largest in the X direction, showing an "X" shape distribution as a whole; In the Y direction, the bending moment at the arch foot of tunnel lining is the largest, and the overall distribution shape is an inverted "V".
- Under the action of Kobe wave and Wolong wave, the tensile stress and shear stress of the lining of the left and right tunnels are the largest at the left and right arch feet, showing an "X" shape distribution as a whole.
- Under the action of different peak Kobe wave and Wolong wave, the horizontal displacement of tunnel-pile structure gradually increases with the increase of height, and reaches the maximum at the top of lining arch.
1. Introduction
In the early stage of mountain city construction, due to the extensive use of the method of “opening mountains and filling valleys”, a large number of soil and stone mixed backfill areas were formed. With the development and utilization of urban underground space and the needs of rail transit construction, some sections of some lines will inevitably cross the deep backfill area mixed with soil and stone, which will bring certain risks to the design, construction and operation of the project.
Many scholars at home and abroad have compared model test with numerical simulation analysis to analyze the law of seismic dynamic response. H. H. Wei [1] verified the correctness of the modeling method by simulating shaking table test, and carried out three-dimensional modeling calculation on this basis to study the dynamic response of surface-underground structure system; R. C. Gomes [2] compared the centrifuge test and numerical simulation results, and analyzed the differences between the two research methods in seismic dynamic response; J. Y. Niu [3] et al. Established the numerical simulation model of small interval tunnel on layered rock slope by using Midas software, and compared the numerical simulation results with the shaking table results; Z. Y. Yu [4] et al. Carried out shaking table test and established three-dimensional finite element model for comparative analysis, studied the seismic dynamic response of transfer subway station; C. Liu [5] studied the dynamic response of shallow buried biased multi arch tunnel under Wenchuan wave by combining shaking table test and numerical simulation. However, at present, there are few studies on the seismic dynamic response of tunnels in the deep backfill area of soil rock mixture, and few people study the seismic dynamic response characteristics of pile supported small interval tunnels.
In this paper, based on the subway section tunnel project, a three-dimensional finite element model of pile supported small interval tunnel in soil rock mixed deep backfill area is established on the basis of model test, the seismic dynamic response of tunnel lining structure and foundation pile is studied, and the bending moment, internal force and displacement response characteristics of tunnel lining and foundation pile under earthquake are analyzed, which can provide some reference for the design, construction, operation of similar projects.
2. Establishment of numerical model
2.1. Model size and material parameters
The numerical model is established based on the dimensions and material parameters of the model test. The length of the model is 0.95 m, the width is 0.8 m, the height is 0.65 m, the lining thickness is 6 mm, and the diameter of the tunnel foundation pile is 8 mm. The specific dimensions are shown in Fig. 1. The three-dimensional finite element model is shown in Fig. 2.
The surrounding rock of the model adopts Mohr Coulomb constitutive model, and the structure adopts elastic model. The physical and mechanical parameters of surrounding rock and structure are set according to the test results of similar materials. The specific parameters are shown in Table 1.
Fig. 1Marking drawing of model size (unit: mm)
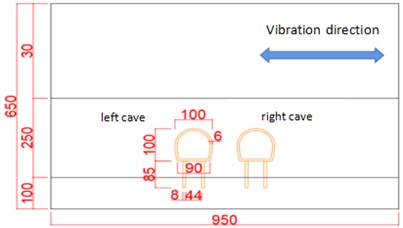
Fig. 2Three dimensional finite element model
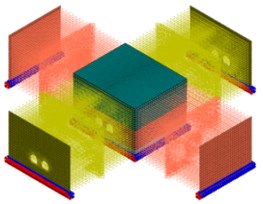
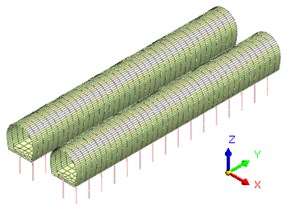
Table 1Physical and mechanical parameters of materials
Name | Density (kN/m³) | Cohesion (kPa) | Internal friction angle (°) | Elastic modulus (MPa) | Poisson ratio () |
Earth rock mixture | 18 | 0.8 | 33.2 | 0.8 | 0.3 |
Grout | 20 | 8 | 38.5 | 3.5 | 0.28 |
Sandstone | 24 | 50 | 41 | 62.5 | 0.25 |
Lining | 15 | 2800 | 0.3 | ||
Pile | 15 | 2800 | 0.3 |
2.2. Boundary condition and calculation method
In this paper, the free field boundary is selected, the results of model eigenvalue analysis are shown in Table 2. The periods of the two modes with the largest mass participation coefficient in T1 direction ( direction) (the periods of the first and second modes) are taken as the natural vibration periods of the model for nonlinear time history analysis. It can be seen from Table 2 that the natural vibration period of the first and second vibration modes is 0.113 s, and the damping ratio of soil is considered as a constant of 0.05.
Table 2Eigenvalue analysis result
Vibration mode | Characteristic value | Natural vibration period (s) | Effective mass of horizontal vibration mode (kg) | Effective mass ratio of horizontal vibration mode |
1 | 3.079007e+003 | 1.132334e-001 | 1.806516e+008 | 15.72 % |
2 | 3.079012e+003 | 1.132333e-001 | 1.825386e+008 | 15.89 % |
3 | 3.253345e+003 | 1.101577e-001 | 4.716421e-012 | 0.00 % |
4 | 3.253345e+003 | 1.101577e-001 | 0.000000e+000 | 0.00 % |
5 | 3.527835e+003 | 1.057854e-001 | 5.010135e-001 | 0.00 % |
6 | 3.802990e+003 | 1.018866e-001 | 1.196902e-005 | 0.00 % |
7 | 4.557808e+003 | 9.306836e-002 | 4.317520e-005 | 0.00 % |
8 | 4.618631e+003 | 9.245348e-002 | 1.109999e-010 | 0.00 % |
9 | 4.618671e+003 | 9.245306e-002 | 2.200082e-009 | 0.00 % |
10 | 5.073915e+003 | 8.820808e-002 | 8.611507e-002 | 0.00 % |
Total mode mass | 3.631902e+008 | 31.61 % | ||
Total model quality | 1.149060e+009 |
2.3. Seismic wave input of mode
The processed Kobe wave collected in Kobe earthquake and Wolong wave collected in Wenchuan earthquake are selected in the simulation. Taking 0.1 g Kobe wave and 0.1 Wolong wave as examples, the peak acceleration curve of the input seismic wave is shown in Fig. 3.
Fig. 3Acceleration time history curve of seismic wave
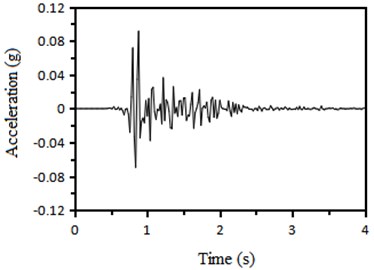
a) 0.1 g Kobe wave
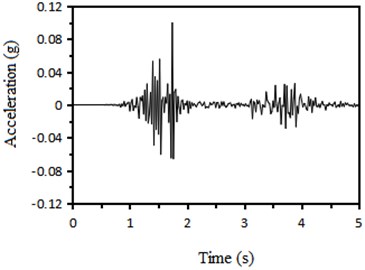
b) 0.1 g Wolong wave
3. Analysis of numerical simulation results
3.1. Acceleration response characteristics
Select the measuring points as shown in Fig. 4. Extract the acceleration data of each measuring point, and draw the variation curve of formation acceleration along the height direction under the action of different peak Kobe wave and Wolong wave as shown in Fig. 5. Under the action of Kobe wave, with the increasing peak acceleration of input seismic wave, the stratum nonlinearity gradually increases, which is most obvious at A14 measuring point. When the peak acceleration of input exceeds 0.4 g, the peak acceleration at A14 measuring point shows obvious “saturation” characteristics. When the peak acceleration of input is greater than 0.6 g, the stratum acceleration no longer increases monotonically along the height, Present an anti zigzag variation law; Under the action of Wolong wave, when the input peak acceleration exceeds 1.0 g, the formation acceleration presents a zigzag variation law along the height.
Fig. 4Schematic diagram of model acceleration measuring points
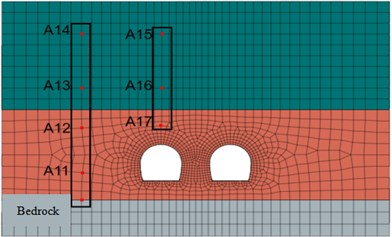
Fig. 5Variation curve of peak acceleration along height direction of the model under the action of different seismic wave
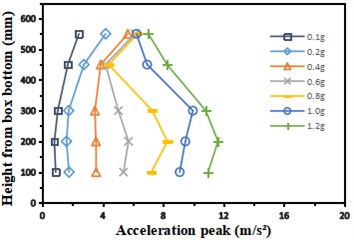
a) Kobe wave
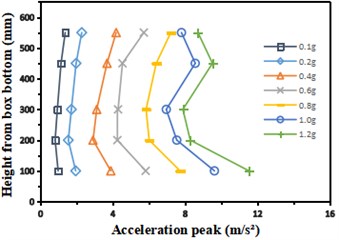
b) Wolong wave
3.2. Tunnel lining-pile response characteristics
3.2.1. Moment response of tunnel lining
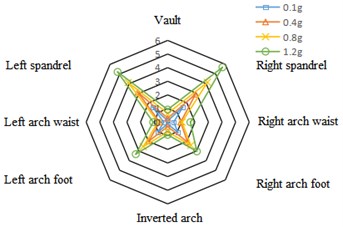
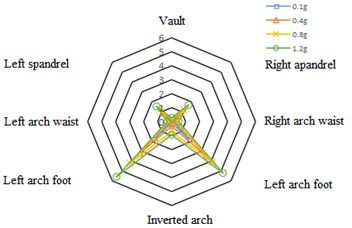
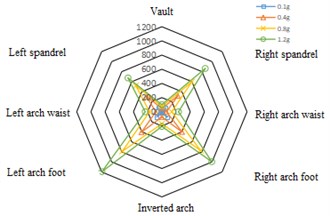
Under the action of Kobe wave and Wolong wave with different peak intensities, the bending moment value of the left and right spandrels of the tunnel is the largest in the direction, followed by the left and right arch feet. The bending moment value generally presents an “” shape distribution on the cross section of the lining; In the direction, the maximum bending moment appears at the arch foot of the lining, followed by the left and right spandrels. The bending moment at the inverted arch and arch waist is small. The bending moment is distributed in an inverted “” shape on the cross section of the lining.
Fig. 6Bending moment distribution in X direction of tunnel cross section under the action of Kobe wave (unit: N·m)
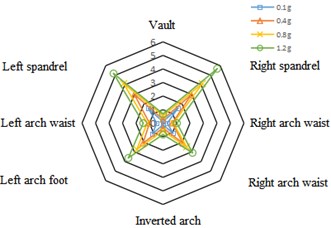
a) Left cave
b) Right cave
Fig. 7Bending moment distribution in Y direction of tunnel cross section under the action of Kobe wave (unit: N·m)
a) Left cave
b) Right cave
3.2.2. Stress response of tunnel lining
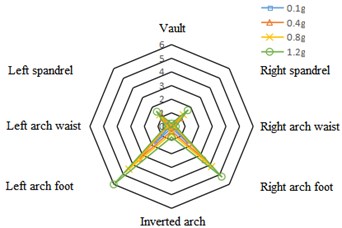
Under the action of the two kinds of seismic waves, the stress distribution in the left and right tunnel lining are the same. The maximum tensile stress and shear stress are at the left and right arch feet, followed by the left and right spandrels, and the vault and inverted arch are the smallest, showing an “” shape distribution as a whole. Taking Wolong wave as an example, the maximum tensile stress distribution diagram of tunnel cross section is drawn, as shown in Fig. 8.
Fig. 8Maximum tensile stress distribution of tunnel cross section under the action of Wolong wave (unit: N·m)
a) Left cave
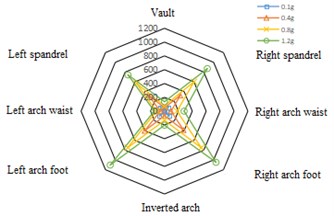
b) Right cave
3.2.3. Pile moment response
Under the excitation of Kobe wave and Wolong wave, the peak bending moment increases nonlinearly along the height of the pile. The bending moment of the pile in the sandstone stratum (height 0-33 mm) is generally small; The bending moment of the pile in the soil rock mixture stratum (height 33-85 mm) increases first, then decreases and then increases along the height. Take Kobe wave as an example to draw the curve of pile bending moment along the height, as shown in Fig. 9.
Six measuring points are selected at equal intervals from the bottom to the top of the pile body, and four measuring points are selected on the lining: arch foot, arch waist, arch shoulder and arch crown. The results of the selected measuring points are analyzed. It is found that under the action of different peak Kobe wave and Wolong wave, the horizontal displacement of tunnel-pile structure increases gradually with the increase of height, and reaches the maximum at the top of lining arch. It can be seen from Fig. 10 that there are two obvious turning points in the curve, which are located near the height of 30 mm and 90 mm respectively. Near the height of 30 mm, the change trend of relative horizontal displacement increases suddenly, because the stratum around the pile changes from bedrock to grouting body, and the horizontal displacement constraint of grouting body on the pile is much less than that of bedrock. The change trend of relative horizontal displacement also increases suddenly near the height of 90 mm. The reason is that the height of 85 mm is the junction point of pile foundation and tunnel lining. The overall bending stiffness of tunnel lining is greater than that of lining. Pile and lining are in the grouting stratum and belong to the same material, so the change trend of relative horizontal displacement along height is similar.
Fig. 9Variation curve of pile bending moment along height under the action of Kobe wave Horizontal displacement of tunnel-pile structure
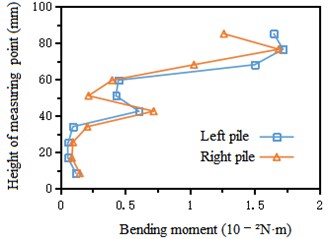
a) Left cave
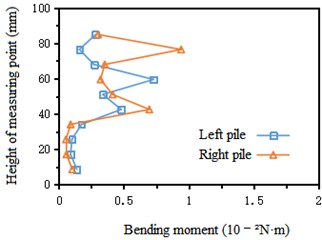
b) Right cave
Fig. 10Variation curve of horizontal displacement of structure along height under Wolong wave
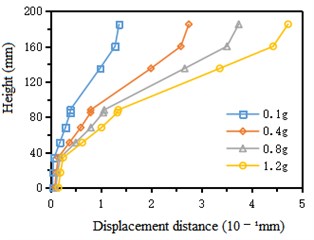
a) Left cave
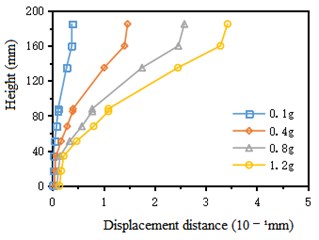
b) Right cave
4. Conclusions
1) Under the action of Kobe wave, the greater the peak acceleration of input seismic wave, the stronger the stratum nonlinearity. When the peak acceleration of input seismic wave exceeds 0.4 g, the stratum acceleration response of soil rock mixture appears obvious nonlinear characteristics.
2) Under the action of Kobe wave and Wolong wave, the bending moment of the left and right spandrels of the tunnel is the largest in the direction, showing an “” shape distribution as a whole; The bending moment at the arch foot of the tunnel lining is the largest in the direction, presents an inverted “” shape on the cross section of the lining as a whole; Along the direction of pile height, the peak bending moment increases nonlinearly, and the bending moment in sandstone stratum is generally small. While in soil rock mixture stratum, the bending moment increases first, then decreases and then increases along the height.
3) Under the action of Kobe wave and Wolong wave, the tensile stress and shear stress in the left and right tunnel lining are the largest at the left and right arch toes, followed by the left and right arch spandrels, and the smallest at the arch crown and inverted arch, showing an “” shape distribution as a whole.
4) Under the action of different peak Kobe wave and Wolong wave, the horizontal displacement of tunnel-pile structure gradually increases with the increase of height, and reaches the maximum at the top of lining arch.
References
-
H. H. Wei, “Seismic response of the above-ground structure-soil underground structure interaction system,” (in Chinese), Wuhan University of Technology, 2019.
-
F. F. Wang, “Dynamic response laws and shock absorption measures of shallow-buried small distance tunnel with asymmetrical pressure,” (in Chinese), Central South University of Forestry and Technology, 2018.
-
J. Niu, X. Jiang, and F. Wang, “Stability analysis of rock slope with small spacing tunnel under earthquakes and influence of ground motion parameters,” (in Chinese), Geotechnical and Geological Engineering, Vol. 36, No. 4, pp. 2437–2453, Aug. 2018, https://doi.org/10.1007/s10706-018-0475-1
-
Z. Y. Yu, H. R. Zhang, Y. J. Qiu, and H. Li, “Study on seismic response characteristics of a seamless exchange subway station,” (in Chinese), Journal of Hunan University, Vol. 48, No. 11, pp. 166–176, Nov. 2021.
-
C. Liu, H. Yang, X. Jiang, and H. Shi, “Shaking table test and numerical simulation for acceleration response laws of shallow-buried biased double-arch tunnel,” (in Chinese), Journal of Vibroengineering, Vol. 21, No. 4, pp. 1188–1200, Jun. 2019, https://doi.org/10.21595/jve.2019.20623
About this article

