Abstract
Based on the similarity theory, a physical testing model with scale of 1:10 was designed and fabricated. The Wenchuan wave (WC-XZ), Darui artificial wave (DR-XZ) and Kobe wave (K-XZ) were adopted as excitation waves which was directions (horizontal and vertical loading at the same time). A series of shaking table tests were carried out to study the effect of the types, directions and peaks acceleration of the seismic waves on the acceleration response laws of the shallow-buried bias tunnels with small distance. The results show that: (1) in the horizontal direction, the types of the seismic waves have a little effect on the acceleration response, but the law is opposite with Kobe wave being the most serious, followed by Darui artificial wave and Wenchuan wave in the vertical direction. (2) The existing slope has a significant effect on the acceleration response of the right hole which is different from that of the left hole. (3) The acceleration response of the tunnel in the vertical direction is more severe than that of the horizontal direction and the acceleration amplification factors in vertical direction are is generally 1.02-3.94 times that of the horizontal direction. (4) in the seismic design of tunnel, different seismic measures should be adopted in different directions. The results have a significant reference for the anti-seismic design of the tunnel.
Highlights
- A series of shaking table tests were carried out to study the effect of the types, directions and peaks acceleration of the seismic waves on the acceleration response laws of the tunnel
- The acceleration response of the tunnel in the vertical direction is more severe than that of the horizontal direction
- In the horizontal direction, the types of the seismic waves have a little effect on the acceleration response
- The law is Kobe wave being the most serious, followed by Darui artificial wave and Wenchuan wave in the vertical direction
1. Introduction
Earthquake disaster is one of the natural disasters that cause great damage to buildings (structures). The global important earthquake disasters in the past show that underground structures are vulnerable to strong earthquakes [1]. Academician Wang Mengshu pointed out that China has become the country with the largest number of tunnels and underground works, the fastest development speed and the most complex geological and structural forms in the world [2]. China has a vast territory, many mountains and frequent earthquakes, which bring many challenges to the design and construction of tunnels and underground engineering. Limited by the objective conditions such as topography, geology, engineering construction cost and environment, small clear distance tunnel may be the best choice for tunnel construction. Small clear distance tunnel is a new type of tunnel structure between the common separated tunnel and the double arch tunnel, which has been widely used in engineering practice. The seismic response characteristics, failure mechanism and dynamic stability of the tunnel with small clear distance have become an urgent problem for researchers.
At present, some scholars have carried out the research on the dynamics of small clear distance tunnel, and the research results mainly focus on two aspects: engineering blasting and earthquake action. Some scholars used the numerical simulation method to carry out the research of structural damage [3-7].
In terms of engineering blasting, Zhao et al. [8] carried out numerical simulation analysis on blasting vibration response of small clear distance cross tunnels, and proposed the mechanism of impact of blasting construction of new tunnels on existing highway tunnels. Wang et al. [9] studied the blasting vibration response of adjacent tunnels through on-site monitoring and numerical analysis, and obtained the law of the impact of excavation of new tunnels on existing tunnels. Zhu et al. [10] put forward the control technology of blasting construction in the second tunnel under the condition of ensuring the safety and stability of the first tunnel through the on-site monitoring of blasting vibration and dynamic response analysis of ultra-small clear distance tunnel. Liu et al. [11] obtained the key points of blasting vibration control in the construction of small clear distance tunnel and the attenuation law of blasting seismic wave during the excavation of tunnel by monitoring and analyzing the blasting vibration of small clear distance tunnel in Daxianling.
In terms of seismic action, Yuan et al. [12] studied the response characteristics of the structure and surrounding rock of the tunnel with small clear distance through numerical calculation, and obtained the influence rule of the clear distance on the response of the tunnel with small clear distance and the reasonable clear distance of the tunnel with double holes under the dynamic response. Huang et al. [13] combined with the engineering example, the FLAC finite difference method was used to study the dynamic response law of the shallow tunnel with bias and small clear distance, and the change law of the axial force, shear force and bending moment of the left and right tunnels was obtained. Lu et al. [14] used the finite element analysis method to study the seismic time history response of the small clear distance tunnel, and obtained the response characteristics of the small clear distance tunnel structure under the horizontal and vertical seismic wave excitation. Ling [15] used the dynamic time history analysis method to compare the double arch tunnel and the small clear distance tunnel, and obtained the similarity and difference of the seismic dynamic response characteristics of the two tunnel structures.
According to the research results of small clear distance tunnel dynamic response, the current research methods are mainly monitoring and numerical simulation, while the research on seismic acceleration response characteristics of shallow bias small clear distance tunnel based on large-scale shaking table model test is relatively rare. Based on the similarity theory, a tunnel model with 1:10 ratio is designed and manufactured. A series of large-scale shaking table model tests are carried out to study the seismic acceleration response law of shallow bias small clear distance tunnel under different seismic wave types and different seismic wave excitation peaks.
The purpose of the study is to obtain the acceleration response law of the tunnel through the large-scale shaking table test. The loss mechanism of tunnel under earthquake dynamic action is revealed. There are mainly the following innovations. (1) In this paper, the physical model test of shallow tunnel with bias and small clear distance is carried out. (2) By analyzing the acceleration response data of the tunnel, the acceleration response law is obtained. (3) The acceleration response law of seismic wave in different directions is discussed.
2. Shaking table test scheme
2.1. Similar design
According to the similarity theory, the parameters of the model and prototype must satisfy the similarity relationship. Geometric similarity ratio, acceleration similarity ratio and density similarity ratio are the main control factors of similarity relationship. Considering the size of shaking table, relevant parameters of testing instrument, bearing capacity and boundary effect of model, it is determined that 10, 1, 1, and other main similar constants can be derived from similarity theory and dimensional analysis method [16, 17]. The main similar constants of the model are shown in Table 1.
2.2. Test equipment
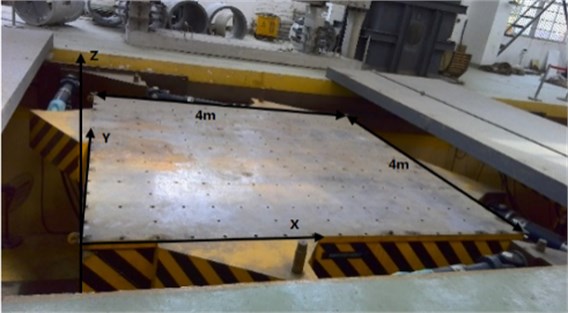
The test was carried out in the National Engineering Laboratory of high-speed railway construction technology, Central South University by a three to six degree of freedom vibration table. The size of the vibration table top is 4.0 m × 4.0 m (length × width). The maximum load of each table top is 30 ton. The working frequency is 0.1-50.0 Hz. The maximum displacement of the table top is 250 mm in and directions and 160 mm in -direction. The maximum acceleration in , and directions is ±1.0 g, ±1.0 g and ±1.6 g, respectively. The equipment is shown in Fig. 1.
Table 1Model principal similarity constant
Serial number | Physical quantity | Expression formula | Similarity ratio |
1 | Length / m | 10 | |
2 | Density / (kg·m-3) | 1 | |
3 | Modulus of elasticity / MPa | 10 | |
4 | Strain | 1 | |
5 | Stress / kPa | 10 | |
6 | Poisson’s ratio | 1 | |
7 | Time / s | 3.16 | |
8 | Acceleration / (m·s-2) | 1 | |
9 | Displacement / mm | 10 | |
10 | Velocity / (mm·s-1) | 3.16 | |
11 | Frequency / Hz | 1 | |
12 | Internal friction angle / ° | 1 | |
13 | Bulk density / (kN·m-3) | 1 | |
14 | Cohesive force / (kPa) | 10 |
Fig. 1Shaking table
2.3. Boundary design of model box
The rigid model box is used in the test, and its internal dimension is 3.5 m × 1.5 m × 2.1 m (length × width × height). In fact, the test prototype is a semi-infinite body, and the model in the test will be constrained by the model box. At the same time, the boundary of the model box will reflect the seismic wave in the process of vibration, and the model box effect will appear [18]. In order to reduce the influence of model box effect on the test results, it is necessary to deal with the boundary of model box. The bottom of the model box is treated as a friction boundary; the inner wall of the model box parallel to the tunnel axis is treated as a flexible boundary; the inner wall of the model box perpendicular to the tunnel axis is treated as a sliding boundary [19-23]. Through the modal analysis of the model, we know that the natural frequency of the model is far away from the natural frequency of the model box, and there is no resonance between the model box and the test model in the shaking table test.
2.4. Physical test model
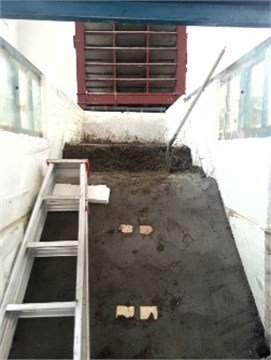
The lining model is made of micro concrete, and the wire mesh is used to simulate the reinforcement mesh in the lining [24]. According to the similarity constant and similarity ratio, the thickness of lining model is 4cm and the strength is 5 MPa. Through theoretical calculation and multiple tests, the optimal ratio of lining model material is 1:6.9:1.3 (cement: Sand: water). On the right side of the tunnel, there is a rock slope with a slope of about 1:1.04. The surrounding rock of the tunnel is divided into three layers, i.e. class III weakly weathered rock, class IV soft rock and class III hard rock from the bottom to the top. The surrounding rock is simulated with mortar similar to the rock stratum. The material ratio is M10 mortar 1:5.58:1.04 (Cement: Sand: Water), M5 mortar 1:7.25:1.35 (Cement: Sand: Water) and M7.5 mortar 1:6.30:1.17 (Cement: Sand: Water). According to the similarity ratio, the buried depth of the tunnel is 0.9 m, the width of the tunnel is 0.7 m, and the thickness of the middle rock pillar is 0.4 m. The surrounding rock is shown in Fig. 2 and Fig. 3, and the physical and mechanical parameters of surrounding rock and lining model are shown in Table 2.
Table 2Material parameters of surrounding rock model
Rock mass classification | Bulk density / (kN/m³) | Modulus of elasticity / GPa | Poisson’s ratio | Internal friction angle / ° | Cohesive force /kPa |
Weak weathered rock | 23 | 0.6 | 0.25 | 39 | 70 |
Soft rock | 20 | 0.13 | 0.3 | 27 | 20 |
Hard rock | 25 | 1.89 | 0.3 | 50 | 150 |
Lining (shotcrete) | 24 | 3.45 | 0.167 | – | – |
Fig. 2Physical test model of surrounding rock
2.5. Arrangement of sensors
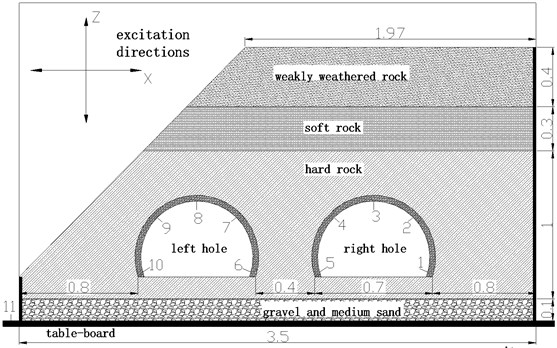
The model of the accelerometer is 1221L-002, the range is ±20 m/s2, and the sensitivity is 2000 mv/g. According to the research results [25], it is known that the stress or deformation of the tunnel lining reaches the maximum in the conjugate 45° direction of the tunnel cross section. Five key measuring points are arranged at the arch foot, arch shoulder and arch crown of the inner wall of each tunnel lining, with the number of measuring points of the left tunnel ranging from 1 to 5, the number of measuring points of the right tunnel ranging from 6 to 10, and one measuring point with the number of 11 is arranged on the table top. The specific arrangement of each sensor is shown in Fig. 3.
Fig. 3Surrounding rock distribution and sensor layout (unit:m)
2.6. Seismic waves
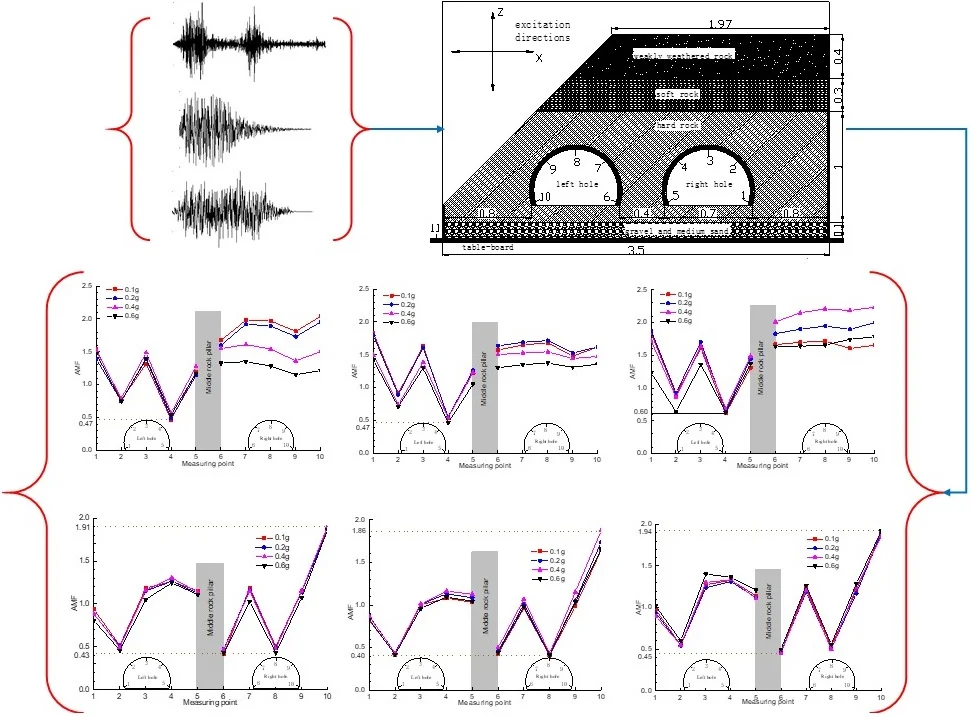
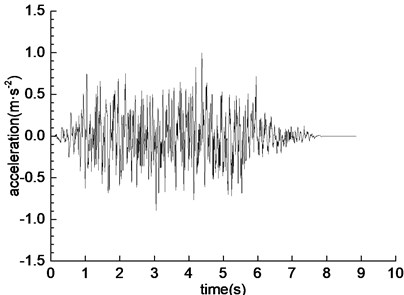
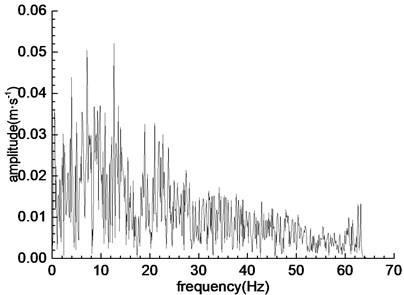
The two-way Wenchuan wave (WC-XZ), Darui artificial wave (DR-XZ) and Kobe wave (K-XZ) were used as the loading wave of shaking table test. The horizontal direction (X-direction) of the seismic wave is vertical to the tunnel axis, and the vertical direction (Z-direction) is vertical to the vibration table. The acceleration time history curve and Fourier spectrum of the three loading waves are shown in Fig. 3, Fig. 4 and Fig. 5, respectively. The predominant frequencies of Wenchuan wave, Darui artificial wave and Kobe wave are 16-20 Hz, 6-13 Hz and 5-12 Hz, respectively.
According to the code [26, 27], the corresponding excitation peak values (0.1 g, 0.2 g, 0.4 g and 0.6 g) of seismic intensity (7 degrees, 8 degrees, 9 degrees and 10 degrees) are adjusted and loaded step by step. When loading -direction and -direction at the same time, considering that the -direction loading wave is less and the -direction loading wave reaches the peak acceleration at the same time [28], the -direction seismic wave is loaded by 2/3 times of the peak acceleration of -direction seismic wave [26]. In order to observe the change of the dynamic characteristics of the model, the white noise (WN-XZ) is loaded for 60s before each seismic wave. There are 16 working conditions in the test, and the specific loading system is shown in Table 3.
Table 3Loading plan of shaking table test
Serial number | Working condition code | Peak acceleration/g | |
Horizontal direction | Vertical direction | ||
1 | WN-XZ | – | – |
2 | WC-XZ | 0.1 | 0.067 |
3 | DR-XZ | 0.1 | 0.067 |
4 | K-XZ | 0.1 | 0.067 |
5 | WN-XZ | – | – |
6 | WC-XZ | 0.2 | 0.133 |
7 | DR-XZ | 0.2 | 0.133 |
8 | K-XZ | 0.2 | 0.133 |
9 | WN-XZ | – | – |
10 | WC-XZ | 0.4 | 0.267 |
11 | DR-XZ | 0.4 | 0.267 |
12 | K-XZ | 0.4 | 0.267 |
13 | WN-XZ | – | – |
14 | WC-XZ | 0.6 | 0.400 |
15 | DR-XZ | 0.6 | 0.400 |
16 | K-XZ | 0.6 | 0.400 |
Fig. 4Acceleration time-history curves and Fourier spectrums
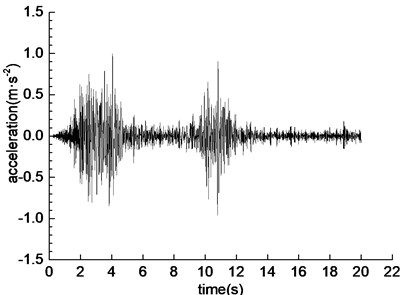
a) Time history curve of WC-XZ
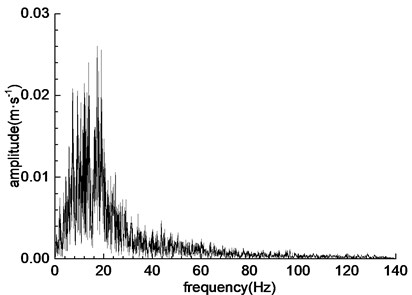
b) Fourier spectrum of WC-XZ
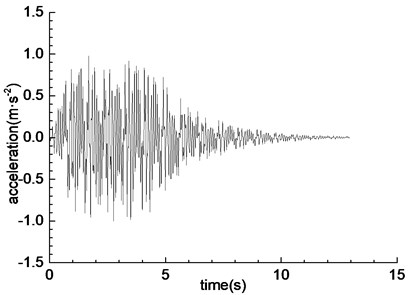
c) Time history curve of DR-XZ
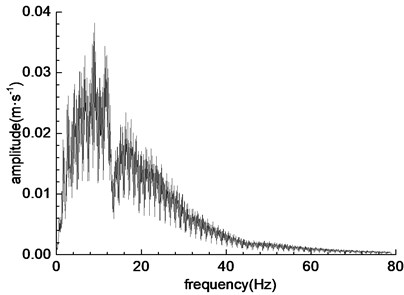
d) Fourier spectrum of DR-XZ
e) Time history curve of K-XZ
f) Fourier spectrum of K-XZ
3. Dynamic response law of tunnel acceleration
The acceleration amplification coefficient is used to describe the acceleration response characteristics of tunnel with shallow bias and small clear distance. The acceleration amplification coefficient is defined as the ratio of the peak value of the response in , -direction to the peak value of the response in , -direction of the vibration table, respectively. The specific value can be calculated by Eq. (1):
where, is the acceleration amplification factor. is the peak value of acceleration response of measuring point (1-10). is the peak value of acceleration response on vibration table.
3.1. Dynamic response law of horizontal acceleration
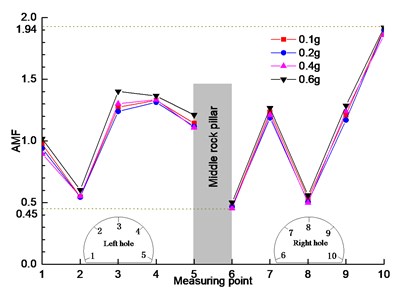
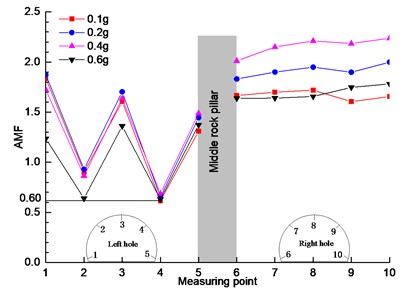
Under the conditions of different seismic wave types and different seismic wave excitation peak values, the change rule of acceleration amplification coefficient of each measuring point in the horizontal direction (-direction) of left and right tunnel is shown in Fig. 5. The relationship between acceleration amplification coefficient and excitation wave is shown in Fig. 6.
Fig. 5Variation laws of acceleration amplification coefficient in the horizontal direction (x-direction)
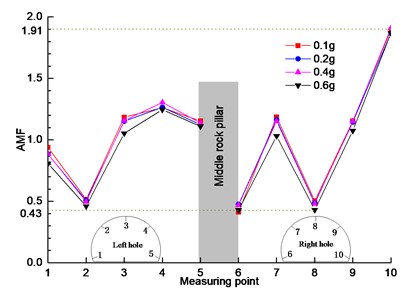
a) WC-XZ
b) DR-XZ
c) K-XZ
It can be seen from Fig. 5(a) that under the action of Wenchuan wave (WC-XZ), the acceleration amplification coefficients of left hole and right hole are quite different in the change trend and value. The left tunnel shows a trend of decreasing first and then increasing. The minimum value of acceleration amplification coefficient at measuring point 2 is 0.43, and the values of acceleration amplification coefficient at measuring point 2 of the right half arch are all greater than 1, indicating that the left half arch has a weakening effect on seismic wave, while the right half arch has a amplification effect. The main reason is that the surrounding rock layer on the left side of the left tunnel is relatively thick and stable, while on the right side of the right half arch is the middle rock column with a thickness of only 0.4 m, which has poor structural stability and strong dynamic response. Under the excitation of seismic wave, the interaction between the middle rock column and the structure of the left tunnel results in the acceleration response of the right half of the left tunnel is stronger than that of the left half, and has amplification effect on the excitation wave.
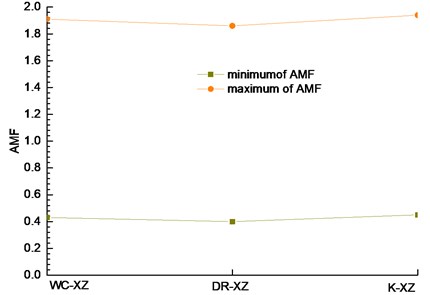
Fig. 6Relationship between amplification factor and excited wave in the horizontal direction (x-direction)
The right hole shows a “N” shape change trend. The minimum value of acceleration amplification factor at measuring point 6 and 8 is 0.5, and the maximum value of acceleration amplification factor at measuring point 10 is 1.91. The main reason for this phenomenon is that the left half arch of the right tunnel is affected by the middle rock column, while the right half arch is affected by the right-side slope. Due to the existence of the slope on the right side, the surrounding rock pressure of the right tunnel is seriously uneven distribution, which aggravates the degree of bias pressure under the action of seismic wave excitation, making the amplification coefficient of the closest measuring point 10 to the slope toe reach the maximum of 1.91, and the amplification of the loading wave is nearly twice. The results show that the rock between the slope toe and the right hole measuring point 10 has poor stability under the earthquake, and is most likely to be damaged in the earthquake. In the process of seismic wave excitation, the coupling effect between the existing slope and the right tunnel affects the acceleration response law of the right tunnel, which makes the acceleration response law of the right tunnel very different from that of the left tunnel. The unsymmetrical distribution of surrounding rock pressure caused by slope has a great influence on the acceleration response of tunnel.
Under the action of different seismic wave excitation peaks, the change trend of acceleration amplification coefficient between the excitation peaks is basically the same, and the acceleration amplification coefficient value of the same measuring point is basically the same, which shows that in the horizontal direction of seismic wave excitation, the acceleration excitation peak has little influence on the acceleration response.
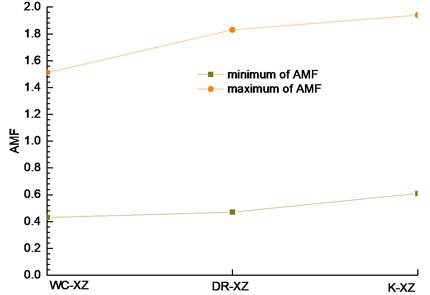
In Fig. 5(b) and (c), the trend of acceleration amplification coefficient under the action of Darui artificial wave and Kobe wave is similar to that in Fig. 5(a), and the change rule is basically the same. It can be seen from Fig. 6 that under the same excitation peak (measuring point 10 as the maximum value reference and measuring point 6 as the minimum value reference), the acceleration amplification coefficient changes slightly with the change of seismic wave, and there is only a small difference among the three seismic waves. It shows that in horizontal direction, the type of seismic wave has little effect on acceleration response of measuring point. The main reason may be that the energy of the two-way loading wave in the horizontal direction is approximately the same. In the left and right tunnels, the acceleration response of the right half arch is the strongest, mainly because the left tunnel is affected by the middle rock column, and the right tunnel is affected by the existing slope.
3.2. Dynamic response law of vertical acceleration
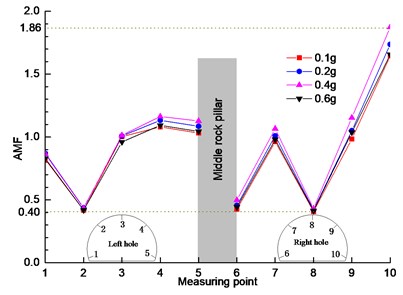
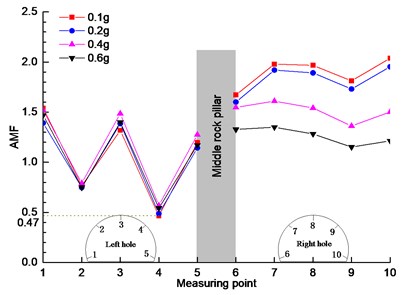
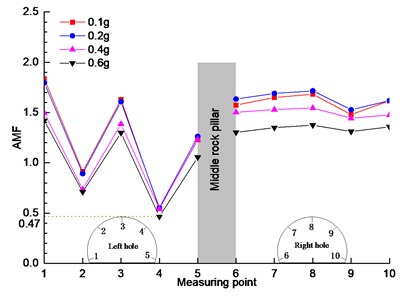
Under the conditions of different seismic wave types and different seismic wave excitation peak values, the change rule of acceleration amplification coefficient of each measuring point in the vertical direction (-direction) of left and right holes is shown in Fig. 7. The relationship between acceleration amplification factor and excitation wave is shown in Fig. 8.
Fig. 7Variation laws of acceleration amplification coefficient in the vertical direction (z-direction)
a) WC-XZ
b) DR-XZ
c) K-XZ
It can be seen from Fig. 7(a) that under the action of Wenchuan wave (WC-XZ), the acceleration amplification coefficients of the left and right measuring points are quite different in the change trend and value. The left hole shows a trend of “W” shape change. The minimum value of acceleration amplification coefficient at measuring point 4 is 0.47. The acceleration amplification coefficient at measuring points 2 and 4 is less than 1, which has a weakening effect on seismic wave excitation. The acceleration amplification coefficient at measuring points 1, 3 and 5 is more than 1, which has a enlarging effect on seismic wave excitation. The response of the left half arch of the left tunnel is larger than that of the right half arch, mainly because the pressure of the surrounding rock of the upper layer on the left half arch is larger, and the response in the vertical direction is stronger in the process of seismic wave excitation. From the change trend of the left tunnel, it can be seen that the vertical response is closely related to the pressure of the upper surrounding rock.
Compared with the left hole, the right hole has different trends and values under different excitation peaks. The acceleration amplification coefficient of the measuring point 10 reaches 2.1. The main reason for this phenomenon is that the right tunnel is affected by the existing slope on the right side. Due to the existence of the existing slope on the right side, the surrounding rock pressure of the right tunnel is not evenly distributed, which aggravates the degree of bias pressure under the seismic wave excitation, and makes the acceleration response of the right tunnel more complex. In the process of seismic wave excitation, the model has a “rising effect” in the vertical direction. The results show that the stability of the structure between the existing slope and the right tunnel is poor under the earthquake action, and the structure is most likely to be damaged in the earthquake.
Under the action of different excitation peaks, the variation trend of each excitation peak value of the left tunnel is basically the same, and the acceleration amplification factor value of the same measuring point is basically the same, which shows that the acceleration excitation peak value has little influence on the acceleration response of the left tunnel. However, there are different laws in the right tunnel, and the variation trend of the peak values of the right tunnel excitation is different, and the acceleration amplification factor values of the same measuring point are very different, which shows that the peak value of acceleration excitation has a great influence on the acceleration response of the tunnel, the main reason for this effect is that the existing slope results in the uneven distribution of the surrounding rock pressure of the right tunnel, which is caused by the seismic wave excitation During the process of vibration, the asymmetric surrounding rock pressure interferes with the acceleration response of the lining measuring point. In the case of different excitation peaks, the degree of interference is different.
In Fig. 7(b) and (c), the variation trend of acceleration amplification coefficient under the action of Darui artificial wave and Kobe wave is different from that in Fig. 5(a). It is shown that the acceleration response in the vertical direction is affected by the type of loading wave. It can be seen from Fig. 7 that under the same excitation peak (measuring point 1 as the maximum reference and measuring point 4 as the minimum reference), the acceleration amplification coefficient changes significantly with the change of seismic wave, which shows that in the vertical direction, the type of seismic wave has a greater impact on the acceleration response of measuring point, and the Kobe wave has the greatest impact, followed by the large Rayleigh wave and the Wenchuan wave. The main reason may be that the two-way loading wave affects the energy of the loading wave in the vertical direction, which makes the vertical direction have a greater energy effect.
It can be seen from the comparison between Fig. 5 and Fig. 7 that the acceleration response has directionality and varies greatly in different directions. It shows that in the process of seismic wave excitation, the dynamic action of the same location in different directions is very different. Therefore, in the aseismic design of the tunnel, different aseismic measures should be adopted according to the response in different directions to achieve the best aseismic effect.
Fig. 8Relationship between amplification factor and excited wave in the vertical direction (z-direction)
4. Conclusions
Based on the large-scale shaking table test of small clear distance tunnel model with shallow bias, the seismic acceleration response law of small clear distance tunnel with shallow bias is studied. The conclusion is as follows:
1) In the horizontal direction, the type of seismic wave has little influence on the acceleration response of the measuring points; in the vertical direction, the acceleration amplification coefficient of each measuring point in the left and right tunnels is affected by the type of loading wave, and the Kobe wave has the largest influence, followed by the large Rayleigh wave, and the Wenchuan wave is the smallest. The acceleration amplification coefficient under different peak excitation conditions has basically the same change trend, and the same measurement. The acceleration amplification factor of the point is basically the same, and the peak value of acceleration excitation has little effect on the acceleration response.
2) The coupling effect of the existing slope and the right tunnel in the earthquake process affects the acceleration response law of the right tunnel, which makes the acceleration response law of the right tunnel very different from that of the left tunnel. The unsymmetrical distribution of surrounding rock pressure caused by slope has a great influence on the acceleration response of tunnel.
3) The peak value of the acceleration response in the vertical direction of the tunnel is larger than that in the horizontal direction. The acceleration amplification coefficient in the vertical direction of the same measuring point is generally 1.02-3.94 times of that in the horizontal direction. In the seismic design of tunnels, different seismic measures should be adopted in different directions to achieve the best seismic effect.
4) Based on the large-scale shaking table model test, the displacement response, internal force response and seismic measures of the tunnel will be studied.
References
-
Wang Z. Z., Zhang Z. Seismic damage classification and risk Assessment of mountain tunnels with a validation for the 2008 Wenchuan earthquake. Soil Dynamic and Earthquake Engineering, Vol. 45, Issue 2, 2013, p. 45-55.
-
Wang M. S. China Railway, tunnel and underground space development survey. Tunnel Construction, Vol. 30, Issue 4, 2010, p. 351-364.
-
Wang F. F., Jiang X. L., Niu J. Y., Yang H. Experimental study on seismic dynamic characteristics of shallow bias tunnel with a small space. Shock and Vibration, Vol. 2018, 2018, p. 6412841.
-
Shishegaran A., Rahimi S., Darabi H. Introducing box-plate beam-to-column moment connections. Vibroengineering Procedia, Vol. 11, 2017, p. 200-204.
-
Mohammad Reza Ghasemi, Aydin Shishegaran Role of slanted reinforcement on bending capacity SS beams. Vibroengineering Procedia, Vol. 11, 2017, p. 195-199.
-
Reza Abbasnia, Foad Mohajeri Nav, Nima Usefi A new method for progressive collapse analysis of RC frames. Structural Engineering and Mechanics, Vol. 60, Issue 1, 2016, p. 31-50.
-
Aydin Shishegaran, Mohammad Reza Ghasemi, Hesam Varaee Performance of a novel bent-up bars system not interacting with concrete. Frontiers of Structural and Civil Engineering, Vol. 13, Issue 6, 2019, p. 1301-1315.
-
Zhao D. P., Wang M. N. Study on the response of the small clear distance tunnel blasting vibration in the. Geotechnical Engineering Journal, Vol. 29, Issue 1, 2007, p. 114-119.
-
Wang M. N., Pan X. M., Zhang C. M., et al. Study on the vibration response of adjacent tunnel blasting. Rock and Soil Mechanics, Vol. 25, Issue 3, 2004, p. 412-414.
-
Zhu Zh G., Sun M. L., Zhu Y. Q., et al. Field monitoring on blasting vibration and dynamic response of ultra-small spacing tunnels. Rock and Soil Mechanics, Vol. 33, Issue 12, 2012, p. 3747-3753.
-
Liu Sh Y., Chen J. P. Monitoring and analysis of blasting vibration in Daxuanling tunnel with small clear space. Blasting, Vol. 25, Issue 2, 2008, p. 92-94.
-
Yuan Song Study on reasonable clear distance of highway tunnel under seismic dynamic response. Southwest Jiaotong University, Chengdu, 2008.
-
Huang J., Peng L. M., Lei M. F., et al. Seismic response and capacity safety analysis of shallow-embedded bias tunnels with small clear distance. Journal of Railway Science and Engineering, Vol. 9, Issue 4, 2012, p. 58-61.
-
Lu Q., Liu X. X., He X. Time-history response analysis of small spacing tunnel. Chongqing Building, Vol. 8, Issue 73, 2009, p. 23-25.
-
Ling Yanting Comparative study on seismic dynamic response of highway double arch tunnel and small clear distance tunnel. Southwest Jiaotong University, Chengdu, 2009.
-
Meymand P. J. Shaking Table Scale Model Tests of Nonlinear Soil-pile-superstructure Interaction in Soft Clay. University of California, Berkeley, 1998.
-
Iai S. Similitude for shaking table tests on soil-structure-fluid model in 1-g gravitational field. Soils and Foundations, Vol. 29, Issue 1, 1989, p. 105-108.
-
Lu X. L., Chen Y. Q., Chen B., et al. Shaking table testing of dynamic soil-structure interaction system. Earthquake Engineering and Engineering Vibration, Vol. 20, Issue 4, 2000, p. 20-29.
-
Jiang X. L., Chen J., Yang H., et al. Study on seismic response characteristics of unsymmetrically loaded tunnel based on large-scale shaking table test. Journal of Natural Disasters, Vol. 25, Issue 5, 2016, p. 158-166.
-
Jiang X. L., Wang F. F., Yang H., et al. Study on seismic lining strain law of shallow-buried bias tunnel with small clear distance. Chinese Journal of Underground Space and Engineering, Vol. 13, Issue 2, 2017, p. 506-516.
-
Jiang X. L., Lian P. Y., Yang H., et al. Large-scale shaking table model test study of unsymmetrical loading neighborhood tunnel with shallow depth. Chinese Journal of Applied Mechanics, Vol. 34, Issue 3, 2017, p. 456-463.
-
Wang F. F., Jiang X. L., Niu J. Y. The large-scale shaking table model test of the shallow-bias tunnel with a small clear distance. Geotechnical and Geological Engineering, Vol. 35, Issue 3, 2017, p. 1093-1110.
-
Jiang X. L., Niu J. Y., Lian P. Y., et al. Large-scale shaking table test study on seismic response characteristics of rock slope with small spacing tunnel. Engineering Mechanics, Vol. 34, Issue 5, 2017, p. 132-141.
-
Xu Y. X., Zhu Y. H., Lu Sh W. Shaking table model test of New Yunnan Provincial Museum. Journal of Building Structures, Vol. 32, Issue 10, 2011, p. 39-47.
-
He Ch, Li L., Zhang J., et al. Seismic damage mechanism of tunnels through fault zones. Geotechnical Engineering Journal, Vol. 32, Issue 10, 2014, p. 39-47.
-
The National Standards Compilation Group of Peoples Republic of China GB50011-2010 Code for seismic design of buildings. Beijing China Architecture and Building Press, 2011.
-
The National Standards Compilation Group of People’s Republic of China GB50011-2006 Code for seismic design of railway engineering. China Planning Press, 2009.
-
Nouri H., Fakher A., Jones C. J. F. P. Evaluating the effects of the magnitude and amplification of pseudo-static acceleration on reinforced soil slopes and walls using the limit equilibrium horizontal slices method. Geotextiles and Geomembranes, Vol. 26, Issue 3, 2008, p. 263-278.
About this article

Thanks to the funding support from Key Special Projects of National Key Research and Development Plan (No. 2016YFC 0802206-3); National Natural Science Fund (No. 41472262); Chongqing University Innovation Research Group (No. CXQT19021); High Level Technical Personnel Training Project of Transportation Industry (No. 2018-26); Congo International Research and Development Center for Mineral Resources Development of Copper and Cobalt (No. 2018WK2052).
