Abstract
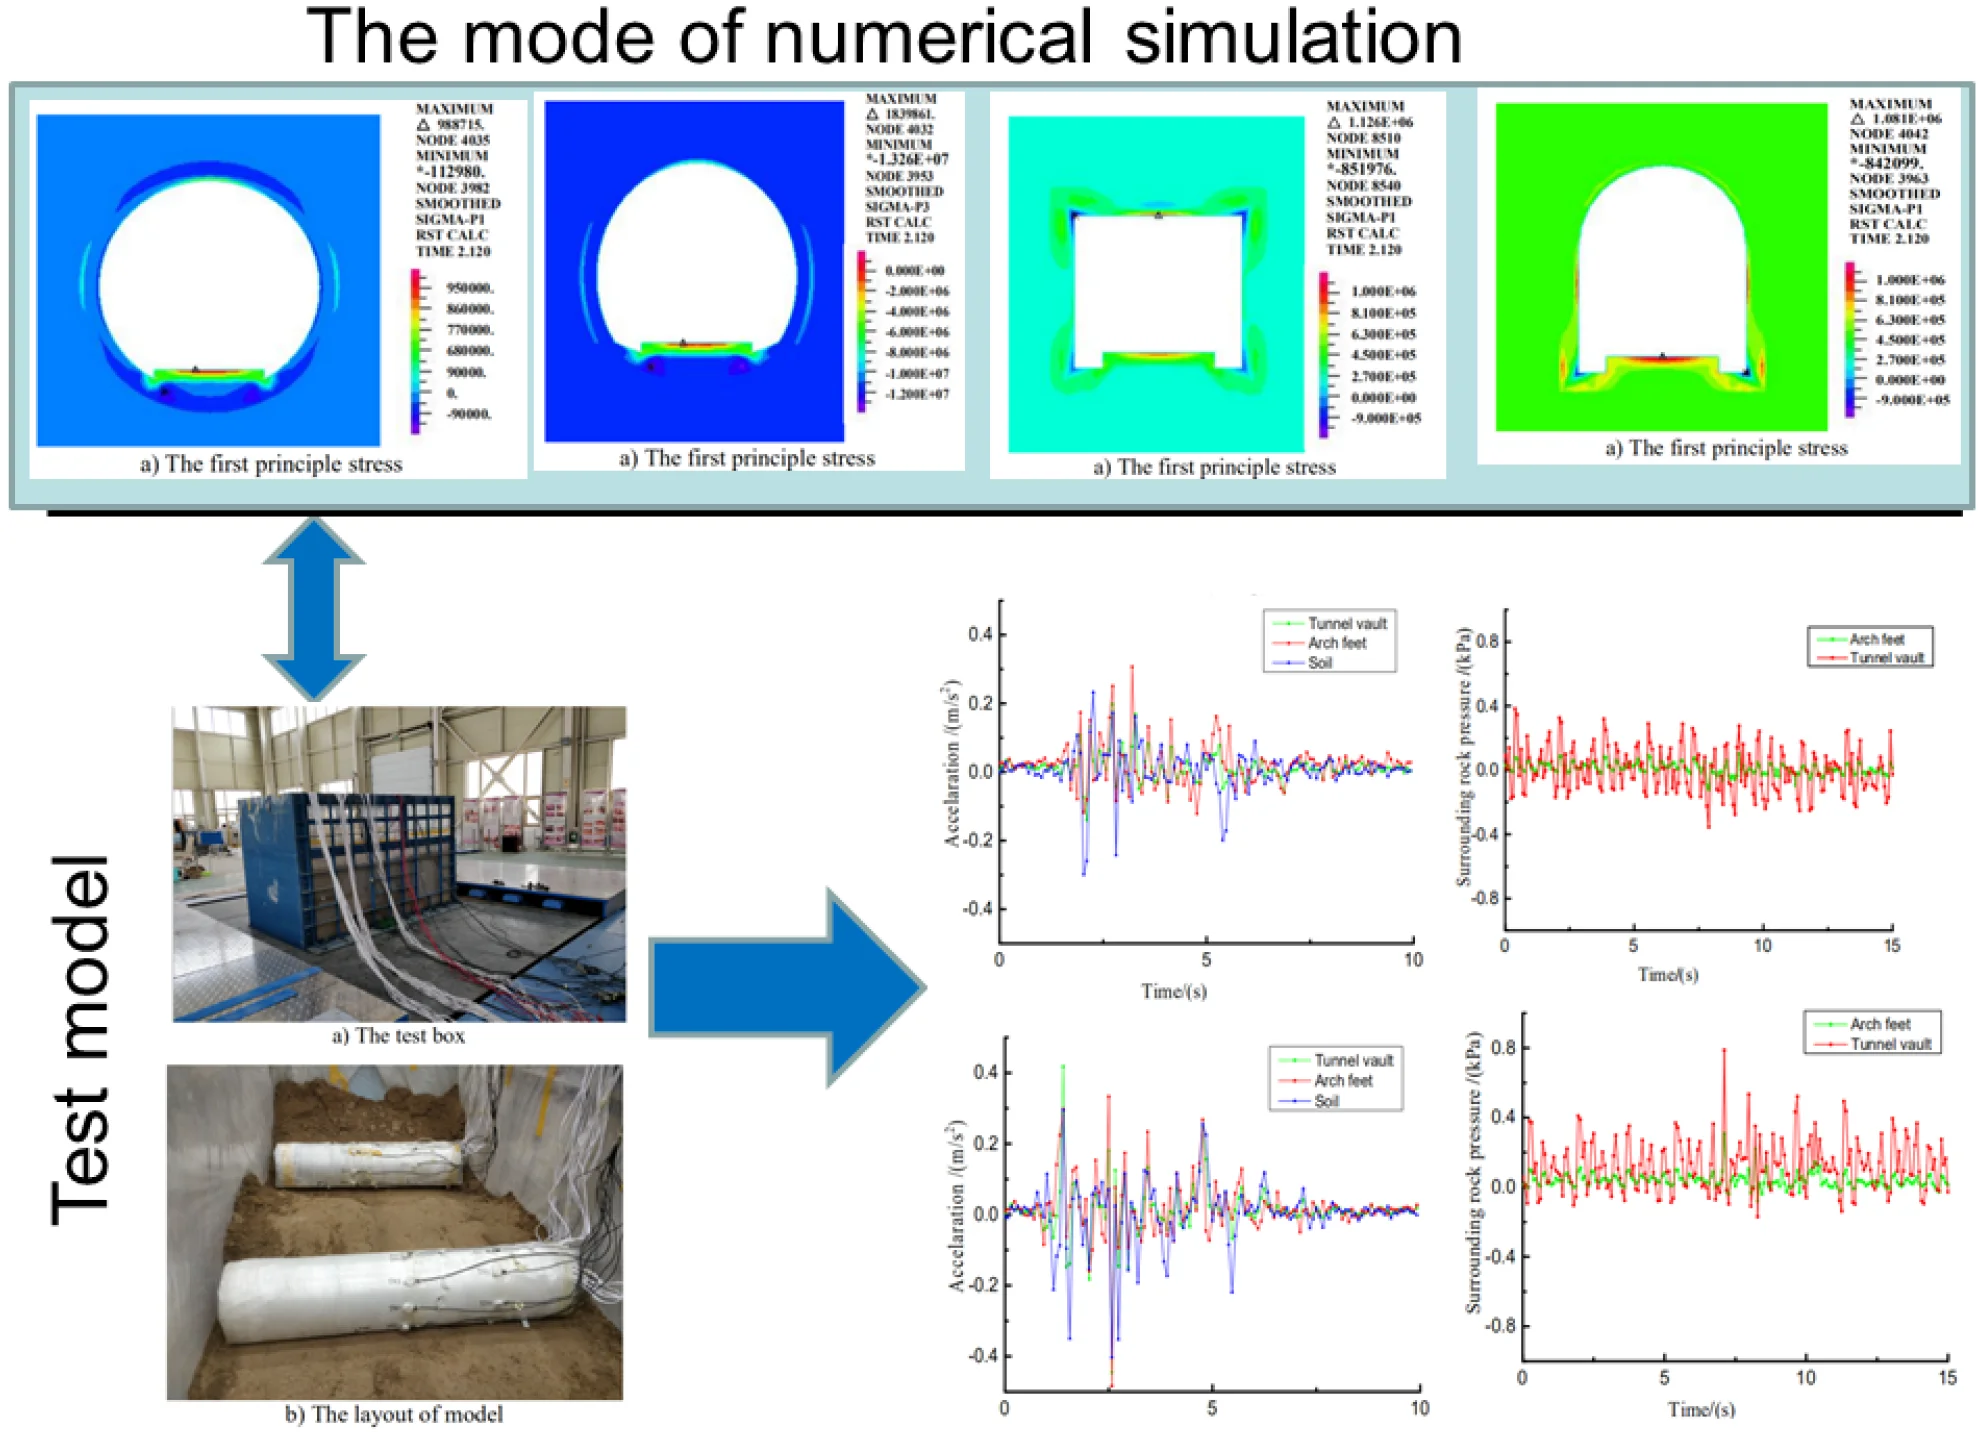
Four tunnel models with different cross sections were established, and the models were coupled with fluid models to investigate rainwater seepage-, earthquake- and train-induced effects. The displacements, stresses and pore water pressures of key points in the loess tunnels were analyzed, and the dynamic response patterns of loess tunnels under the influence of earthquakes, rainwater seepage and train loading were obtained. The results show that the dynamic responses of loess tunnels with different cross sections vary. Although the patterns of acceleration and displacement in the four loess tunnel sections are basically identical, the peaks of acceleration and displacement are lowest in the circular tunnel and highest in the rectangular tunnel. Furthermore, obvious stress differences exist among the different sections. The stress is lowest in the circular loess tunnel, intermediate in the curved-wall and straight-walled arch tunnels, and highest in the rectangular tunnel. The pore water pressures of loess tunnels increase with increasing depth, but the differences are not large. Shaking-table testing of a curved tunnel was carried out, and the results were consistent with the numerical results.
Highlights
- A 1/40 model shaking table test is carried out.
- The rules of seismic response under the condition of rainfall is studied.
- Dynamic responses of loess tunnels with different cross sections under the action of earthquakes, rainwater seepage and trains
1. Introduction
Loess is widespread and common in highly seismically active areas. The unfavorable characteristics of loess have caused great difficulty in the construction and normal use of loess tunnels. Because loess is deeply buried, human engineering activities seldom involve loess strata. Therefore, research on the engineering properties of loess mainly focuses on the superficial and loess strata. However, with the longitudinal development of cities in loess areas and the construction of large-scale infrastructure projects, more and more projects have begun to involve loess strata. Rain seepage sharply decreases the shear strength of loess, leading to instability in loess tunnels. Moreover, high-speed trains have strict requirements for the dynamic stability of loess tunnels. These factors make the dynamic response of a loess tunnel very complex. Therefore, research into the seismic dynamic responses of loess tunnels to the effects of earthquakes, seepage and trains is of great significance for the design and construction of loess tunnels. Many studies have been published on the responses of loess tunnels to seismicity, seepage and dynamic traffic loads. Anastasopoulos et al. [1] analyzed the dynamic response of a loess tunnel in a seismically active region and discussed the necessity and safety of the burial depth of loess tunnels. In the existing literature [2-4], the strength-reduction method has been used to analyze the stability of tunnels. Considering the influences of the seismic intensity, tunnel width, overlying thickness and other factors on the tunnel safety and stability, Cheng et al. [5-7] used the strength-reduction method to analyze the static and dynamic stability of the loess mass surrounding an unlined, wide, egg-shaped and straight-walled loess tunnel. Cilingir and Madabhushi [8] studied the effects of seismic activity on the behavior of circular and square tunnels, and the results show that the magnitude of the maximum input acceleration played a crucial role in determining the maximum and residual lining forces that the tunnel experienced. Abdoun et al. [9] studied the results of five pairs of centrifuge tests designed to investigate the influences of various factors on the behavior of buried high-density polyethylene pipelines subjected to strike-slip faulting. In the existing literature [10-13], different methods have been used to study the influence of single factors of earthquakes on the dynamic responses of tunnels. Existing literature [14-19] has summarized the influence of rainwater seepage on the stability of various tunnels. Wang et al. [20] studied the collapsibility and additional stress changes in the loess foundation under different water conditions in the loess tunnel of the Xi'an Metro Line 4 and found that the compressive stress and collapsibility deformation of the tunnel were larger in the presence of water seepage. Furthermore, existing literature [21-23] has studied the influence of train loads on tunnel stability. Feldgun et al. [24] performed a coupled simulation of an explosion inside a lined cavity. Li et al. [25] simulated the vibration load of a high-speed train using the excitation function and analyzed the dynamic response of a tunnel with a large cross section under vibration loading using elasto-plastic FEM. The influences of the tunnel section shape, vehicle speed and damping ratio on the dynamic response were studied, and the research results were compared with those obtained for a tunnel with a small cross section. The results showed that the influence of the train vibration on the tunnel was related to the size of the tunnel cross section. Augarde and Burd [26] described finite-element procedures developed to model the ground movements when a shallow tunnel is installed in clay soil and discussed two different ways of modeling the liner (based on continuum elements and shell elements). The results confirmed that a thin layer of continuum elements may be used satisfactorily to model tunnel linings in a soil-structure interaction analysis. Cheng et al. [27] discussed the dynamic parameters of loess and studied the seismic stability of a tunnel considering the dynamic geologic processes of loess. In summary, although existing literature has studied the dynamic responses of loess tunnels with different cross sections, existing studies have mainly been concerned with the influence of a single factor (earthquakes, seepage or train loads). However, research on the dynamic responses of loess tunnels with different cross sections to the effects of earthquakes, rain seepage, and train loading has not yet been reported. Loess tunnels are under the coupled effects of earthquakes, rainwater seepage and train loads, and the corresponding influence on the structure of the loess tunnel is complex and changes continuously over time and space. The traditional method only studies the influence of a single factor on the loess tunnel, and this paper ameliorates the current methods to facilitate the study of the dynamic response laws of loess tunnels under the action of multiple factors (earthquakes, rain seepage and train loads). The results are more applicable to engineering practice and are more representative. This paper transitions the research of loess tunnels from the single-unsafe factor analysis method to a multi-factor coupling analysis method and moves from a single-field analysis to a multi-field coupling complex-state study, which can provide a reference for future engineering practice. Due to the special nature of loess, loess is selected as the foundation soil layer of the tunnel. In this paper, FEM is applied to loess to systematically analyze the dynamic responses of loess tunnels with circular, curved, rectangular and straight-walled arches under the influences of earthquakes, seepage and train loads. The dynamic responses of the four types of loess tunnels under the coupled effects of earthquakes, seepage and train loads are obtained. The dynamic responses of curved tunnels under seepage and earthquakes is verified by an experiment.
2. Coupling mechanism for seepage and stress fields
In the process of fluid-solid coupling (Biot, 1942), the fluid field is applied to the solid field, and the deformation of the structure in turn affects the fluid region. The mathematical model of the coupling of the seepage field and the stress field in a loess tunnel can be expressed as (He and Xie, 2007):
where, is time, is the unit weight of the groundwater, is porosity of the loess mass, is the bulk elastic modulus of the groundwater, is the stress matrix of the loess mass, is the strain matrix neglecting the penetration pressure, is the volume strain increment matrix for the loess deformation caused by the seepage water pressure, and is the head distribution increment. is an elastic matrix, which can be expressed as follows:
The seepage field can be solved by FEM, and the stress field can be solved according to the interaction between the seepage field and the stress field. Through conducting the iterative method until the results meet the accuracy requirements, the head distribution of the seepage field and the distribution of the stress field can be obtained by the following coupling calculations:
Eq. (3) represents the numerical solution for the coupled seepage and stress fields in a loess tunnel. and are the head distributions obtained from the -th iteration and the ()-th iteration, respectively, and and are the stress field distributions obtained from the -th iteration and the ()-th iteration, respectively.
3. Seismic wave and high-speed train excitation loads
3.1. Seismic wave
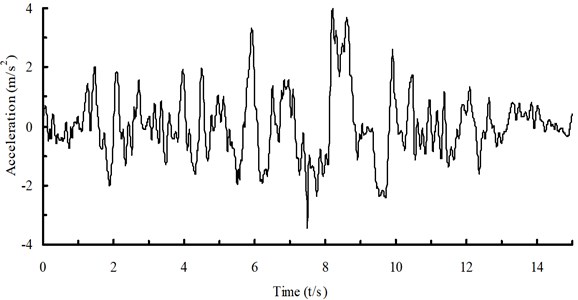
Seismic wave data recorded during the El Centro earthquake are selected for use in the seismic response analysis. The EI Centro waves had more energy than do other seismic waves with a similar period, and they are very representative. Velocity pulses are the most common in near-field earthquakes. Moreover, middle-period and long-period components are abundant, and the associated pulse peaks are large. According to the characteristics of seismic waves, the selection principle, the hypocenter type and the hypocentral distance, a near-field seismic wave with pulses is selected from the Pacific Earthquake Engineering Research Center, and the acceleration magnitude of the seismic wave is adjusted to satisfy the requirements of seismic fortification. According to the duration and period characteristics of seismic waves, the duration of the seismic wave is selected as 15 s. The seismic wave is input from the bottom of the model in the form of acceleration. The time-history curve of the seismic acceleration is shown in Fig. 1.
Fig. 1Seismic wave (shear wave)
3.2. Train excitation load
At present, the first mock examination of the vehicle-load model for high-speed railway includes a vehicle track unified model (Elastic model) [28] and traditional railway vehicle vibration model (Rigid model). Because the main object of this paper is the tunnel model, the traditional vibration mode (Rigid model) of railway vehicles is adopted, and the whole track support is regarded as rigid, without considering the influence of the track subsystem. For the fixed foundation, only the contact elasticity between the wheel and rail is considered, and the wheel rail irregularity is input into the vehicle vibration system as the system excitation from the fixed rail surface. Existing results and data show that it is feasible to simulate train loads using an excitation force function. Based on the mechanism of the vibrational load, the literature [29] has improved the existing train load expression. The improved expression not only considers the movement and superposition effects of the force of the wheels on the rail but also fully considers the influences of rail irregularities and rail dispersion. This type of model is adopted in this paper and is expressed as follows:
where , and are the vibration loads that correspond to typical values of control conditions , and in Table 1; is the superposition coefficient of the adjacent wheel-rail force, and generally, 1.2-1.7; is the rail dispersion coefficient and is taken as 0.6-0.9; and is the vehicle static load.
The mass of the train spring is , and the corresponding amplitude of the vibration load is:
where is the typical vector height corresponding to irregularity control conditions , and in Table 1; is the vibration frequency corresponding to the irregularity control conditions and can be obtained using the formula ( is the speed of the train); and is the typical wavelength of the irregularity curve corresponding to control conditions , and in Table 1.
In this paper, the train excitation load parameters [30] are the unilateral static wheel load 80 kN, the mass of the spring 750 kg, and the train speed 320 km/h. The typical irregularity wavelengths and vector heights corresponding to control conditions , and in Table 1 are 10 m and 3.5 mm, 2 m and 0.4 mm, and 0.5 m and 0.08 mm, respectively. For speeds of 180-320 km/h, the ranges of the low-frequency, intermediate-frequency and high-frequency waves are 5-9, 25-45 and 100-200 Hz, respectively. In accordance with the above experimental rules, the excitation is an irregular waveform, as shown in Fig. 2.
Table 1Rail geometric irregularity management values in the UK
Control condition | Wavelength (m) | Vector height (mm) |
(According to the driving stability) | 50.0 | 16.0 |
20.0 | 9.0 | |
10.0 | 5.0 | |
(According to the additional dynamic load acting on the railway) | 5.0 | 2.5 |
2.0 | 0.6 | |
1.0 | 0.3 | |
(According to the wave wear) | 0.5 | 0.1 |
Fig. 2Time history curve of the train load
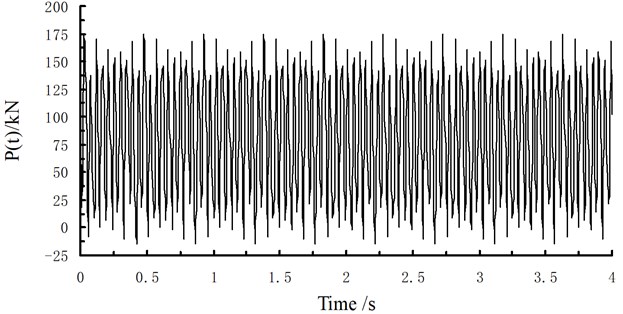
The train load is input on the bottom plane of the tunnel. Through preliminary analysis, the maximum response of the tunnel due to earthquakes generally occurs at 8-10 s; therefore, the train load is applied after 7 s, and the duration time of the train load is taken as 4 s. If the 7-th s in the seismic wave is seen as the 1-st s, drawing figures is very convenient. The gravity acting on the train is applied to the model in the form of a dead load, and the train load is applied to the model by defining the load load-time parameter history.
4. Analysis model
4.1. Boundary conditions
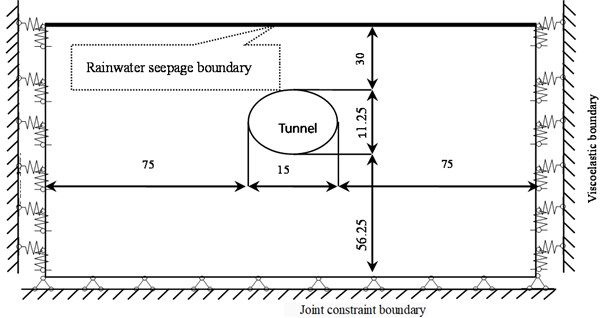
According to the existing literature [31], along the longitudinal direction of the loess tunnel, an isolated body with a thickness of unit 1 is taken from the semi-infinite space body. The lengths of both sides and the bottom of the model are taken as 5 times the tunnel width, and the upper length is taken as the free surface. The width of the tunnel model is 15 m, and the depth is 30 m. The contact surfaces of rainwater and loess are set as the seepage boundary. The viscoelastic artificial boundaries proposed by Deeks [32, 33] are used on both sides of the model. This boundary can simulate the scattering wave radiation and elastic recovery properties with good low-frequency stability and displacement convergence. At the bottom of the model, to input the seismic waves, a joint constraint boundary is used. The calculation model is shown in Fig. 3.
Fig. 3Analysis model (m)
4.2. Material parameters
For loess, the loess mass is regarded as an ideal isotropic elasto-plastic material. The Mohr-Coulomb yield criterion is adopted. The support structures of the loess mass are composed of a composite lining, shot concrete, a grid steel frame, steel mesh and mortar anchors. The concrete strengths are 28 MPa, 30 MPa and 33 MPa. The thickness of the primary lining is 300 mm, and the thickness of the secondary lining is 500 mm. According to rainfall in the loess area, a rainfall amount of 100 mm is supposed. The material parameters of the loess mass and the supporting structure are shown in Table 2, and the parameters of the train track are shown in Table 3. The material filling the tunnel bottom and track plate is concrete.
Table 2Material parameters
Material | Elastic modulus (MPa) | Poisson’s ratio | Unit weight (kN/m3) | Cohesion (kPa) | Angle of internal friction (°) |
Loess mass surrounding tunnel | 60 | 0.35 | 19 | 61.2 | 28 |
Primary lining | 3×10⁴ | 0.2 | 25 | 3180 | 54.9 |
Secondary lining | 3×10⁴ | 0.2 | 25 | 3180 | 54.9 |
Material | Porosity (%) | Permeability (m/s) | Tensile stress (MPa) | Compressive stress (MPa) | |
Loess mass surrounding tunnel | 0.2 | 1.0×10⁻⁶ | – | – | |
Primary lining | – | – | 1.5 | 15.0 | – |
Secondary lining | – | – | 1.5 | 15.0 | – |
Table 3Parameters of the train track
Structure name | (MPa) | (kN/m3) | Tensile stress (MPa) | Compressive stress (MPa) | |
Filling of tunnel bottom | 2.8×10⁴ | 0.2 | 23 | 1.3 | 12.5 |
Track plate | 3.3×10⁴ | 0.2 | 27 | 1.9 | 21.5 |
4.3. Cross section shapes
The different cross-sectional shapes of loess tunnels are shown in Fig. 4.
Fig. 4The shapes of loess tunnels

a) Circular
b)Curved

c) Rectangular

d) Straight-walled arch
5. Dynamic response
5.1. Loess tunnel with a circular cross section
5.1.1. Acceleration
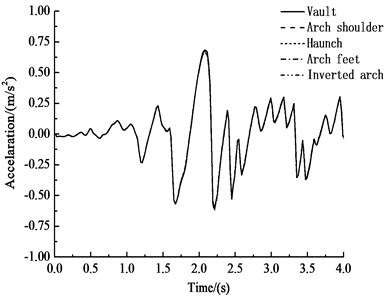
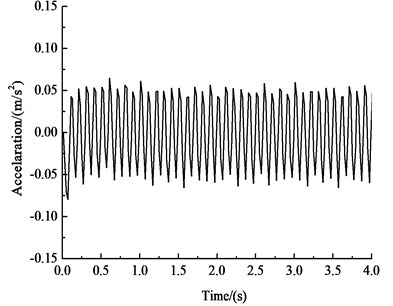
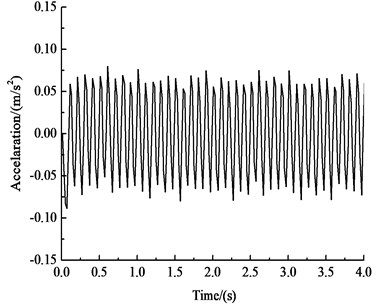
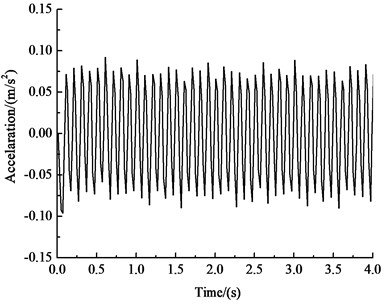
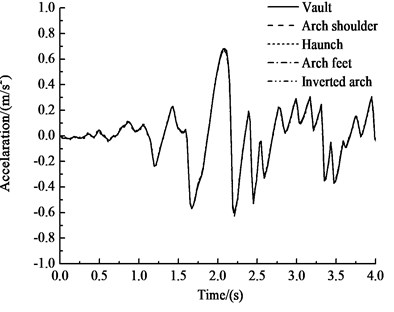
Upon inputting the seismic wave, the acceleration peaks at 2.12 s. The seismic response of the tunnel structure should be the most obvious at this moment. Therefore, the results of the acceleration calculation at 2.12 s are extracted and analyzed. However, a reflected wave will be generated when the incident seismic wave propagates into the free surface shown in the model. The acceleration-time history curves of key points are shown in Fig. 5 and Table 4.
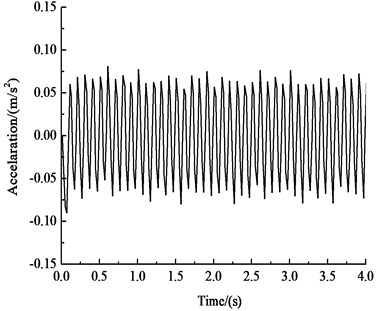
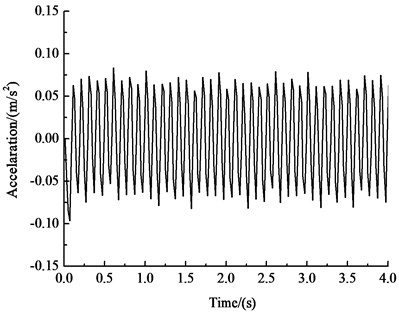
Fig. 5Acceleration-time history curves of key points
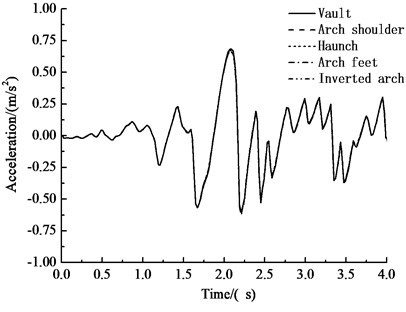
a) Horizontal acceleration-time history curve of key points
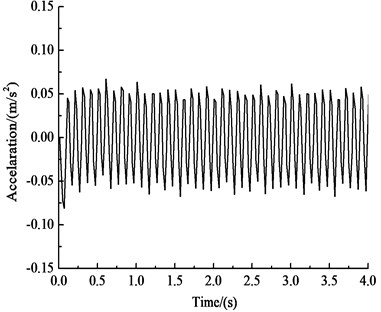
b) Vertical acceleration-time history curve of the vault
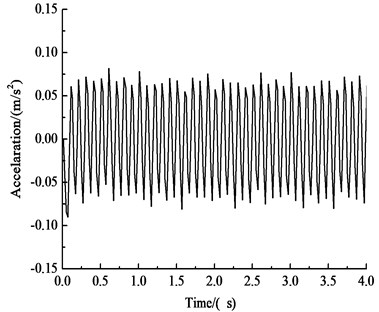
c) Vertical acceleration-time history curve of the arch shoulder
d) Vertical acceleration-time history curve of the haunch
e) Vertical acceleration-time history curve of the arch feet
f) Vertical acceleration-time history curve of the inverted arch
Table 4Peak accelerations of key points (m·s-2)
Position | Vault | Arch shoulder | Haunch | Arch feet | Inverted arch |
Horizontal acceleration | 0.683 | 0.689 | 0.690 | 0.672 | 0.664 |
Vertical acceleration | 0.080 | 0.090 | 0.098 | 0.112 | 0.126 |
Fig. 5 and Table 4 show that under the influences of an earthquake, rain seepage and train loading, the acceleration response of the circular tunnel structure is dominated by horizontal acceleration, while vertical acceleration has little effect. The acceleration of the tunnel cross section is approximately 0.650 m·s-2, and the peak acceleration is approximately 0.709 m·s-2 at approximately 15 m above the vault. The patterns of horizontal acceleration of the key points of the circular tunnel structure are basically the same, and these patterns are very similar to the input ground motion, indicating that the selected seismic wave type has a large influence on the horizontal acceleration of the tunnel. The peak value of the horizontal acceleration of the haunch is 0.690 m·s-2, and the peak value of the horizontal acceleration of the inverted arch is 0.664 m·s-2, which is 3.4 % less than the peak value of the horizontal acceleration of the arch shoulder. The vertical acceleration of the key points of the circular tunnel structure gradually increases from the vault to the inverted arch because the position of the inverted arch is directly affected by the train load. The vertical acceleration of the vault is 0.080 m·s-2, and the vertical acceleration of the inverted arch is 0.126 m·s-2, which is 57 % larger than the vertical acceleration of the vault.
5.1.2. Displacement
Fig. 6 shows the horizontal and vertical displacement-time history curves of the key points of the circular tunnel under the effects of an earthquake, seepage and train loading. Table 5 lists the peak displacement values of key points.
Table 5Peak displacements of key points (mm)
Position | Vault | Arch shoulder | Haunch | Arch feet | Inverted arch |
Horizontal positive peak | 9.01 | 9.09 | 9.12 | 8.93 | 8.89 |
Horizontal negative peak | 10.41 | 10.34 | 10.05 | 10.02 | 10.09 |
Vertical peak | 2.14 | 2.20 | 2.27 | 2.38 | 2.50 |
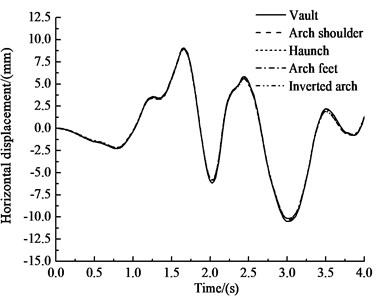
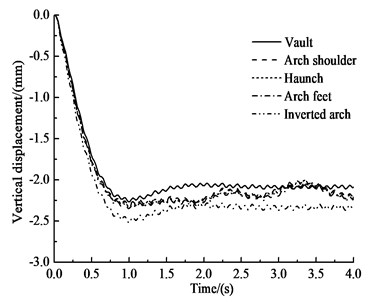
Fig. 6 and Table 5 show that under the effects of an earthquake, seepage, and train loading, the horizontal displacement-time histories of each key point of the circular tunnel structure are very similar. The horizontal displacement of the haunch is the greatest, at 9.12 mm. The horizontal displacement of the inverted arch is the smallest, at 8.89 mm, which is 2.5 % less than the horizontal displacement of the haunch. The horizontal negative peak displacement of the vault is the greatest, at 10.41 mm, and the negative displacement of the arch feet is the smallest, at 10.02 mm, which is 3.7 % less than the negative displacement of the vault. The patterns of the vertical displacement-time histories of the key points in the circular tunnel structure are basically the same. The vertical displacement of each key point increases almost linearly before 1 s, and then the vertical displacement of each key point oscillates after 1 s. The oscillation amplitudes of the arch shoulder, haunch and arch feet are slightly larger than those of the vault and the inverted arch. The vertical displacement gradually increases from the vault to the inverted arch. The peak vertical displacement of the vault is 2.14 mm, and the inverted arch vertical peak displacement is 2.50 mm, representing a peak displacement that is 16.8 % greater than that of the vault. According to comparing the displacements of the circular tunnel due to the earthquake, seepage, and train load, the seismic response clearly plays a dominant role in the displacement response of the tunnel, and horizontal displacement is the main displacement.
Fig. 6Displacement-time history curves of key points
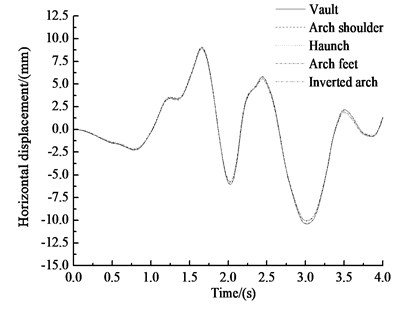
a) Horizontal displacement
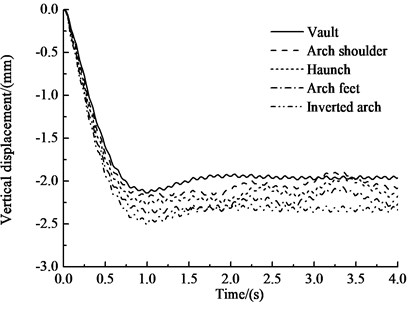
b) Vertical displacement
5.1.3. Stress
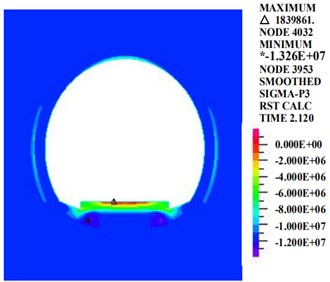
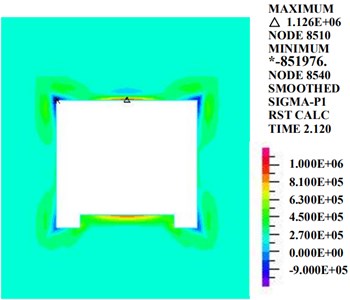
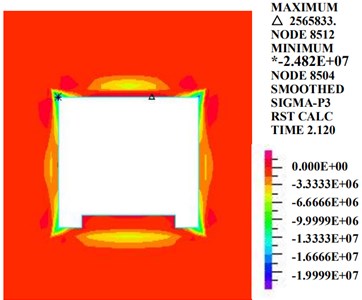
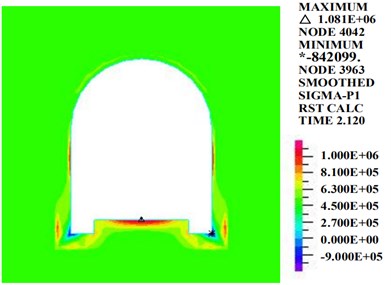
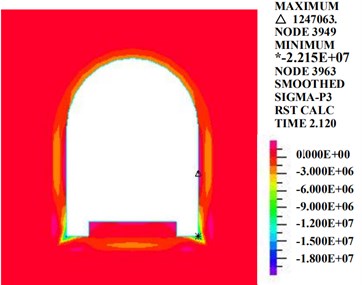
The first principle stress and the third principle stress diagrams of the circular tunnel structure under the influences of an earthquake, rain seepage and train loading at 2.12 s are shown in Fig. 7.
Fig. 7Diagrams of principle stresses (kPa)
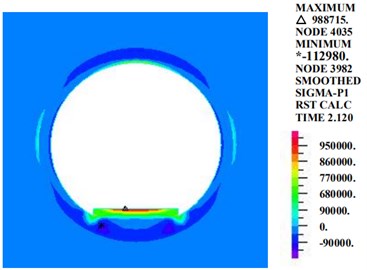
a) The first principle stress
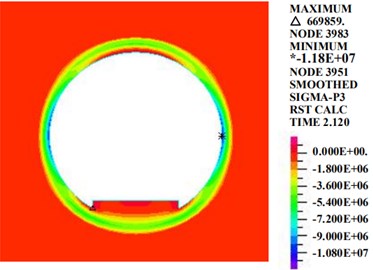
b) The third principle stress
Fig. 7 shows that at the moment of maximum acceleration, the maximum principle stress of the circular tunnel structure is 988 kPa at the inverted arch track plate. The third principle stress is distributed evenly along the tunnel section. The third principle stress at the haunch is larger, and the values at the vault and the inverted arch are smaller. The maximum value appears on the right side of the haunch, at 11,180 kPa.
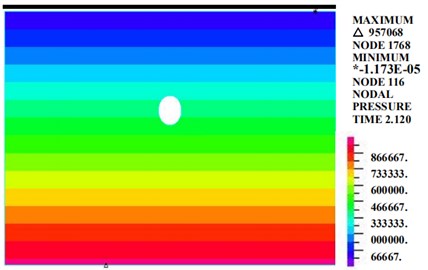
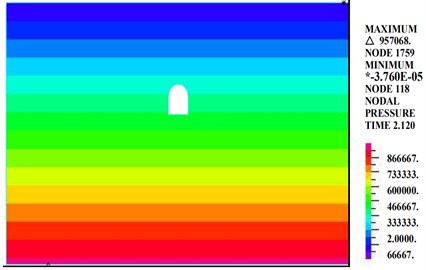
5.1.4. Pore water pressure
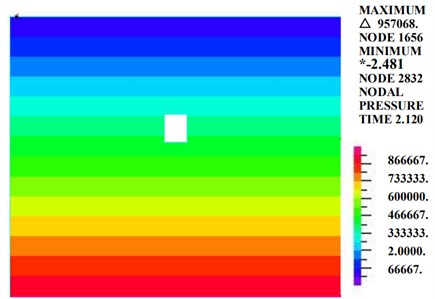
Fig. 8 is a diagram of the pore water pressure in the circular tunnel. Fig. 7 shows that under the condition of 100 mm of rainfall, the pore water pressure is distributed in layers and increases with depth. The pore water pressure range of the tunnel section is 0.3 MPa-0.6 MPa.
Fig. 8Diagram of the pore water pressure (kPa)
5.2. Loess tunnel with a curved cross section
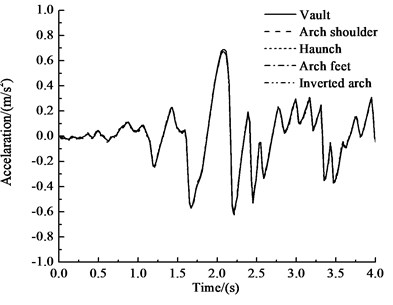
5.2.1. Acceleration
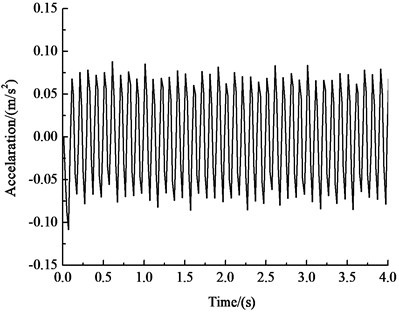
Fig. 9 shows the acceleration-time history curve at the critical points of the curved-wall tunnel under the influences of an earthquake, rain seepage and train loading at 2.12 s. Table 6 shows the acceleration peaks of the key points.
Table 6Peak accelerations of key points (m·s-2)
Position | Vault | Arch shoulder | Haunch | Arch feet | Inverted arch |
Horizontal acceleration | 0.684 | 0.690 | 0.694 | 0.674 | 0.667 |
Vertical acceleration | 0.080 | 0.089 | 0.096 | 0.115 | 0.131 |
Fig. 9 and Table 6 show that under the influences of an earthquake, rain seepage, and train loading, the acceleration response of the curved tunnel structure is similar to the acceleration response of the circular tunnel at 2.12 s. The variation trend of the horizontal acceleration of each key point of the curved tunnel structure is very similar to the input earthquake motion. The peak value of horizontal acceleration of the arch is 0.694 m·s-2, and the peak value of horizontal acceleration of the inverted arch is 0.667 m·s-2, which is 3.9 % less than the horizontal acceleration of the haunch. The vertical acceleration of key points in the curved-wall tunnel structure decreases with an increase in the distance of the vibration load and gradually decreases from the inverted arch to the vault. The vertical acceleration of the arch vault is 0.080 m·s-2, and the vertical acceleration of the inverted arch is 0.131 m·s-2, which is 64 % greater than the vertical acceleration of the arch vault.
5.2.2. Displacement
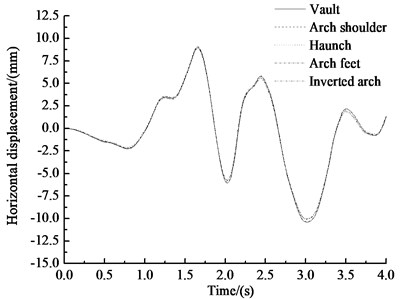
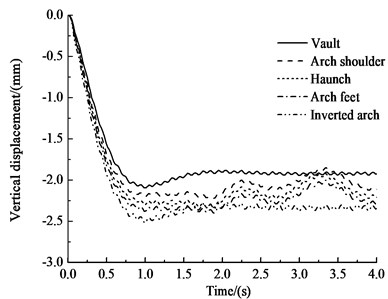
Fig. 10 shows the horizontal and vertical displacement-time history curves of key points of the circular tunnel structure under the influences of an earthquake, rain seepage, and train loading. Table 7 shows the peak displacements of the key points.
Fig. 9Acceleration-time history curves of key points
a) Horizontal acceleration-time history curve of key points
b) Vertical acceleration-time history curve of the vault
c) Vertical acceleration-time history curve of the arch shoulder
d) Vertical acceleration-time history curve of the haunch
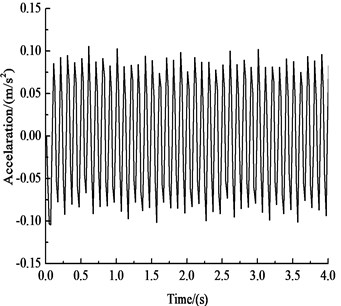
e) Vertical acceleration-time history curve of the arch feet
f) Vertical acceleration-time history curve of the inverted arch
Table 7Peak displacements of key points (mm)
Position | Vault | Arch shoulder | Haunch | Arch feet | Inverted arch |
Horizontal positive peak | 9.01 | 9.09 | 9.12 | 8.94 | 8.90 |
Horizontal negative peak | 10.42 | 10.35 | 10.11 | 10.07 | 10.13 |
Vertical peak | 2.14 | 2.19 | 2.28 | 2.36 | 2.51 |
Fig. 10 and Table 7 show that under the influences of an earthquake, rain seepage, and train loading, the horizontal displacement-time histories of the key points of the circular tunnel structure are very similar. The horizontal displacement of the haunch is the greatest, at 9.12 mm. The horizontal displacement of the inverted arch is the smallest, at 8.90 mm, which is 2.4 % less than the horizontal displacement of the haunch. The horizontal negative peak displacement of the vault is the greatest, at 10.41 mm, and the negative peak displacement of the arch feet is the smallest, at 10.07 mm, which is 3.3 % less than the negative peak displacement of the vault. The change trends of the vertical displacement-time histories of the key points in the circular tunnel structure are basically the same. The vertical displacement increases almost linearly before 1 s, then it oscillates after 1 s, and the oscillation amplitudes of the arch shoulder, haunch or arch feet are slightly larger than the oscillation amplitude of the vault or the inverted arch. The vertical displacement gradually increases from the vault to the inverted arch. The vertical peak displacement of the vault is 2.14 mm, and the vertical peak displacement of the inverted arch is 2.51 mm, representing an increase of 17.3 % over that of the vault.
Fig. 10Displacement-time history curves of key points
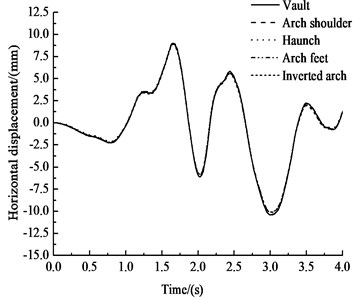
a) Horizontal displacement
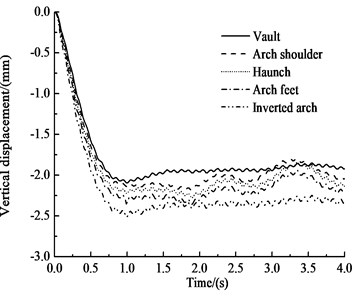
b) Vertical displacement
5.2.3. Stress
The first principle stress and the third principle stress diagrams of the circular tunnel structure under the influences of an earthquake, rain seepage, and train loading at 2.12 s are shown in Fig. 11.
Fig. 11Diagrams of principle stresses (kPa)
a) The first principle stress
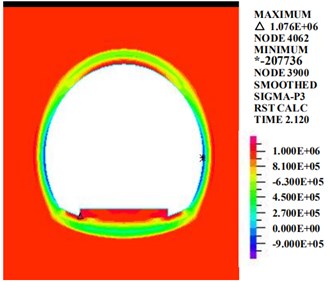
b) The third principle stress
Fig. 11 shows that at the moment of the maximum acceleration, the distributions of the first and third principle stresses of the curved tunnel are similar to the distributions of the circular tunnel. The first principle stress appears mainly at the vault, and the maximum value is 1076 kPa at the inverted arch track plate. The third principle stress is distributed evenly along the tunnel section. The third principle stress at the haunch is larger, and the values at the vault and the inverted arch are smaller. The maximum value, 13,260 kPa, appears on the right side of the haunch.
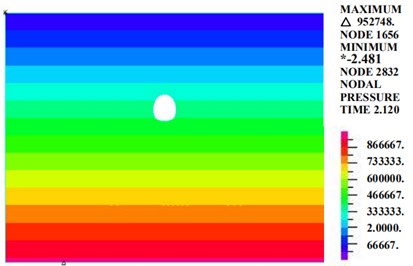
5.2.4. Pore water pressure
Fig. 12 is a diagram of the pore water pressure of the circular tunnel structure. Fig. 11 shows that under the condition of 100 mm of rainfall, the pore water pressure is distributed in layers and increases with depth. The pore water pressure of the tunnel section ranges from 0.3 MPa-0.6 MPa.
Fig. 12Diagram of the pore water pressure (kPa)
5.3. Loess tunnel with a rectangular cross section
5.3.1. Acceleration
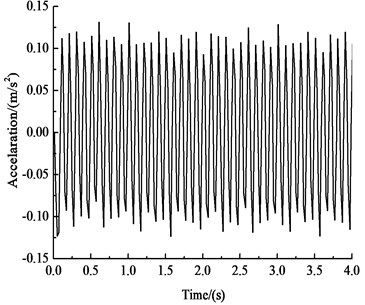
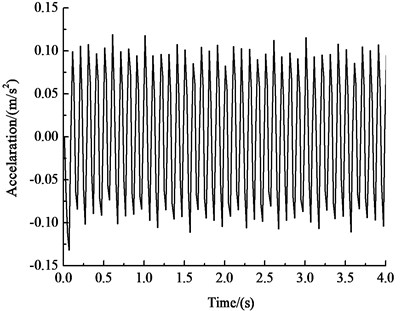
Fig. 13 shows the acceleration-time history curves for critical points in the rectangular tunnel structure under the influences of an earthquake, rain seepage, and train loading at 2.12 s. Table 8 shows the peak accelerations of these key points.
Table 8Peak accelerations of key points (m·s-2)
Position | Vault | Arch shoulder | Haunch | Arch feet | Inverted arch |
Horizontal acceleration | 0.688 | 0.692 | 0.696 | 0.680 | 0.669 |
Vertical acceleration | 0.090 | 0.097 | 0.099 | 0.111 | 0.135 |
Fig. 13 and Table 8 show that under the influences of an earthquake, seepage and train loading, the acceleration response of the rectangular tunnel structure is dominated by horizontal acceleration. The acceleration of the tunnel cross section is approximately 0.650 m·s-2, and the peak acceleration is approximately 0.709 m·s-2 at approximately 15 m above the vault. The patterns of horizontal acceleration of the key points are basically the same as those in the circular and curved tunnels and are very similar to the input ground motion. The peak value of horizontal acceleration of the haunch is the greatest, at 0.690 m·s-2, and the peak value of horizontal acceleration of the vault is the smallest, at 0.669 m·s-2, which is 3.9 % less than that of the haunch. The vertical acceleration of the key points gradually increases from the vault to the inverted arch. The vertical acceleration of the vault is 0.090 m·s-2, and the vertical acceleration of the inverted arch is 0.135 m·s-2, which is 50 % greater than that of the vault.
5.3.2. Displacement
Fig. 14 shows the horizontal and vertical displacement-time history curves of key points of the rectangular tunnel structure under the influences of an earthquake, rain seepage, and train loading. Table 9 shows the peak displacements of the key points.
Fig. 13Acceleration-time history curves of key points
a) Horizontal acceleration-time history curve of key points
b) Vertical acceleration-time history curve of the vault
c) Vertical acceleration-time history curve of the arch shoulder
d) Vertical acceleration-time history curve of the haunch

e) Vertical acceleration-time history curve of the arch feet
f) Vertical acceleration-time history curve of the inverted arch
Table 9Peak displacements of key points (mm)
Position | Vault | Arch shoulder | Haunch | Arch feet | Inverted arch |
Horizontal positive peak | 9.05 | 9.14 | 9.08 | 8.94 | 8.93 |
Horizontal negative peak | 10.50 | 10.32 | 10.16 | 10.17 | 10.17 |
Vertical peak | 2.26 | 2.31 | 2.33 | 2.35 | 2.52 |
Fig. 14 and Table 9 show that under the influences of an earthquake, rain seepage, and train loading, the horizontal displacement-time history of each key point of the rectangular tunnel structure is similar to those of the circular and curved-wall tunnels. The horizontal displacement of the arch shoulder is the greatest, at 9.14 mm. The horizontal displacement of the inverted arch is the smallest, at 8.93 mm, which is 2.3 % less than that of the haunch. The horizontal negative peak displacement of the vault is the greatest, at 10.50 mm, and the negative peak displacement of the arch feet is the smallest, at 10.16 mm, which is 3.2 % less than that of the vault. The patterns of the vertical displacement-time histories of the key points are basically the same. The vertical displacement increases almost linearly before 1 s, then it oscillates after 1 s, and the oscillation amplitudes of the arch shoulder, the haunch and the arch feet are slightly larger than those of the vault and the inverted arch. The vertical displacement gradually increases from the vault to the inverted arch. The vertical peak displacement of the vault is 2.26 mm, and the vertical peak displacement of the inverted arch is 2.52 mm, i.e., 11.5 % higher than that of the vault.
Fig. 14Displacement-time history curves of key points
a) Horizontal displacement
b) Vertical displacement
5.3.3. Stress
The first principle stress and the third principle stress diagrams of the circular tunnel structure under the influences of earthquake, rain seepage, and train loading at 2.12 s are shown in Fig. 15.
Fig. 15Diagrams of principle stresses
a) The first principle stress
b) The third principle stress
Fig. 15 shows that at the moment of the maximum acceleration, the first principle stress and the third principle stress of the rectangular tunnel are distributed mainly at the vault, the inverted arch and the four corners of the cross section. The first principle stress appears at the vault, and the maximum value is 1126 kPa. The third principle stress is distributed at the four corners of the tunnel. The maximum value, 24,820 kPa, corresponds to the third principle stress on the left side of the arch shoulder.
5.3.4. Pore water pressure
Fig. 16 is a diagram of the pore water pressure of the rectangular tunnel. Fig. 15 shows that under the condition of 100 mm of rainfall, the pore water distribution of the rectangular tunnel is basically the same as those of the circular and the curved-wall tunnels. The pore water pressure is distributed in layers and increases with depth. The pore water pressure of the tunnel ranges from 0.3 MPa-0.6 MPa.
Fig. 16Diagram of the pore water pressure
5.4. Loess tunnel with a straight-walled arch cross section
5.4.1. Acceleration
Fig. 17 shows the acceleration-time history curves at critical points in the straight-walled arch tunnel under the influences of an earthquake, rain seepage, and train loading at 2.12 s. Table 10 shows the peak accelerations of these key points.
Table 10Peak accelerations of key points (m·s-2)
Position | Vault | Arch shoulder | Haunch | Arch feet | Inverted arch |
Horizontal acceleration | 0.686 | 0.692 | 0.694 | 0.676 | 0.666 |
Vertical acceleration | 0.078 | 0.090 | 0.096 | 0.108 | 0.131 |
Fig. 17 and Table 10 show that under the influences of an earthquake, rain seepage, and train loading, the acceleration response of the straight-walled arch tunnel structure is dominated by horizontal acceleration. The peak acceleration is approximately 0.709 m·s-2 at approximately 15 m above the vault. The patterns of the horizontal acceleration of the key points are very similar to the input earthquake wave. The peak value of the horizontal acceleration of the haunch is the greatest, at 0.694 m·s-2, and the peak value of the horizontal acceleration of the vault is the smallest, at 0.666 m·s-2, which is 4.0 % less than that of the haunch. The vertical acceleration of the key points of the straight-walled arch tunnel decreases with increasing distance from the vibration load. The vertical acceleration of the vault is 0.078 m·s-2, and the vertical acceleration of the inverted arch is 0.131 m·s-2, which is 68 % greater than that of the vault.
The acceleration response of the tunnel structure is mainly horizontal acceleration, and the change trend of the horizontal acceleration at each key point of the structure is basically the same and has a high similarity with the input seismic wave, which shows that the selected seismic wave type has a greater impact on the horizontal acceleration of the tunnel.
Fig. 17Acceleration-time history curves of key points
a) Horizontal acceleration-time history curve of key points

b) Vertical acceleration-time history curve of the vault
c) Vertical acceleration-time history curve of the arch shoulder
d) Vertical acceleration-time history curve of the haunch
e) Vertical acceleration-time history curve of the arch feet
f) Vertical acceleration-time history curve of the inverted arch
5.4.2. Displacement
Fig. 18 shows the horizontal and vertical displacement-time history curves of the key points of the straight-walled arch tunnel under the influences of an earthquake, rain seepage, and train loading. Table 11 shows the peak displacements of the key points.
Fig. 18 and Table 11 show that under the influences of an earthquake, rain seepage, and train loading, the horizontal displacement-time history of each key point of the rectangular tunnel structure is basically the same. The horizontal peak displacement of the arch shoulder is the greatest, at 9.15 mm. The horizontal peak displacement of the inverted arch is the smallest, at 8.89 mm, which is 2.8 % less than that of the haunch. The horizontal negative peak displacement of the vault is the greatest, at 10.42 mm, and the negative peak displacement of the arch feet is the smallest, at 10.09 mm, which is 3.2 % less than that of the vault. The change trends in the vertical displacement-time history curves of the key points are basically the same. The vertical displacement is the most obvious before 1 s and increases almost linearly, which shows the obvious shock response characteristics under the train load. Then, the vertical displacement oscillates after 1 s, and the oscillation amplitudes of the arch shoulder, haunch and arch feet are slightly larger than the those of the vault and the inverted arch. The vertical displacement gradually increases from the vault to the inverted arch. The vertical peak displacement of the vault is 2.09 mm, and the vertical peak displacement of the inverted arch is 2.51 mm, representing an increase of 20.1 % over that of the vault.
Fig. 18Displacement-time history curves of key points
a) Horizontal displacement
b) Vertical displacement
Table 11Peak displacements of key points (mm)
Position | Vault | Arch shoulder | Haunch | Arch feet | Inverted arch |
Horizontal positive peak | 9.02 | 9.08 | 9.15 | 8.90 | 8.89 |
Horizontal negative peak | 10.42 | 10.37 | 10.10 | 10.09 | 10.12 |
Vertical peak | 2.09 | 2.20 | 2.30 | 2.38 | 2.51 |
5.4.3. Stress
The first principle stress and the third principle stress diagrams of the circular tunnel structure under the influences of an earthquake, rain seepage, and train loading at 2.12 s are shown in Fig. 19.
Fig. 19 shows that at the moment of the maximum acceleration, the straight-walled arch tunnel shows obvious stress concentration phenomena. The first principle stress appears mainly at the track plate of the inverted arch and at the arch feet of the tunnel bottom. The third principle stress appears mainly at the arch feet. At the time of 2.12 s, the greatest first principle stress, 1081 kPa, appears at the center of the inverted arch track plate, and the greatest third principle stress, 22,150 kPa, appears at the right arch foot.
5.4.4. Pore water pressure
Fig. 20 shows the diagram of the pore water pressure of the straight-walled arch tunnel. Fig. 19 shows that under the condition of 100 mm of rainfall, the pore water pressure is distributed in layers and increases with depth. The pore water pressure of the tunnel section ranges from 0.3 MPa-0.6 MPa.
Fig. 19Diagrams of principle stresses
a) The first principle stress
b) The third principle stress
Fig. 20Diagram of the pore water pressure
6. Shaking-table test
6.1. Test survey
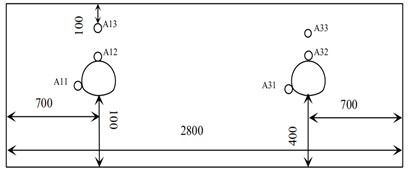
6.1.1. Layout of the measuring surface
A large-scale shaking-table test with a geometric similarity ratio of 1/40 [34] is carried out, and the similar parameters are shown in Table 12. The size of the model test box is 2.8 m×1.4 m×1.0 m. In this test, two measuring surfaces are respectively arranged on the model box, at the 1/2 (0.70 m away from the box wall) and 1/4 (0.35 m away from the box wall) positions. The tunnel layout section is shown in Fig. 20. Three acceleration sensors are set on each measuring surface, respectively, on the lining arch foot, arch crown and soil surface, two earth pressure box sensors are set on each measuring surface, respectively, on the lining arch foot and arch crown. The tunnel model is shown in Fig. 21-22.
6.1.2. Simulation materials
The target values of physical parameters of model soil material are shown in Table 13. The screened loess is used to control the cohesion and internal friction angle of the material by controlling the density and water content of the model soil to produce similar physical properties to those of the material. First, the undisturbed loess is crushed, with the moisture content of 13 %, and the density, internal friction angle, and cohesion are made consistent with the target values. Gypsum is selected as a similar material for the tunnel model lining, and finished steel wire mesh is used to simulate the reinforcement in the concrete. In the experiment, a 1.3 water/paste ratio is selected as the similar material for the lining structure, and appropriate amounts of quartz sand and barite are added as weight-increasing materials. The detailed ratio is shown in Table 14.
Table 12Similarity relation
Physical quantity | Sign or relation | similarity coefficient | Physical quantity | Sign or relation | Similarity coefficient |
length | 1/40 | Internal friction angle | Dimensionless | 1/1 | |
Mass density | 1/1 | Strain | 1/2 | ||
Modulus of elasticity | 1/20 | Displacement | 1/80 | ||
Time | 1/6.325 | Speed | 1/6.324 | ||
Poisson’s ratio | Dimensionless | 1/1 | Acceleration | 1/1 | |
Stress | 1/40 | Force | 1/64000 | ||
Cohesive force | 1/40 | Frequency | 1/0.158 | ||
Viscosity coefficient | 1/126.5 | Damping coefficient | 1/10120 |
Fig. 21Layout diagram (mm)
a) The cross section
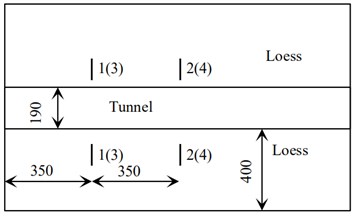
b) The longitudinal section
Fig. 22The model of the tunnel
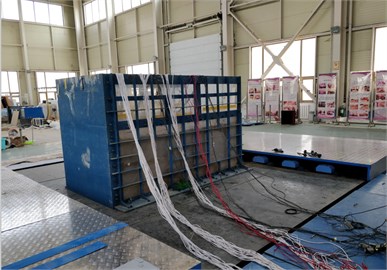
a) The test box
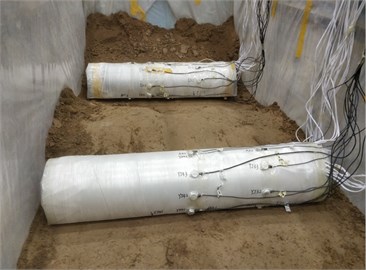
b) The layout of model
Table 13Soil parameters and target simulation values
Physical quantity | Similarity index | Similarity constant | Value of prototype soil measured | Value of model soil target |
Elastic modulus (MPa) | 1/20 | 36 | 8.424 | |
Cohesion (kPa) | 1/40 | 50 | 11.71 | |
Bulk density (KN/m2) | 1 | 12.7 | 12.7 | |
Internal friction angle ( | 1 | 1 | 29.8° | 29.8° |
Table 14Mix proportion of the lining structure
Material | Quartz sand | Barite | Water | Gypsum |
Proportion (%) | 31.17 | 20.85 | 27.13 | 20.85 |
6.1.3. Seismic wave
The laboratory can simulate the dynamic response of the loess tunnel to rainfall before the earthquake through the use of artificial rainfall. With reference to the rainfall in the loess area, the total designed rainfall is 50 mm (0.196 m2), and the rainfall intensity is 10 mm/h. After the rainfall is completed, the tunnel model is allowed to stand for half an hour, and then the shaking-table test is carried out. To determine the dynamic characteristics of the structure, a low-amplitude sine wave excitation was input at the beginning of the test to observe the dynamic characteristics and the damage degree of the model. In the test, the El Centro wave is selected as the one-way (-direction) loaded seismic wave, and the time history of the wave is compressed during the test. According to the requirements of the test conditions, the PGA of the seismic waves is amplitude-modulated, and the El Centro waves are loaded with the peak values of 0.2 g, 0.4 g, 0.6 g and 0.8 g acceleration, respectively.
6.2. Analysis of the test results
6.2.1. Acceleration
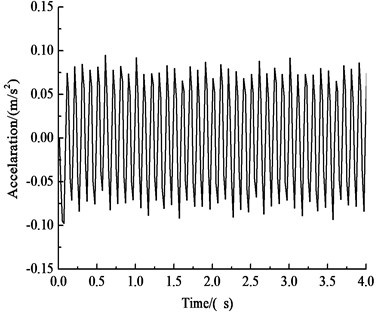
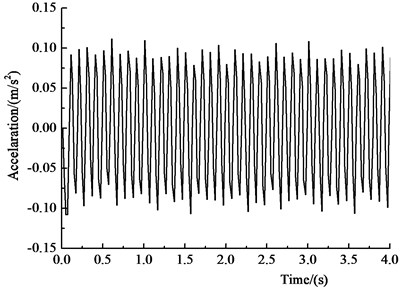
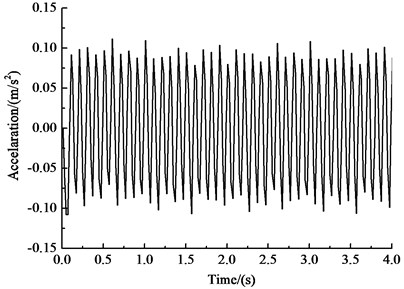
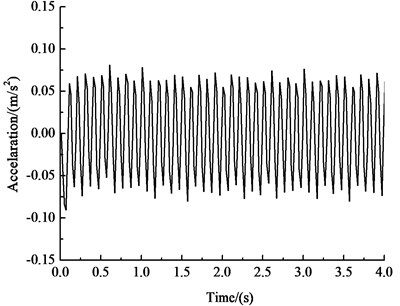
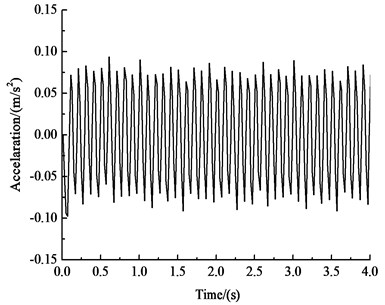
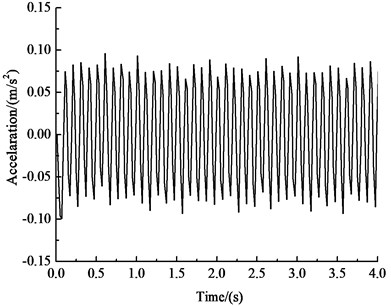
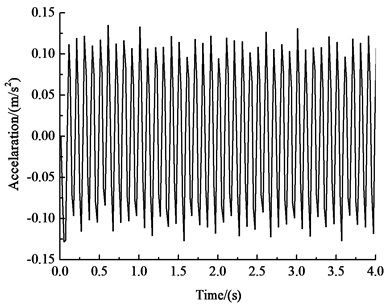
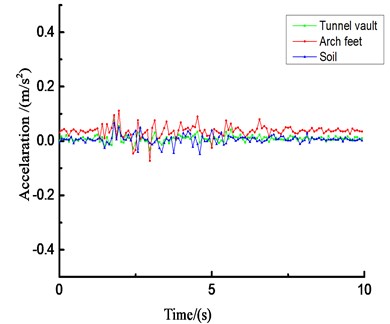
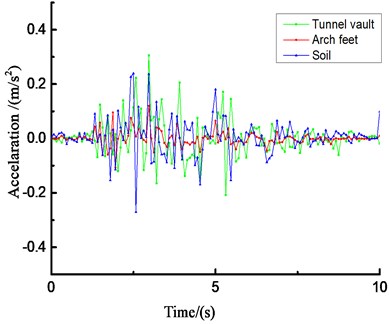
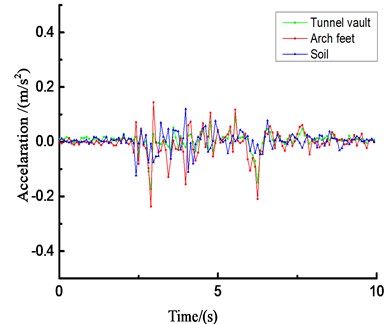
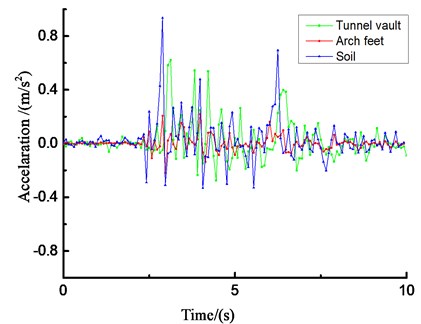
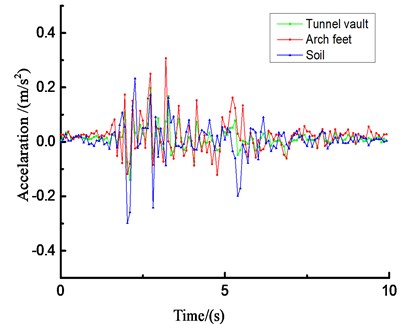
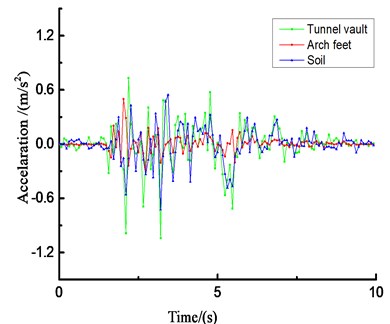
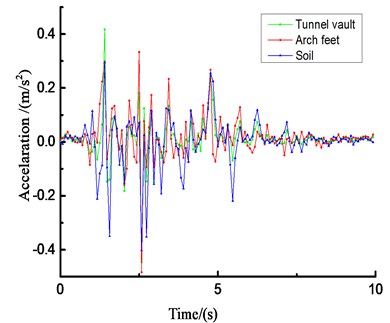
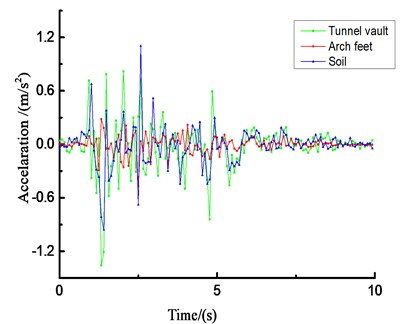
Due to space limitations, Fig. 23 only lists the acceleration results of the loess tunnel structure under unidirectional (-direction) loading of El Centro waves under different amplitude conditions.
The acceleration responses of the loess tunnel are very similar and are closely related to the input ground motion. The loess tunnel structure will produce an acceleration amplification effect under dynamic seismic action. The change rules of the peak acceleration obtained from the shaking-table test and numerical simulation are similar, but the values are quite different. Due to the differences between the surrounding rock and tunnel in the shaking-table test and numerical simulation, the compactness values of the contact surface and surrounding rock are also different. Regardless of the direction of the seismic wave, there will be longitudinal and transverse seismic waves, but the amplification effect of the vertical seismic wave is stronger than that of the horizontal seismic wave, so the vertical seismic wave cannot be ignored in the seismic design of tunnels. Most of the peak acceleration occurs at the arch crown and arch foot of the tunnel structure.
Fig. 23The whole-process comparison of the acceleration curves
a) Time history curve of horizontal acceleration (0.2 g)
b) Time history curve of vertical acceleration (0.2 g)
c) Time history curve of horizontal acceleration (0.4 g)
d) Time history curve of vertical acceleration (0.4 g)
e) Time history curve of horizontal acceleration (0.6 g)
f) Time history curve of vertical acceleration (0.6 g)
g) Time history curve of horizontal acceleration (0.8 g)
h) Time history curve of vertical acceleration (0.8 g)
6.2.2. Stress
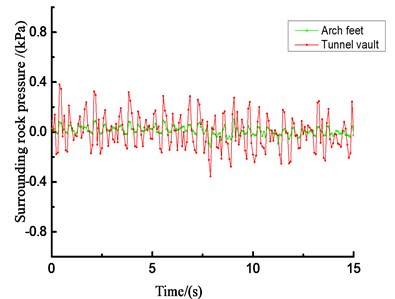
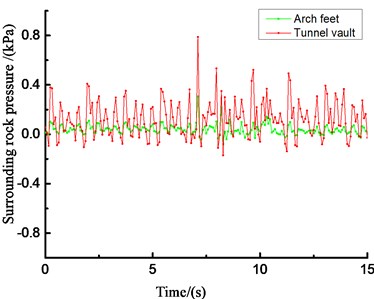
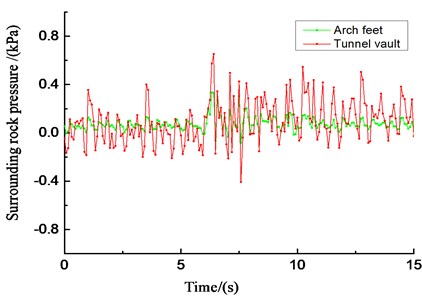
Due to space limitations, Fig. 24 only lists the earth pressure results of the loess tunnel structure under the unidirectional (-direction) loading of El Centro waves with different amplitudes.
Under the action of seismic waves, the peak change trends of the surrounding rock pressure at each of the measuring points are similar. The peak value of surrounding rock pressure increases with the increase of the input acceleration peak value, but the increase is not obvious. The peak value of the earth pressure at the arch crown is larger than that at the arch foot. Therefore, in the aseismic design of tunnels, tunnel vaults should be considered.
Fig. 24The whole-process comparison of the stress curves
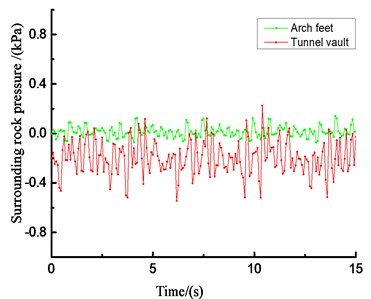
a) Time history curve of the tunnel lining stress (0.2 g)
b) Time history curve of vertical acceleration (0.4 g)
c) Time history curve of the tunnel lining stress (0.6 g)
d) Time history curve of vertical acceleration (0.8 g)
7. Conclusions
1) The acceleration responses of loess tunnels with four different cross sections are very similar and are closely related to the input ground motion. The horizontal peak acceleration of the tunnels occurs at the haunch. The horizontal acceleration at the haunch is smallest in the circular tunnel and greatest in the rectangular tunnel. The vertical acceleration of the key points in the tunnels increases from the vault to the inverted arch. The vertical peak acceleration is smallest in the circular arch and greatest in the rectangular arch.
2) The displacement-time history trends of key points of the four sections of loess tunnels are basically the same. The acceleration peaks are concentrated at approximately 3.01 s, which shows the hysteresis of the displacement response. The horizontal peak displacement of the tunnel structure occurs at the vault and is smallest in the circular tunnel and greatest in the rectangular tunnel. The vertical displacement of the tunnel section gradually decreases from the inverted arch to the vault. The vertical displacement peak is smallest in the circular arch and greatest in the rectangular arch.
3) The stress distributions vary considerably among the loess tunnels with different cross sections. The greatest value of the first principle stress in the loess tunnels appears in the inverted arch. In the circular and the curved-wall tunnels, the third principle stress is distributed mainly on both sides of the haunch. In the rectangular and straight-walled arch tunnels, the third principle stress is concentrated in certain areas. In the rectangular tunnel, the stress is concentrated at the four corners, and in the straight-walled arch tunnel, it is concentrated on the two arch feet. Under the influences of an earthquake, seepage and train loading, the shape of the cross section has a considerable effect on the stress response. The stress response is smallest in the circular cross section and largest in the rectangular cross section.
4) The pore water pressure of the four loess tunnels increases with depth. The numerical difference is small, and the influence of the cross section on the tunnel pore water pressure is small.
5) The dynamic response determined in the shaking-table test of the loess tunnel surrounding rock structure is consistent with that of the numerical simulation. The laws of acceleration and earth pressure are similar. The vertical amplification effect on the acceleration is obviously stronger than the horizontal amplification effect. The peak value mainly occurs at the arch crown and arch foot of the tunnel structure, and the peak value of the earth pressure at the arch crown is greater than that at the arch foot.
References
-
Anastasopoulos I., Gerolymos N., Drosos V., et al. Nonlinear response of deep immersed tunnel to strong seismic shaking. Journal of Geotechnical and Geoenvironmental Engineering, Vol. 133, Issue 9, 2007, p. 1067-1090.
-
Zheng Y. R., Qiu C. Y., Zhang H., et al. Exploration of stability analysis methods for surrounding rocks of soil tunnel. Chinese Journal of Rock Mechanics and Engineering, Vol. 27, Issue 10, 2008, p. 1968-1980.
-
Zheng Y. R., Ye H. L., Xiao Q., et al. Stability analysis of the side slope and tunnel under seismic action based on the dynamic analysis method. Journal of Disaster Prevention and Mitigation Engineering, Vol. 30, Issue 1, 2010, p. 279-285.
-
Xiao Q., Zheng Y., Ye H. L. Stability analysis of static unlined loess tunnel. Chinese Journal of Underground Space and Engineering, Vol. 6, Issue 6, 2010, p. 1136-1141.
-
Cheng X. S., Zheng Y. R. Calculation discussion about safety factor of unlined loess tunnel wall rock structure under earthquake. Rock and Soil Mechanics, Vol. 32, Issue 3, 2011, p. 761-766.
-
Cheng X. S., Zheng Y. R., Tian R. R. Dynamic finite element strength reduction method of earthquake stability analysis of surrounding rock of tunnel. Rock and Soil Mechanics, Vol. 32, Issue 4, 2011, p. 1241-1248.
-
Cheng X. S., Tian R. R., Zheng Y. R. Earthquake stability analysis of wall rock of vertical ridge loess tunnel: the impact of stress concentration at tunnel feet on safety factor. Journal of Vibration and Shock, Vol. 30, Issue 11, 2011, p. 214-218.
-
Cilingir U., Madabhushi S. P. G. A model study on the effects of input motion on the seismic behaviour of tunnels. Soil Dynamics & Earthquake Engineering, Vol. 31, Issue 3, 2011, p. 452-462.
-
Abdoun T. H., Da H., O’rourke M. J., et al. Factors influencing the behavior of buried pipelines subjected to earthquake faulting. Soil Dynamics and Earthquake Engineering, Vol. 29, Issue 3, 2009, p. 415-427.
-
Liu C. J. Numerical simulation analysis of earthquake stability about the Niutoushan loess railway tunnel. Chinese Journal of Underground Space and Engineering, Vol. 9, Issue 3, 2013, p. 547-551.
-
Jiang S. P., Fang L., Lin Z. Seismic response analysis of mountain tunnels in different depths. Rock and Soil Mechanics, Vol. 35, Issue 1, 2014, p. 211-216.
-
Yang Z. H., Lan H. X., Zhang Y. S., et al. Rock dynamic response of railway tunnel traversing through fault under strong earthquake. Journal of Engineering Geology, Vol. 21, Issue 2, 2013, p. 171-181.
-
Zhang J. H., Yang X. L., Zhang B. Upper bound quasi-static analysis of dynamic stability on shallow tunnel under earthquake action. Journal of Central South University (Science and Technology), Vol. 46, Issue 4, 2015, p. 238-247.
-
Li X. B., Zhang W., Li D. Y., et al. Influence of underground water seepage flow on surrounding rock deformation of multi-arch tunnel. Journal of Central South University of Technology, Vol. 15, 2008, p. 69-74.
-
Jun S., Kazuhiro N., Kiyoshi K., et al. Numerical evaluation of the effect of permeability decrease on the undersea tunnel. Journal of Japan Society of Civil Engineers, Vol. 67, Issue 3, 2011, p. 125-132.
-
Farhadian H., Aalianvari A., Katibeh H. Optimization of analytical equations of groundwater seepage into tunnels: A case study of Amirkabir tunnel. Journal of the Geological Society of India, Vol. 80, 2012, p. 96-100.
-
Perazzelli P., Leone T., Anagnostou G. Tunnel face stability under seepage flow conditions. Tunnelling and Underground Space Technology, Vol. 43, 2014, p. 459-469.
-
Yang H. J., Wang M. S. Numerical simulation of seepage in deep-buried long and big tunnels. Chinese Journal of Rock Mechanics and Engineering, Vol. 25, Issue 3, 2006, p. 511-519.
-
Cheng J. Y., Li J. Coupled fluid-mechanical analysis of settlement and stability of subway tunnel. Journal of Disaster Prevention and Mitigation Engineering, Vol. 28, Issue 4, 2008, p. 441-446.
-
Wang Q., Shao S. J., Lu S., et al. Research on collapse deformation of loess tunnel excavated by pitting method. Chinese Journal of Underground Space and Engineering, Vol. 10, 2014, p. 1640-1645.
-
Degrande G., Clouteau D., Othman R., et al. A numerical model for ground-borne vibrations from underground railway traffic based on a periodic finite element-boundary element formulation. Journal of Sound and Vibration, Vol. 293, Issues 3-5, 2006, p. 645-666.
-
Pan C. S., Pande G. N. Preliminary deterministic finite element study on a tunnel driven in loess subjected to train loading. China Civil Engineering Journal, Vol. 4, Issue 1984, 1984, p. 19-28.
-
Zhang G. B. The Analysis of the Coupling Vibration of Vehicle and Tunnel. Ph.D. Thesis, Dalian Jiaotong University, Dalian, 2012.
-
Feldgun V. R., Kochetkov A. V., Karinski Y. S., et al. A coupled simulation of an explosion inside a lined cavity surrounded by a plastic compressible medium. International Journal for Numerical Methods in Engineering, Vol. 72, Issue 10, 2007, p. 1135-1156.
-
Li L., Zhang B. Q., Yang X. L. Analysis of dynamic response of large cross-section tunnel under vibrating load induced by high speed train. Chinese Journal of Rock Mechanics and Engineering, Vol. 24, Issue 23, 2005, p. 4259-4265.
-
Augarde C. E., Burd H. J. Three-dimensional finite element analysis of lined tunnels. International Journal for Numerical and Analytical Methods in Geomechanics, Vol. 25, Issue 3, 2001, p. 243-262.
-
Cheng X. S., Li X. L., Nie J., et al. Research on the dynamic parameters of loess. Geotechnical and Geological Engineering, Vol. 37, Issue 1, 2019, p. 77-93.
-
Zhai W. M. Vehicle Track Coupling Dynamics. China Railway Publishing House, Beijing, 1997.
-
Liang B., Luo H., Sun C. X. Simulated study on vibration load of high speed railway. Journal of the China Railway Society, Vol. 28, Issue 4, 2006, p. 89-94.
-
Huang J. Study on the Vibration Response and Fatigue Life of High-Speed Railway Tunnels Based on Damage Theory. Central South University, Changsha, 2009.
-
Gu Z. Q., Peng S. Z., Li Z. K. Underground Excavation Engineering. Tsinghua University Press, Beijing, 1994.
-
Deeks Randolph A. J. M. F. Axisymmetric time-domain transmitting boundaries. Journal of Engineering Mechanics, Vol. 120, Issue 1, 1994, p. 25-42.
-
Liu J., Yi H., Li J. Application of artificial boundary and seismic input in general finite element software. Chinese Journal of Underground Space and Engineering, Vol. 7, Issue 2, 2011, p. 1774-1779.
-
Meymand P. J. Shaking table scale model test of nonlinear soil-pile-super structure interaction in soft clay. University of California, Berkeley, 1998.
Cited by
About this article

This research is supported in part by the National Natural Science Foundation of China (Grant Nos. 51478212, 51968045).
