Abstract
With the development of urbanization, the construction of the subway has been greatly developed. Meanwhile, the public concern of terrorist attacks on subway stations keeps driving the related research. In this paper, the representative subway station of Wuhan Metro Line 8, Mafangshan station, which is now under construction, is taken as a case, the dynamic finite element numerical simulation software ANSYS/LS-DYNA is employed to establish finite element model. The propagation law transmitting through the station structure and the dynamic response of the station under different TNT charges are analyzed. It is indicated that the propagation of shock wave is complicated due to the semi-closed environment of the station as well as the reflection and transmission of the stress wave in the structure. Specifically, in the station structure, the displacement of the platform plate was the largest, under the explosive action of different TNT charge, the displacement of platform plate is 13.6 mm (5 kg), 22. 8mm (10 kg), 35.2 mm (20 kg), 45.6 cm (30 kg), 68.8 cm (40 kg), respectively. The middle part of the pillar was the largest displacement on the pillar. Based on the dynamic stress response analysis of the station pillar, it shows that the maximum value of the stress value in the pillar is located at the junction of the pillar and the plate. Under the explosive action of 40 kg TNT charge, the maximum tensile stress of the junction of the pillar and the plate reached 45.1 MPa. Therefore, more attention should be paid to anti-explosion measures herein. Besides, through the analysis of the tensile stress value at the bottom of the pillar under different charge quantity, the TNT charge quantity for the crack at the bottom of the pillar is determined to be 6.77 kg by the formula fitting.
Highlights
- Established a subway station numerical model through the dynamic finite element numerical simulation software, simulated the process of explosive exploding inside the station.
- Through the study of the propagation process of the shock wave, the propagation law of shock wave in a semi-closed underground station is a complex process.
- The dynamic response of the station structure is analyzed, especially the tensile stress on the pillar, and obtain the amount of explosive that cracked at the bottom of the pillar.
1. Introduction
As of December 2019, the number of cities in China that have opened subways has reached 44, of which 13 cities have an operating mileage of more than 100 km. The total mileage of metros built-in cities in China is nearly 4,600 kilometers. With the large-scale subway coming into service, it also brings new public safety problems. Due to the characteristics of large passenger flow and confined space, the internal explosion of subway stations often causes significant damage. There have been several terrorist bombings in subway stations around the world. Therefore, the analysis of the law of explosive shock wave and the dynamic response of the station structure has important guiding significance for the design of the safety protection of the subway station structure and the formulation of the contingency disposal plan of the explosion accident.
The shock wave generated by the explosion features nonlinearity highly, and the duration is concise, so it is difficult to observe and analyze the deformation and failure process of the structure under the explosion load through the experimental method [1]. In recent years, with the rapid development of computer technology, numerical analysis software, such as ANSYS/LS-DYNA, AUTODYN, and FLAC3D, which are specializing in solving nonlinear problems, have been widely used in explosion problems. A large number of scholars have studied explosion-related issues through numerical simulation to obtain the data of the shock wave generated by the explosion and its dynamic response to the structure. For example, Remennikov et al. used the three-dimensional numerical simulation software AUTODYNA to simulate the air explosion of explosives in T-shaped streets. Then analyzed the propagation and overpressure time-history relationship of the explosion shock wave in urban streets [2]. Bretislav et al. carried out field experiments and numerical simulations on confined explosions in ventilation tunnels [3]. Lannitti et al. used LS-DYNA to analyze the dynamic response of concrete slabs under the same explosive action with or without partitions and explained the impact of partitions on the anti-detonation performance of concrete slabs [4]. Some scholars have studied explosion related problems by combining numerical simulation with field experiments [5, 6].
Regarding the subway station, Yan established a finite element model to conduct the damage assessment of the pillars of the subway station under the explosion [7]. He et al. used LS-DYNA and ABAQUS to analyze the propagation law of explosion waves in subway stations and conducted dynamic analysis on subway stations. At the same time, the influence of soil hardness and buried depth on the dynamic response of the subway station was studied [8]. Qu et al. established numerical models with AUTODYNA and LS-DYNA, then studied the propagation law of shock wave and dynamic response of the station structure of explosives in the station, respectively [9]. Li et al. used AUTODYNA to establish a subway station model and studied the propagation law of explosive shock wave generated by the explosion of explosives in the station platform center [10]. Besides, some studies focused on simulating the concrete and steel element by finite element method [11-13]. Mohammad Reza Ghasemi et al. study the influence of the role of slanted reinforcement on the bending capacity of SS beams [14]. Aydin Shishegaran et al. used nonlinear finite element analysis and surrogate models to investigate the resistance of reinforced concrete panels (RCPs) due to explosive loading [15]. Sun et al. used ANSYS / LS-DYNA to establish a 3D numerical model, simulating the dynamic response of a concrete-filled steel tube column under an explosive load, then obtained the overall response characteristics of the concrete-filled steel tube column [16].
Fig. 1The structure of the paper
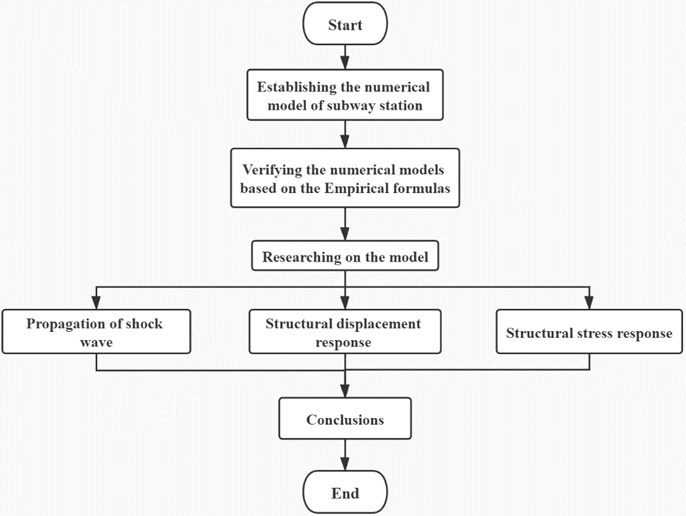
The Mafangshan station of Wuhan Rail Transit Line 8 is taken as a case. In this paper, the dynamic finite element numerical simulation software LS-DYNA is used to simulate the TNT explosion process inside the subway station, and the propagation law of shock wave after the explosion is analyzed. In addition, the structural displacement and stress response of the station structure were analyzed under different TNT charge. The structure of the paper is shown in Fig. 1.
2. Numerical model and parameter selection
2.1. Numerical modeling
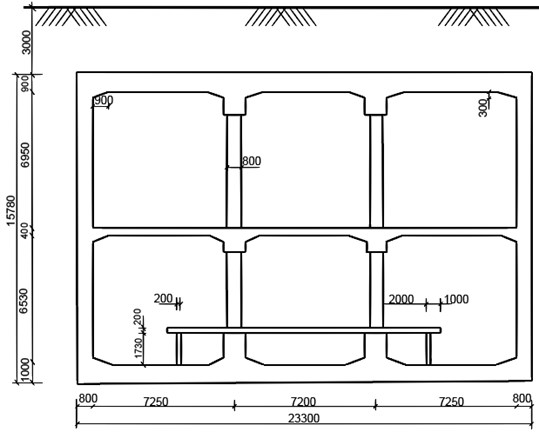
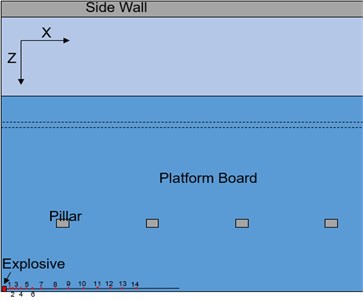
A numerical model is established based on the Mafangshan station of Wuhan metro line 8 project. Mafangshan station is a typical two-layer three-span island subway station with reinforced concrete box frame structure. The width of the standard section of the station is 23.3 m, the length is about 120 m, and the total construction area of the station is approximately 8196 m2, the overlying soil thickness of station is about 3.0 m. The dimensions of the main structure of the station are shown in Fig. 2. The size of the pillar in Fig. 2 is 800 mm×1100 mm, and the distance between pillars is 7.2 m, both vertically and horizontally.
Fig. 2The cross-section of Mafangshan station (unit: mm)
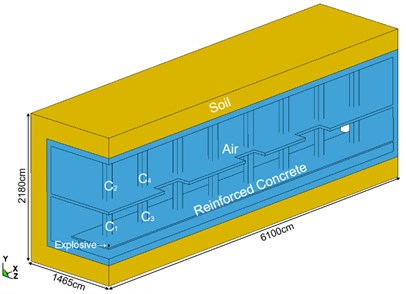
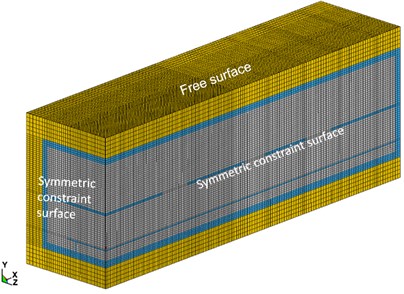
The numerical model of Mafangshan station is established by ANSYS/ LS-DYNA. The established finite element model adopts the cm-g-μs unit system. Due to the location of accidental explosions in subway stations is unpredictable. This paper is unable to conduct numerical simulation research on setting explosives in every place of subway station. In order to facilitate modeling calculation and research analysis, the explosion point is selected in the center of the station platform layer, and the height of the platform is as 40 cm. The explosive source is TNT square explosive, and different explosive charges of 5 kg, 10 kg, 20 kg, 30 kg, and 40 kg are considered to analyze the dynamic responses of the structure under different explosion loadings. The actual construction of the station is simplified in the numerical model, according to the symmetry of the station, a quarterly model of the subway station is built. The depth of the station is 3 m, the sidewall and lower part of the station are also made with a 3 m thick soil layer. The rest of the dimensions are determined by the actual size of the subway station. Finally, we obtained a numerical model of 6100×2180×1465 (cm), as shown in Fig. 3(a). The -axis is the longitudinal direction of the station, the -axis is the vertical direction, and the -axis is the horizontal direction. The gap in the middle floor is the station stairs and elevator shaft. The finite element model adopts Soild164 element. Material models include explosive, air, reinforced concrete and soil. Explosive, air and reinforced concrete are modeled using Euler-mesh, and the soil layer is modeled using Lagrange-mesh, as shown in Fig. 3(b). Fluid structure interaction (FSI) algorithm is adopted to calculate the concrete, explosive and the air due to the interaction of them [17].
Fig. 3The finite element model of the subway station
a)
b)
The soil around the station is a semi-infinite space. Due to the limitation of modeling, it is unable to build the whole soil around the station. Therefore, an only limited model with station structure and its surrounding soil is established. However, there will be reflection superposition of the stress waves at the model boundary without boundary conditions treatments, which will lead to imprecise results of the simulation. Lysmer proposed a non-reflecting boundary algorithm [18]. When non-reflecting boundary algorithm is set on the boundary, the boundary can be simulated as an infinite field. As the wave propagates to the boundary, it can be transmitted to an infinite distance. It is achieved by applying shear and viscous normal stresses on the boundary, as shown in the following formula:
where is normal stress, is Tangential stress, is the damping coefficient, is medium density, and are the velocities of longitudinal wave and transverse wave, respectively, and are particles on the boundary of the normal velocity and tangential velocity, respectively.
In this paper, the negative direction boundary surface, the negative direction boundary surface of the model and the right boundary of the model in the direction are set with the non-reflective boundary algorithm. In addition, Both the negative direction boundary surface and the positive direction boundary surface impose symmetry constraints, the positive direction boundary surface is free, as shown in Fig. 3(b).
2.2. The material model for explosive
In this paper, the high-energy explosive material model *MAT_HIGH_EXPLOSIVE_BURN [19] and the state equation of Jones-Wilkins-Lee [20] are used to simulate the TNT explosive. The high-energy explosive material model used to specify the density, detonation velocity and detonation pressure of explosive. The JWL equation of state is used to simulate the relationship between specific volume and pressure during explosive detonation. The equation defines the pressure as:
where is pressure, , , , , and are material constants, is the relative volume, is the initial specific internal energy.
The explosive, which is used in the numerical simulation, is TNT explosive, which relevant parameters refer to relevant literature [21]. The explosive density is 1630 kg/m3, the detonation pressure is 21 GPa, and the detonation velocity is 6930 m/s. The parameters of the explosive used in the Eq. (1) are shown in Table 1.
Table 1Related parameters of JWL equation of state
(GPa) | (GPa) | (GPa) | (cm3) | |||
374 | 3.23 | 4.15 | 0.95 | 0.38 | 7.00 | 1.00 |
2.3. The material model for air
The air in station is defined as an ideal gas, which is simulated by *MAT_NULL material model and the LINEAR_POLYNOMIA equation of state. The equation of state defines the pressure as:
where - is the material constant, is the specific internal energy, is the specific energy.
The air density is taken as 1.29 kg/m3. The state equation of ideal air is referred to the literature [22], and its parameters are shown in Table 2.
Table 2Related parameters of LINEAR_POLYNOMIA equation of state
(J·m-3) | |||||||
–1×10⁻⁶ | 0 | 0 | 0 | 0.4 | 0.4 | 0 | 2.5×10⁵ |
2.4. The material model for soil
The soil around the subway station is simulated by *MAT_DRUCKER_PRAGER material model [23], which is used to define the parameters of the yield surface as the friction angle and cohesion of the soil. This material model uses the improved Drucker Prager yield criterion, so that the shape of the yield surface can be distorted into a more realistic soil model. The expression of yield surface is as follows:
where is the shear stress intensity, is the average stress, , are the model parameters, which can be determined by the friction angle and cohesion of soil:
where is the friction angle, is the cohesion.
The main parameters of the soil model around the station are shown in Table 3.
Table 3Main parameters of soils model
Mass density (g·cm-3) | Shear modulus (MPa) | Poisson’s ratio | Cohesion (kPa) | Friction angle (°) |
1.80 | 32 | 0.32 | 10 | 25 |
2.5. The material model for reinforced concrete
The primary structural material of the station is reinforced concrete. Reinforced concrete consists of concrete and reinforcement, if the two materials are treated as different elements, the calculation results are accurate, but the modeling is complex and challenging to achieve. Therefore, we through the method of equal modulus to define the reinforced concrete as an equivalent concrete material, which approximately simulates the reinforced concrete structure [24]. The material adopts *MAT_PLASTIC_KINEMATIC material model, which is suitable for isotropic plastic follow-up strengthening material including strain rate effect. This model can be used to simulate the stress-strain behavior of concrete material. The yield condition is as follows:
where , can be determined by the following formula:
where is Cauchy stress tensor, and are the input constant, is hardening parameter, is the yield stress, and are strain rate and effective plastic strain respectively, is the plastic hardening modulus.
The parameters of reinforced concrete model are shown in Table 4.
Table 4Mechanical parameters of reinforced concrete materials
Mass density (g·cm-3) | Young’s modulus (GPa) | Poisson’s ratio | Yielding stress (GPa) | Tangent modulus (GPa) | Hardening parameter |
2.55 | 40 | 0.2 | 0.035 | 1 | 1 |
3. Reliability verification of numerical model
The explosion of explosives in the air is a process that is extremely fast, accompanied by light and heat and releasing a large charge of energy. The detonation products produced by the explosion features extremely high pressure in the air. It subsequently expands, diffuses and squeezes the surrounding air from the center of the explosive to the periphery, thus generating the explosion shock wave. With the increase of propagation time and distance, the energy of the shock wave gradually dissipates, and the peak overpressure value attenuates rapidly. Which characterizes the general propagation law of shock waves in the air.
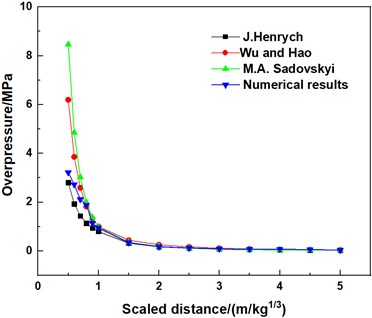
In order to accurately simulate the stress characteristics of subway structure under explosive load and the propagation of explosive shock wave, it is essential to determine the proper blasting loads for the simulation calculation. Therefore, to ensure the rationality of the model mesh and model parameters, the mesh sensitivity was analyzed. After analysis, the mesh size around the explosive in the numerical model is selected as 5 cm, and the rest is 10-20 cm. With this mesh size, the simulation result is ideal, as shown in Fig. 3(b). Besides, Considering that the peak pressure is the main factor that affects the surrounding objects and the model is not feasible for field test, to ensure the validity of the calculation model selected in this paper, the attenuation curve of the peak value of overpressure in the numerical simulation is compared with the curve obtained from the theoretical formula of TNT explosive explosion. The empirical formulas used in this paper are as follows:
J. Henrych suggested the expression for the peak overpressure of the shock wave in the air is as [25]:
Chengqing Wu and Hong Hao suggested an expression for the peak overpressure of the high explosive shock wave is as [26]:
M. A. Sadovskyi suggested the expression of peak overpressure of the high explosive shock wave was determined by experiments is as [27]:
where is the peak value of overpressure, is the scaled distance (, is the distance from the blasting center, is the explosive mass).
The numerical model with a 5 kg explosive charge is analyzed. Since the farther distance away from the blast center, the more energy dissipates and the smaller the overpressure peak is, resulting in the difficulty of contrastive analysis of calculated results. Therefore, the points close to the detonation source and along the direction are selected for comparison as shown in Fig. 4.
Fig. 4Monitoring point location
The peaks overpressure values obtained by numerical simulation and empirical formula at each point are listed in Table 5. For the convenience of comparison, the data in Table 5 is drawn as curves on the coordinate graph, as shown in Fig. 5. It can be seen from Fig. 5 that for a 5 kg charge, when the scaled distance is less than 1 m/kg1/3, the discrepancy between the numerical simulation and the three empirical formulas for the peak overpressure values small. As the scaled distance increases, the gap between the curves also decreases. Although there are some deviations in the near explosion area, the variation trend is consistent in general. Therefore, it can be concluded that the numerical model with 5 kg explosives has certain reliability. For other models, the explosive charge is several times of the 5 kg explosive charge, so the accuracy of other models is higher than that of the 5 kg model, all the five numerical models are reliable [28].
Table 5Peak overpressure values of different scaled distance obtained by various formulas (unit: MPa)
Scaled-distance (m/kg1/3) | 0.5 | 0.6 | 0.7 | 0.8 | 0.9 | 1.0 | 1.5 |
J. Henrych | 2.816 | 1.935 | 1.444 | 1.143 | 0.942 | 0.822 | 0.321 |
Chengqing Wu/Hong Hao | 6.202 | 3.865 | 2.594 | 1.828 | 1.333 | 1.038 | 0.443 |
M. A. Sadovskyi | 8.463 | 4.854 | 3.026 | 1.995 | 1.374 | 0.977 | 0.354 |
Numerical results | 3.214 | 2.722 | 2.113 | 1.884 | 1.135 | 0.946 | 0.340 |
Scaled-distance (m/kg1/3) | 2.0 | 2.5 | 3.0 | 3.5 | 4.0 | 4.5 | 5.0 |
J. Henrych | 0.175 | 0.112 | 0.081 | 0.062 | 0.047 | 0.038 | 0.032 |
Chengqing Wu/Hong Hao | 0.255 | 0.166 | 0.113 | 0.083 | 0.062 | 0.053 | 0.042 |
M. A. Sadovskyi | 0.184 | 0.112 | 0.075 | 0.052 | 0.044 | 0.035 | 0.032 |
Numerical results | 0.172 | 0.123 | 0.084 | 0.075 | 0.073 | 0.058 | 0.036 |
Fig. 5Overpressure peak curves of different scaled distances obtained by various formulas
4. Numerical simulation results
4.1. Propagation of shock wave
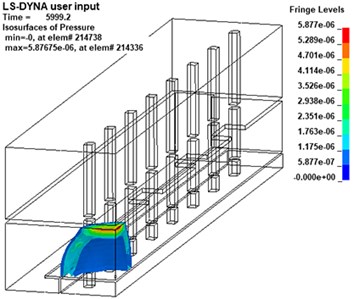
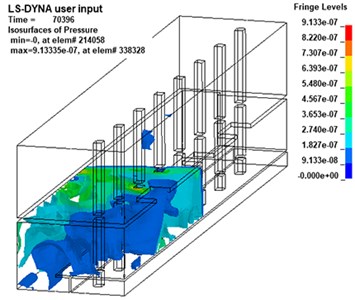
Different from the propagation law of shock wave in infinite space, the propagation law of shock wave in subway station is complicated due to the characteristics of its semi-closed structure [29]. In this paper, the shock wave propagation process of the 20 kg explosive model is analyzed by the post-processing software LS-PrePost, as shown in Fig. 6.
The detonation source is set at a low height, after reaching the platform layer, the shock wave reflected from the platform layer will overlap with the original shock wave before reflection. Therefore, it can be seen from Fig. 6 that the initial propagation of the shock wave is in the shape of a hemisphere. Then, at about 6ms, the shock wave propagates to the roof of the platform floor and reflection will occur after the contact with floor. It can be found that the superimposed pressure of the reflected wave and the incident wave is much higher than the pressure of the incident wave.
As the shock wave continues to propagate, it will spread to the track travel area and the sidewall. As the propagation distance increases, the energy of the shock wave will gradually decrease, and the pressure value at the sidewall will obviously decrease. However, due to the small space in the lower part of the track area, multiple reflections will occur between the track and the platform structure, so the pressure in this area will increase significantly. In addition, there is a bulge on the wavefront at the head of the stairs, indicating that the head of the stairs plays a role of explosion relief, transmitting part of the pressure to the station hall floor.
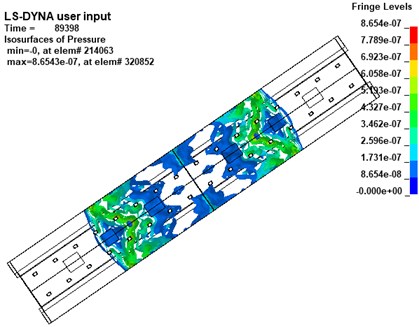
Then, at about 90 ms, from the overall overhead view of the station shown in Fig. 7, it can be found that the wavefront of the shock wave gradually becomes a plane from the original spherical or irregular convex surface and propagates to both ends of the station.
Fig. 6Nephogram of shock wave at different times (charge of TNT: 20 kg)
a)1.8 ms
b)6.0 ms
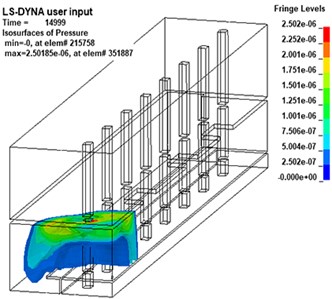
c)15.0 ms
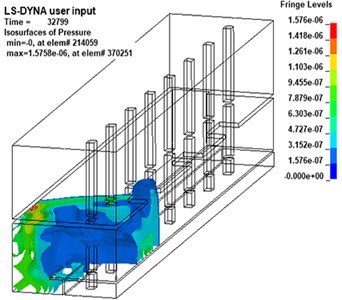
d)32.8 ms
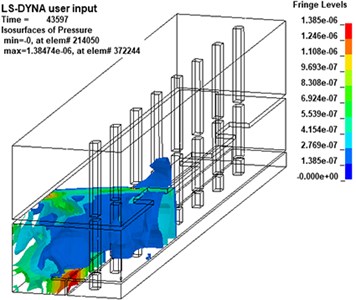
e)43.6 ms
f)70.4 ms
4.2. Structural displacement response of explosion
The numerical model with the explosive charge of 20 kg is shown and analyzed in LS-PrePost, and it showed that the plate, pillar, wall of the station had an absolute displacement after the explosive explosion. However, the charge of explosives is not very large, the range of structural displacement response is limited, and the impact of shock wave on the structure becomes relatively small after the fourth pillar. Therefore, only the structure within a specific range of the explosion is analyzed. Considering that the impact of shock wave on the pillar is mainly concentrated on the pillar close to the explosive, the structure within the range of the two pillars close to the explosive in the 1/4 model is analyzed. The upper and lower pillars are named as , , and , respectively (Fig. 3(a)).
Fig. 7Nephogram of shock wave propagation at 90ms (charge of TNT: 20 kg)
We first analyze the platform plate in the station structure. Starting from the platform plate at the bottom of the explosive, a node is taken every 5 m and a total of 4 points are considered to obtain the displacement and time history curve of its -axis (plate displacement is mainly -direction displacement), as shown in Fig. 8. It can be seen from Fig. 8 that the platform plate under the explosives has the maximum displacement, about 35.2 mm. As the distance between the nodes and the explosive center increases, the energy of shock wave decreases, and the peak displacement of the platform plate decreases. In addition, under the action of structural damping, the peak value of displacement will also gradually decrease with time [30].
Fig. 8Platform plate nodes at different distances from the explosion center displacement-time curve (charge of TNT: 20 kg)
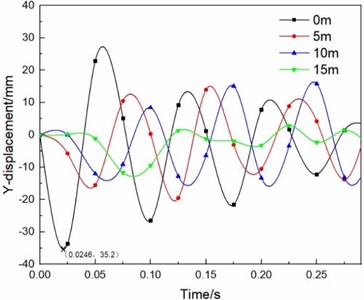
Table 6 shows the maximum displacement response of the station structure under different explosive charges. The plate displacement in Table 6 is taken from the position on the same vertical axis as the explosive, and the plate structure displacement is mainly the vertical displacement (-axis); The two ends of the pillar are constrained, so the displacement of the pillar in Table 6 is primarily the horizontal displacement. (that is, the plane displacement of the model), and the maximum displacement is concentrated in the middle of each pillar. As can be seen from Table 6, in different explosives, due to the closest distance to the explosion source, the displacement response under the platform board explosion center is the most significant, reaching 13.3 mm, 22.8 mm, 35.2 mm, 45.6 mm and 68.8 mm respectively. The second is the middle floor directly above the explosion source, and the displacement of each pillar is mostly a few millimeters. It is reasonable that the displacement response of the structure increases with the charge of explosive.
Table 6Maximum displacement response of structures under different explosive charges (unit: mm)
Structural position | 5 kg | 10 kg | 20 kg | 30 kg | 40 kg |
Platform board | 13.6 | 22.8 | 35.2 | 45.6 | 68.8 |
Middle floor | 5.76 | 9.21 | 14.2 | 19.4 | 25.3 |
Middle of pillar | 1.30 | 2.41 | 3.83 | 4.53 | 5.13 |
Middle of pillar | 0.48 | 0.66 | 1.81 | 2.01 | 2.41 |
Middle of pillar | 0.78 | 1.23 | 2.62 | 2.88 | 3.63 |
Middle of pillar | 0.22 | 0.47 | 1.21 | 1.41 | 1.72 |
4.3. Structural stress response of explosion
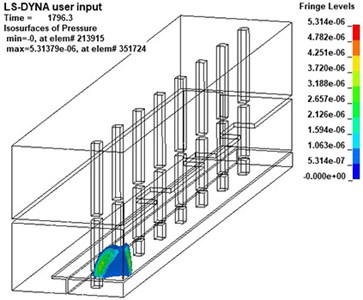
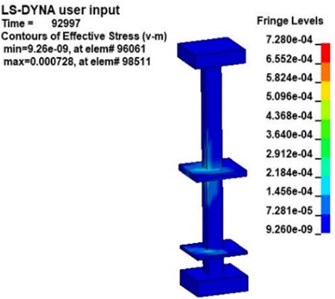
Fig. 9 shows the v-s stress nephogram of a 20 kg explosive model after the explosion. According to the effective stress in Fig. 9, the stresses in the platform, middle floor and the pillar near the explosive in the station structure are obvious after the explosion. Because the pillar closest to the explosive is under more significant stress, the effective stress in pillar and under 20 kg of explosive was studied. Fig. 10 is an effective stress nephogram on the pillar at different times. It can be seen in Fig. 10 that stress first appeared at the bottom of the pillar about 9 ms after the explosion. Then the stress propagated to both ends of the pillar, the obvious stress appeared at the junction of the pillar and the board. Besides, it can be found that there is a regular vibration of the stress value in the pillar, which is particularly obvious at the junction of the pillar and the middle floor. Then the effective stress in the pillar gradually weakens and dissipates. The results obtained with other explosives were similar.
Fig. 9V-s effective stress nephogram of the subway station at 50 ms
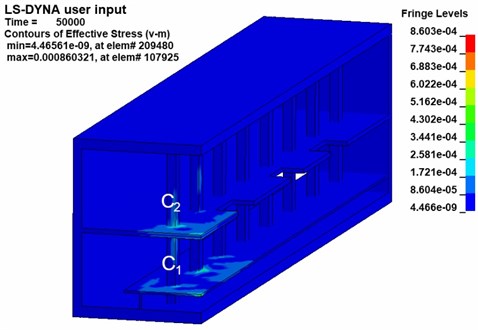
Because the pillar plays the role of supporting the overall structure in the subway station, it is the most important force-bearing component. The pillar C1 located at the lower of the station is the pillar with the most stress in the station, so to further obtain the stress of the structure in the station, the pillar is taken for further analysis. The highest point, lowest point and middle point of the centerline of each face of pillar are selected as monitoring points. A total of 12 monitoring points on the pillar, as shown in Fig. 11. After the explosion, the pillar is exposed to the shock wave of the explosion, so tensile and compressive stress will be generated in the pillar. The pillar material is a reinforced concrete material, and its tensile performance is far less than its compressive performance. Therefore, the tensile stress of each monitoring point is used as a criterion for whether the pillar is damaged.
Fig. 10Effective stress nephogram of the pillar under explosion at different times (charge of TNT: 20 kg)
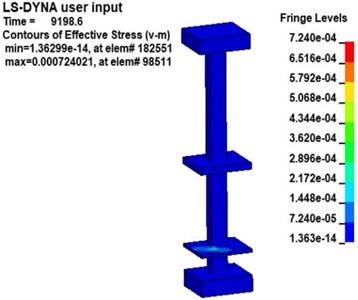
a)9.2 ms
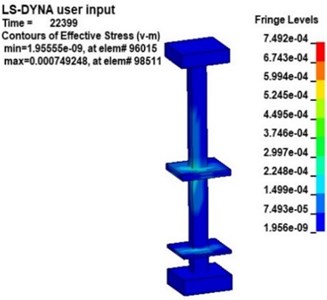
b)22.4 ms
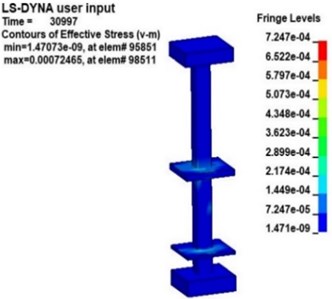
c)31.0 ms
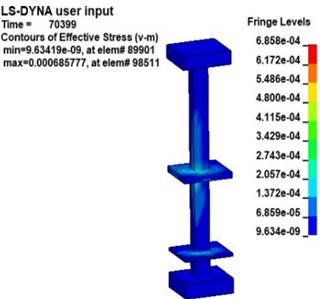
d)70.4 ms
e)93.0 ms
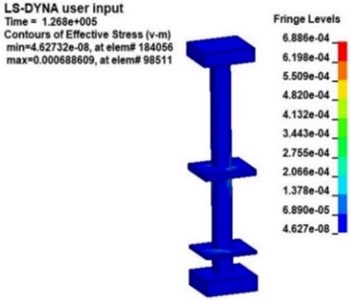
f)126.8 ms
Table 7 is a statistical table of the maximum tensile stress at each monitoring point in the pillar . It can be seen from Table 7 that under the same explosive charge, the tensile stress at each monitoring point of the pillar is different and the tensile stress distribution is uneven. In addition, by comparing the tensile stress of each monitoring point of the pillar under different explosive charges, it can be found that the maximum tensile stress in the pillar is always at the bottom of the pillar, followed by the top of the pillar, and the tensile stress in the middle of the pillar is the smallest. Further analysis of the tensile stress at the bottom of the pillar, in the case of different explosive charges, the tensile stress at the monitoring point b3 is the largest among the four monitoring points at the bottom of the pillar. That is, the tensile stress at the bottom of the frontal surface perpendicular to the axis is the largest. In the analysis of the explosion limit of reinforced concrete structures, according to the theory of equal strength, the structural ultimate tensile stress strength of concrete materials equivalent to reinforced concrete can be estimated to be 10.0 MPa [31]. In the data in Table 7, under the action of the explosive shock wave of 5 kg TNT explosive, the tensile stress values in pillar did not exceed the structural ultimate tensile stress, and the structure was safe. Under the action of 10 kg TNT explosive, most areas in the pillar Destruction; under the effect of TNT explosives of more than 20 kg, the structure in the pillar has been destroyed.
Fig. 11Selection of monitoring points
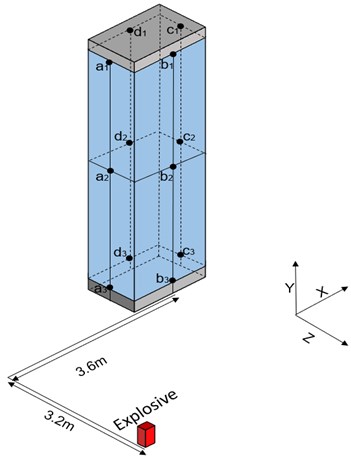
Table 7Tensile stress of monitoring points (unit: MPa)
Monitoring point | 5 kg | 10 kg | 20 kg | 30 kg | 40 kg |
5.8 | 10.8 | 19.4 | 23.4 | 30.5 | |
4.2 | 8.6 | 11.7 | 15.4 | 22.6 | |
6.2 | 11.6 | 20.8 | 26.8 | 32.5 | |
5.7 | 12.4 | 19.2 | 25.6 | 32.6 | |
5.0 | 9.2 | 14.2 | 16.7 | 23.7 | |
8.1 | 14.6 | 23.1 | 29.3 | 45.1 | |
5.2 | 10.9 | 18.7 | 23.4 | 31.2 | |
4.1 | 8.3 | 10.6 | 14.5 | 21.2 | |
5.9 | 11.2 | 20.6 | 24.5 | 34.6 | |
4.8 | 9.8 | 16.2 | 19.2 | 28.2 | |
3.8 | 7.8 | 10.2 | 14.1 | 19.6 | |
5.6 | 10.2 | 18.6 | 23.4 | 31.2 | |
Maximum | 8.1 | 14.6 | 23.1 | 29.3 | 45.1 |
According to the data in Table 7, it can be obtained that the value of the tensile stress generated at in the pillar is the largest under the impact of the explosive shock wave. Therefore, the tensile stress at this point is used as the criterion for determining whether the pillar undergoes is damaged. When the maximum tensile stress at point is greater than or equal to the structural ultimate tensile stress of the material, the structure fails. According to the data in Table 7, the explosive charge and the tensile stress value at are linearly fitted, and the functional relationship between the two is approximately determined from a statistical perspective. The relationship between the tensile stress at the pillar and the charge of explosive can be obtained, as shown in Fig. 12, and the formula is as follows:
where is the tensile stress at , and is the charge of TNT explosive.
Fig. 12The fitting formula of tensile stress value and explosive quantity at b3
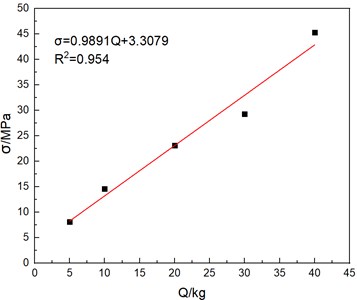
According to the ultimate tensile stress of the station pillar, combined with the fitting formula, it can be roughly deduced that when the charge of TNT explosive is 6.77 kg, the tensile stress at the bottom of the pillar is equal to the ultimate tensile stress of the structure. At this time, cracks will occur at the bottom of the pillar, and the structure will be damaged.
The explosive model used in this paper is TNT, which is a simple substance explosive and has a wide range of uses in the military. At present, with the development of explosive manufacturing technology, the types of explosives used by terrorists have shown an increasing trend. In addition to TNT explosives, such as RDX, rock emulsion explosives, ammonium nitrate explosives, and various homemade explosives have also been used in terror. Therefore, in consideration of other types of explosives, the TNT equivalent method is used to convert the charge of TNT explosives that cause cracks at the bottom of the station pillar in this paper to other types of explosives. According to the relevant literature [32], the formula for calculating the TNT explosive equivalent of different types of explosives is:
where is the actual explosive charge, is the explosive charge of the TNT explosive, is the explosive heat of the actual explosive, and is the explosive heat of the TNT explosive.
Table 8The charge of different types of explosives required for cracking at the bottom of pillar C1
Type of explosive | Explosive heat (kJ/kg) | Equivalent charge (kg) |
TNT | 4200 | 6.77 |
RDX | 5350 | 5.31 |
HMX | 5673 | 4.77 |
2# rock emulsion explosives | 3182 | 8.93 |
Ammonium nitrate explosives | 3896 | 7.30 |
Nitroglycerin | 2800 | 10.1 |
According to the explosive heat of different types of explosives, combined with the formula, we can get the charges of explosives required to crack the bottom of pillar under the action of different kinds of explosives, which are shown in Table 8.
5. Conclusions
In this paper, the Mafangshan Station of Wuhan Metro Line 8 is taken as a case to study the propagation of shock wave and dynamic response of the structure under the effect of internal explosion. The main research contents and conclusions are as follows:
1) The propagation law of shock wave: The propagation of shock waves in semi-closed underground stations is a complex process. In this paper, the initiation height is low. After the initiation, the explosion shock wave starts to propagate in the shape of a hemisphere. During the propagation of the shock wave, the shock wave will reflect at the pillar, plate and wall of the station, the pressure increase can be seen where the reflected and incident waves are superimposed. The pressure at the entrance of the staircase will decrease, so the entrance of the stairs has a certain vent effect. In addition, after propagating for a certain distance, the shock wave will propagate forward as an approximately plane wave, and the peak value of overpressure will decrease as the propagation distance increases, which should be due to the dissipation of energy.
2) Analysis of displacement response of subway station structures under the action of the explosion. Under the effect of different explosive charges, the displacement at the platform plate directly below the center of the explosive is the largest, followed by the middle floor directly above the explosive, and the displacements of remaining structures are small. Because the two ends of the pillar in the station are constrained, the displacement of the pillar is mainly horizontal. The maximum displacement is in the middle of each pillar, and its value is about 1-3 mm.
3) Analysis of stress response of subway station structures under the action of the explosion. Because the pillar is the most important structural part of a subway station, the stress of pillar is taken as an analysis point in this paper. From the analysis results, the stress on the pillar closest to the explosive is complex, and the stress distribution at each part of the pillar is uneven, the stress at the bottom of the pillar is the largest. Because the tensile strength of a reinforced concrete pillar is much smaller than the compressive strength, the tensile stress is used as a criterion for whether the pillar is damaged. According to the relationship between the tensile stress at the bottom of the pillar and the charges of explosives, combined with the ultimate tensile strength of the station structure, it can be concluded that under the action of about 6.77 kg TNT, the bottom of the pillar will crack. In addition, combined with the TNT equivalent method, the charge of explosives in which the pillar cracks under different types of explosives are considered.
References
-
Chandra N., Ganpule S., Kleinschmit N. N., Feng R., Holmberg A. D., Sundaramurthy A., Selvan V., Alai A. Evolution of blast wave profiles in simulated air blasts: experiment and computational modeling. Shock Waves, Vol. 22, Issue 5, 2012, p. 403-415.
-
Remennikov A. M., Rose T. A. Modelling blast loads on buildings in complex city geometries. Computers and Structures, Vol. 83, Issue 27, 2005, p. 2197-2205.
-
Janovsky B., Selesovsky P., Horkel J., Vejsa L. Vented confined explosions in Stramberk experimental mine and AutoReaGas simulation. Journal of Loss Prevention in the Process Industries, Vol. 19, Issues 2-3, 2006, p. 280-287.
-
Lannitti G., Bonora N., Curiale G., Muro S. D., Marfia S., Ruggiero A., Sacco E., Scafati A., Testa G. Analysis of reinforced concrete slabs under blast loading. Procedia Structural Integrity, Vol. 9, 2018, p. 272-278.
-
Buonsanti M., Leonardi G. G. 3-D simulation of tunnel structures under blast loading. Archives of Civil and Mechanical Engineering, Vol. 13, Issue 1, 2013, p. 128-134.
-
Pennetier O., William-Louis M., Langlet A. Numerical and reduced-scale experimental investigation of blast wave shape in underground transportation infrastructure. Process Safety and Environmental Protection, Vol. 94, 2015, p. 96-104.
-
Yan Q. S. Damage assessment of subway station columns subjected to blast loadings. International Journal of Structural Stability and Dynamics, Vol. 18, 2018, p. 1850034.
-
He W., Chen J. Y., Guo J. Dynamic analysis of subway station subjected to internal blast loading. Journal of Central South University of Technology (English Edition), Vol. 18, Issue 3, 2011, p. 917-924.
-
Qu S. S., Li Z. X. Dynamic response and damage analysis of a subway station structure due to internal explosion. Journal of Tianjin University, Vol. 45, Issue 4, 2012, p. 285-291.
-
Li S. Q., Li X., Wu G. Y. Numerical simulation of propagation law of blast wave inside a subway station. Journal of Vibration and Shock, Vol. 32, Issue 7, 2013, p. 176-178.
-
Yan Q. S., Chen T. Y., Liao W. Z. Comparison of numerical analysis loading methods of RC columns under near-field explosion. Journal of Beijing University of Technology, Vol. 46, Issue 2, 2020, p. 154-161.
-
Akhlaghi E. Numerical simulation of air shock wave propagation effects in reinforced concrete columns. Journal of Modeling and Optimization, Vol. 12, Issue 1, 2020, p. 12-22.
-
Shishegaran A., Ghasemi M. R., Varaee H. Performance of a novel bent-up bars system not interacting with concrete. Frontiers of Structural and Civil Engineering, Vol. 13, Issue 6, 2019, p. 1301-1315.
-
Ghasemi M. R., Shishegaran A. Role of slanted reinforcement on bending capacity SS beams. Vibroengineering Procedia, Vol. 11, 2017, p. 195-199.
-
Shishegaran A., Khalili M. R., Karami B., Rabczuk T., Shishegaran A. Computational predictions for estimating the maximum deflection of reinforced concrete panels subjected to the blast load. International Journal of Impact Engineering, Vol. 139, 2020, p. 103527.
-
Sun Y., Mao C., Du X. X. Dynamic response analysis of concrete rectangular steel tube columns under blasting loading. Journal of Tianjin Chengjian University, Vol. 21, Issue 4, 2015, p. 258-261.
-
SchaFer M., Teschauer I. Numerical simulation of coupled fluid-solid problems. Computer Methods in Applied Mechanics and Engineering, Vol. 190, Issue 28, 2001, p. 3645-3667.
-
Lysmer J.,Kuhlemeyer R. L. Finite dynamic model for infinite media. Journal of the Engineering Mechanics Division, Vol. 95, Issue 4, 1969, p. 859-878.
-
Mahmadi K., Aquelet N., Souli Y., Gabrys J. W. ALE multi-material formulation of high explosive detonation using LS-DYNA3D. ASME Pressure Vessels and Piping Conference, 2002, p. 111-119.
-
Halquist J. O. LS-DYNA Keyword User's Manual (version 971). Livermore Software Technology Corporation, Livermore, 2007.
-
Hu Q., Yu H., Yuan Y. Numerical simulation of dynamic response of an existing subway station subjected to internal blast loading. Transactions of Tianjin University, Vol. 14, 2008, p. 563-568.
-
Zang W. W. Research on Impact Response and Protection Technology of Metro Station under Terrorist Explosion Load. University of Science and Technology, Shandong, 2010.
-
Boldyrev G. G., Muyzemnek A. J. The modelling of deformation process in soils with use of Ansys and Ls-Dyna programs. International Conference on Case Histories in Geotechnical Engineering, 2008.
-
Kong D. D., Zhao Y. H., Wang P. X. Equivalent moduli method in the finite element analysis of reinforced concrete structures. Journal of Shenyang University of Architecture (Natural Science Edition), Vol. 21, Issue 3, 2005, p. 200-203.
-
Henrych J. The Dynamics of Explosion and Its Use. Springer, Berlin, 1979.
-
Wu C. Q., Hao H. Modeling of simultaneous ground shock and airblast pressure on nearby structures from surface explosions. International Journal of Impact Engineering, Vol. 31, Issue 6, 2005, p. 699-717.
-
Sadovskyi M. A. Mechanical Action of Air Shock Waves of Explosion, Based on Experimental Data. Izd Akademiia Nauk SSSR, Moscow, 1952.
-
Yan Q. S. Study on Explosion Flow Field Distribution and Dynamic Response in Typical Subway Structures. Tsinghua University, Beijing, 2011.
-
Kong D. S., Shi M. C., Zhang W. W., Meng Q. H. Research on propagation laws of explosive shock wave inside metro station. Chinese Journal of Underground Space and Engineering, Vol. 7, Issue 5, 2011, p. 863-868.
-
Qu S. S. Study on Structural Response and Damage and Ground Vibration of Subway Station under Internal Explosion. Tianjin University, Tianjin, 2012.
-
Chen J. J., Hu Y. L., Xin C. L., Li Z. K., Wang C. M. FEM optimization analysis on anti-explosion ability of reinforced concrete structure. Chinese Journal of Rock Mechanics and Engineering, Vol. 21, Issue 4, 2002, p. 554-557.
-
Kong D. S., Zhang W. W., Meng Q. H., Meng Y. Q. Estimation and evaluation of terror explosion equivalent in underground by TNT equivalent. Chinese Journal of Underground Space and Engineering, Vol. 6, Issue 1, 2010, p. 197-200.
Cited by
About this article

The study was sponsored by the National Natural Science Foundation of China (Grant No. 41807265 and Grant No. 41972286) and the Project was Supported by the Fundamental Research Funds for the Central Universities, China University of Geosciences.
