Abstract
A physical test model of a new lining structure for a shallow double-arch tunnels under unsymmetrical pressure with a scale of 1:20 was designed and manufactured. Kobe seismic waves and EI seismic waves were selected as the loading waves and a large-scale shaking table test was carried out. The acceleration and dynamic strain response of shallow double-arch tunnels under unsymmetrical pressure under different seismic wave types and seismic intensities are studied. The results show: Under different seismic wave excitations, only the horizontal acceleration amplification factor of the left-hole vault, right-hole invert and the top right of the mid-partition is less than 1, and the horizontal acceleration amplification factors of other measurement points are all greater than 1. The measurement points with relatively large horizontal acceleration response are the left-hole shoulder, the top left of the mid-partition, the right-hole vault and shoulder; The overall response of the right half-arch of the left-hole is greater than the left half-arch of the left-hole, and the overall response of the left half-arch of the right-hole is greater than the right half-arch of the right-hole. The measured points in the left half-arch of the left-hole and the right half-arch of the right-hole have small differences in acceleration response; The effects of Kobe wave on horizontal acceleration and vertical acceleration are greater than EI wave, and the average value of the vertical acceleration response of the lining is greater than the average value of the horizontal acceleration response. With the increase of seismic intensity, the larger the acceleration amplification factor is, the greater the increase is; Under the action of different seismic waves, the seismic wave excitation has a greater impact on the dynamic strain response of the left-hole, and less impact on the right-hole. Among them, the strain value of the left-hole shoulder, left-hole invert and the top left of the mid-partition is much larger than the other measurement points, the trend of the right-hole is relatively gentle, and the strain values of the shoulder are slightly larger. The research conclusions have certain guidance and reference value for the seismic design of shallow double-arch tunnels under unsymmetrical pressure.
Highlights
- A physical test model of a new lining structure for a shallow double-arch tunnels under unsymmetrical pressure with a scale of 1:20 was designed and manufactured.
- Kobe seismic waves and EI seismic waves were selected as the loading waves and a large-scale shaking table test was carried out.
- The acceleration and dynamic strain response of shallow double-arch tunnels under unsymmetrical pressure under different seismic wave types and seismic intensities are studied.
1. Introduction
Multi-arch tunnels have the advantages of smooth plane alignment and small occupation area, and they are increasingly used in engineering. An earthquake is a natural disaster that is highly destructive and difficult to prevent, which has a huge impact on tunnel engineering. During the 2008 Wenchuan earthquake, the Longxi Tunnel, Longdongzi Tunnel and Zipingpu Tunnel along the Duwen Expressway were severely damaged [1]. Once the tunnel is damaged, it is difficult to repair it [2, 3], so the study of the seismic response of the double-arch tunnel has become the forefront of many scholars.
The structural internal forces of seismic response of shallow-buried large-span double-arch tunnels and compared them with single-arch tunnels were solved by Yang et al. [4]. Huang [5] found that seismic response of a shallow-buried double-hole tunnel under anti-seismic measures. The effects of different grouting forms and grouting thickness on the double-arch tunnel in high-intensity earthquake zones were discussed by Wang et al. [6]. Wang [7] found that the law of seismic intensity and changes of surrounding rock parameters to the seismic dynamic response of double arch tunnel opening. Seismic dynamic response of a double-arch highway tunnel caused by horizontally propagating shear waves were studied by Ling et al. [8]. Guangyao Cui [9] etc. used FLAC3D finite element software to analyze the safety of double-arch double-arch tunnel under seismic load. In summary, the few research results of seismic response characteristics of double-arch tunnels currently obtained are basically realized by numerical simulation methods, and few large-scale shaking table tests are used for research. The shaking table test can truly reproduce the damage process of engineering structures caused by earthquakes. It is the most advanced research method today and deserves more in-depth research.
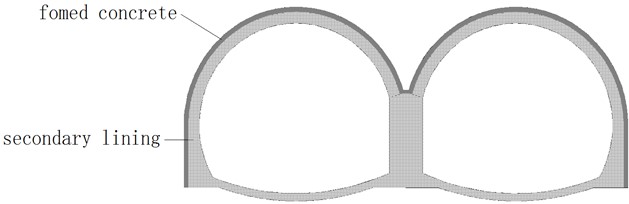
Shallow double-arch tunnels under unsymmetrical pressure have thinner overlying soil layers and are asymmetrically stressed. The degree and frequency of earthquake damage are greater than those of ordinary tunnels, and they also have different seismic response characteristics than ordinary tunnels. In addition, studies by D. S. Kim and K. Konagai [10]show that the existence of a tunnel shock-absorbing layer can greatly reduce the effect of earthquakes on lining structures. In view of this, the research team developed a new lining structure for shallow buried biased double-arch tunnels based on the concept of a shock-absorbing layer and the mechanical properties of foamed concrete. That is, the foamed concrete material is used to combine the initial lining sprayed layer of the tunnel with the shock absorption layer to form a primary foamed concrete lining. The secondary lining is still made of reinforced concrete, as shown in Fig. 1. The new lining structure can not only reduce the seismic effect of the secondary lining of the tunnel, but also simplify the construction process and save engineering costs. In order to study the seismic response characteristics of this new lining structure, a new lining structure model of a shallow buried biased double-arch tunnel with a scale of 1:20 was designed and manufactured, and a large-scale shaking table test study was carried out.
Fig. 1Schematic diagram of the new lining structure
2. Shaking table test scheme
2.1. Test equipment
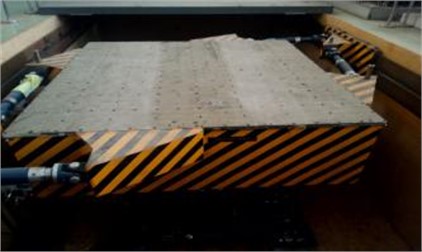
In this model test, a three-direction, six-degree-of-freedom shaking table of the National Engineering Laboratory for High-Speed Railway Construction Technology of Central South University was used. The experimental system consists of a fixed station and two mobile stations. The main parameters are as follows: The table size is 4 m×4 m; the frequency is 0.1-20 Hz, the maximum load is 30 t; The maximum horizontal acceleration is ±1.0 g and the maximum vertical acceleration is ±1.6 g at full load.
Fig. 2Test equipment
2.2. Similarity design
According to the similarity theory [11, 12], both the static and dynamic related parameters in the test must satisfy the similarity relationship, but it cannot be completely satisfied. Therefore, it is necessary to comprehensively consider factors such as the table size of the shaking table, performance parameters of various instruments, model boundary effects, and model making techniques. At the same time, due to the size of the tunnel structure model and the shallow buried environment, it is difficult to implement an artificial mass model, and the test content is to study the failure mechanism of the tunnel structure, so a gravity distortion model is used. The geometric similarity ratio in the main control amount of the model is 1:20, the density similarity ratio is 1:1 and the acceleration similarity ratio is 1:1. The other main similarity constants are shown in Table 1.
Table 1Model similarity constants
Physical parameters | Similarity relation | Similarity ratio |
Length / m | 20 | |
Density / Kg·m-3 | 1 | |
Elastic modulus / MPa | 20 | |
Stress / KPa | 1 | |
Poisson’s ratio | 1 | |
Time / s | 4.47 | |
Acceleration / m·s-2 | 1 | |
Displacement / mm | 20 | |
Velocity / m·s-1 | 4.47 | |
Frequency / Hz | 0.224 |
2.3. Model box design and boundary conditions
This test model box is a rigid model box with a size of 3.5 m (length) × 1.5 m (width) × 2.1 m (height). It has a rectangular parallelepiped structure and is fixed on the vibration table with bolts. Because this experiment is to transform the semi-infinite soil into a model box, the boundary problem is the focus of the experiment [13, 14]. In order to reduce the wave reflection at the boundary, a 10 cm thick polystyrene foam board is used as the flexible boundary in the measurement wall of the model box, and the lateral boundary wave is absorbed to simulate the boundary conditions of the soil. At the same time, in order to reduce the test error, a polyvinyl chloride film was pasted on the side to make it a slide boundary. At the bottom of the model box, in order to increase the friction between the bottom and the model, crushed stones with a diameter of 4 cm were laid, and then a layer of medium sand was used to fill the gaps between the crushed stones to prevent the model and the model box from sliding relative to each other during vibration.
2.4. Model making and materials
According to multiple matching tests, micro-concrete with a material mixing ratio of 1:7.83:1.64 (cement: sand: water) is used as the lining model material. The average compressive strength of the 100 mm micro-concrete cubic specimen is 2.5 MPa, in which medium coarse sand replaces coarse aggregate in concrete. The double-layer mesh reinforcement in the lining is simulated by a double-layer galvanized iron wire net. The diameter of double-layer galvanized iron wire net is 2 mm and the spacing is 1cm. The thickness of the lining vault is determined by the similar constant to be 3 cm, the thickness of the invert is 2 cm, and the foamed concrete is 1 cm. And after many tests, the average strength of the 100 mm cubic specimen of foam concrete is 0.5 MPa, and the material ratio is 1:256.8:171.2:214:0.91 (fiber: cement: fly ash: water: foam). In the test, terrain factors caused unsymmetrical pressure, and the slope was about 1:1.2. The surrounding rock of tunnel is divided into upper and lower layers. The surrounding rocks of category-V (SRC V) of the upper level is simulated by sandy silty clay. The rock material ratio of the surrounding rocks of category-IV (SRC IV) of the lower level is 10:5:1 (barite powder: quartz sand: lithium base grease) The main parameters are shown in Table 2.
Fig. 3Lining model
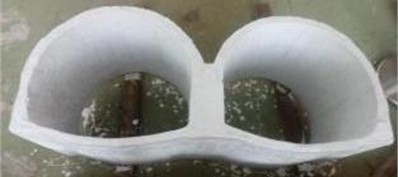
Table 2Main parameters of surrounding rocks
Surrounding rock level | Bulk density, / (KN·m-3) | Elastic modulus, / GPa | Poisson’s ratio, | Internal friction angle, (°) | Cohesion, / MPa |
Surrounding rock of category-IV (SRC IV) | 20.3 | 0.118 | 0.32 | 32 | 0.03 |
Surrounding rock of category-V (SRC V) | 18.4 | 0.056 | 0.37 | 24 | 0.0087 |
2.5. Sensor arrangement
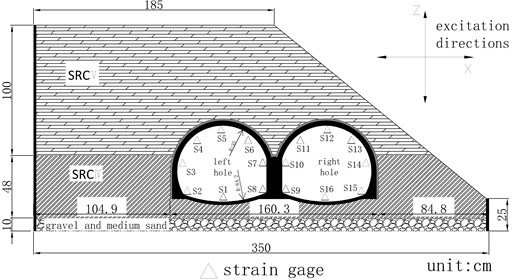
The data acquisition sensors used in this test are accelerometers (unidirectional) and strain gauges. Horizontal and vertical unidirectional accelerometers are arranged at each measuring point. The accelerometer model is 1221L-002, the range is ±20 m.s-2, the sensitivity is 2000 mv/g, the strain gauge is attached in the form of a 45° strain flower, the model is BX120-50AA, the resistance is 120±1 Ω, and the size is 58.2×6.5 mm, the sensitivity is 2.0±1 %. The layout method is as simple as possible on the premise of meeting the information collection, to avoid artificial structure surface caused by the layout of the instrument. According to the existing theories, the numerical simulation results and experimental research objectives are combined (all the measuring points are on the secondary lining). The mid-partition, vault, shoulder, arch foot and invert in the multi-arch tunnel are the key parts for stress and deformation. So the arrangement is shown in Fig. 2. The acceleration numbers are A1-A12, the first letter A represents the accelerometer, the strain gauges are S1-16, and S represents the strain gauge.
2.6. Loading scheme
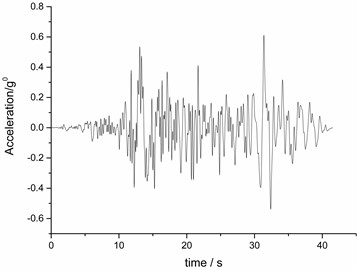
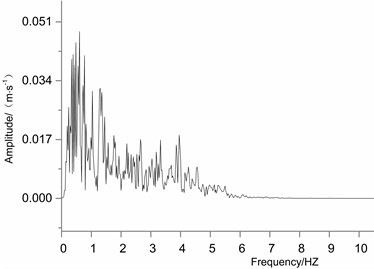
Kobe wave and EI wave are selected as excitation waves in the test. Both -direction and -direction bidirectional loading methods are used. Loading conditions are shown in Table 3. The compression time ratio of seismic waves is 4.47. The time history curve and Fourier spectrum are shown in Fig. 6. As can be seen from the figure, the dominant frequency of Kobe wave is 2-4 HZ and 6 HZ, and the dominant frequency of EI wave is 0-1 HZ. According to the specification [15], since vertical and horizontal seismic waves rarely reach the acceleration peak at the same time, during the test, the vertical seismic wave takes 2/3 of the peak acceleration of the horizontal seismic wave for loading. The seismic intensity of the test was IV-X [16], so the corresponding accelerations were: 0.1 g, 0.2 g, 0.4 g, 0.6 g. Before the beginning of the test and after the end of the test, a white noise (denoted as WN-xz) was loaded for 60 seconds to observe the changes in the dynamic characteristics of the model.
Fig. 4Arrangement of acceleration measurement points
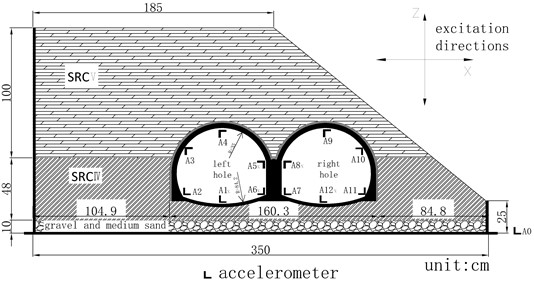
Fig. 5Arrangement of strain measurement points
3. Analysis of shaking table test results for shallow double-arch tunnels under unsymmetrical pressure
3.1. Acceleration response law of shallow double-arch tunnels under unsymmetrical pressure
Prior to the analysis of acceleration dynamic response of a double-arch tunnel, two indexes of acceleration dynamic response peak value and acceleration amplification factor are used. The prescribed acceleration amplification factor is: when -direction and -direction acts bidirectionally, the -direction acceleration amplification factor is the ratio of the peak acceleration response in the horizontal direction of the measurement point to the horizontal acceleration response peak of the table, and the -direction acceleration amplification factor is the ratio of the peak acceleration response in the vertical direction of the measurement point to the vertical acceleration response peak of the table. In the picture, the letter K stands for Kobe wave and E stands for EI wave.
Table 3Shaking table model loading scheme
Number | Condition | Peak acceleration / g | |
-direction | -direction | ||
1 | WN-xz | – | – |
2 | K-xz | 0.1 | 0.067 |
3 | E-xz | 0.1 | 0.067 |
4 | WN-xz | – | – |
5 | K-xz | 0.2 | 0.1333 |
6 | E-xz | 0.2 | 0.1333 |
7 | WN-xz | – | – |
8 | K-xz | 0.4 | 0.267 |
9 | E-xz | 0.4 | 0.267 |
10 | WN-xz | – | – |
11 | K-xz | 0.6 | 0.400 |
12 | E-xz | 0.6 | 0.400 |
Fig. 6Time history curve and Fourier spectrum of acceleration
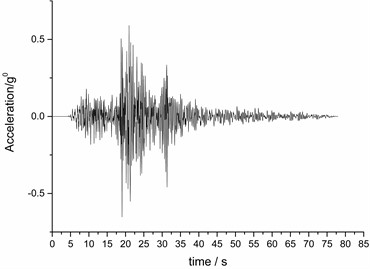
a) Acceleration time history curve of Kobe wave
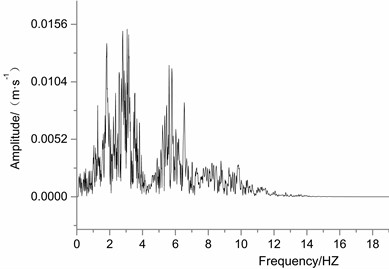
b) Fourier spectrum of Kobe wave
c) Acceleration time history curve of EI wave
d) Fourier spectrum of EI wave
3.1.1. Response law of horizontal acceleration of shallow double-arch tunnels under unsymmetrical pressure
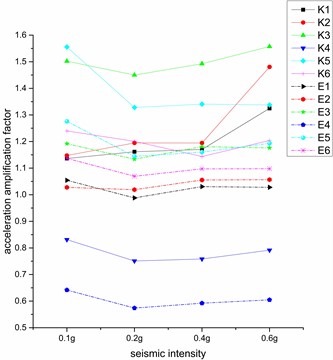
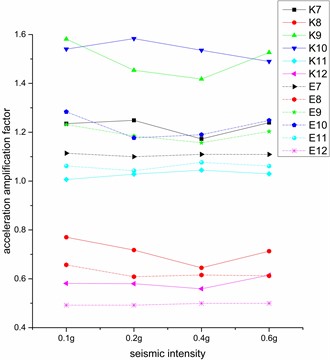
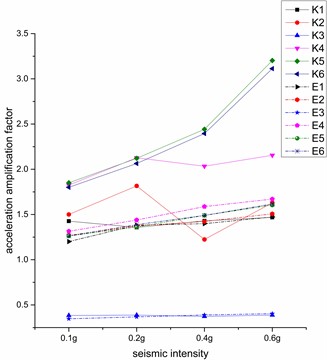
It can be seen from Fig. 7(a) that under Kobe seismic waves, only the left-hole vault, the right-hole invert and the top right of the mid-partition have amplification factors less than 1, and the acceleration amplification factors of other parts are all greater than 1. It shows that in addition to the left-hole vault, the right-hole invert and the top right of the mid-partition, all other points have amplifying effects on the seismic wave. And under different seismic intensities, the overall acceleration response of the tunnel has little difference in trend, which indicates that the seismic waves under different seismic intensities have less influence on the horizontal acceleration amplification factor. In addition, the acceleration amplification factors of the left tunnel measurement points and the right tunnel measurement points are different in value and trend. The curve of left tunnel has a trend of increasing and decreasing, then increasing and decreasing, and the average acceleration amplification factor of the left tunnel is greater than the right tunnel. The reason is that the left tunnel has an enlarged effect on the acceleration amplification factor of the left tunnel when the soil cover is heavier.
Fig. 7Variation of the horizontal acceleration amplification factor under different seismic intensities
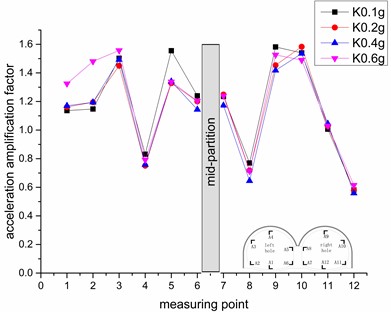
a) Kobe wave
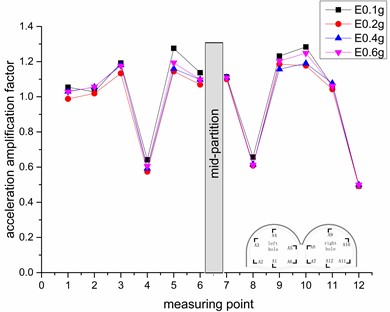
b) EI wave
The horizontal acceleration amplification factors of the right tunnel have a similar trend to the letter “N”. Among all the measuring points, the acceleration amplification factor of measuring point 10 is the largest, and the maximum value is 1.58. Among all measuring points, the acceleration amplification factor of measuring point 12 is the smallest, and the minimum value is 0.56. This shows that in the presence of a slope in the right tunnel, the surrounding rock pressure is uneven compared to the left tunnel, and the bias increases the energy transmission of the seismic wave.
Whether under Kobe wave or EI wave excitation, the overall trend of the tunnel is the same, indicating that the type of seismic wave has little effect on the acceleration amplification factor of the measurement point. At the same time, the measurement points with the largest acceleration response in the two figures are 3, 5, 9, 10, indicating that in the double-arch tunnel, the left-hole shoulder, the top left of the mid-partition, the right-hole vault, and the right-hole shoulder is the unfavorable part in the earthquake, so it should be specially fortified in the earthquake resistance. From the perspective of the surrounding rock, the double-arch tunnel is distributed between the surrounding rock of category-Ⅳ and Ⅴ. Compared with the measurement points in the surrounding rock category-Ⅴ and the measurement points at the junction of the fourth-fifth surrounding rock, the left tunnel measurement points 1, 2, 6 and the right tunnel measurement points 7, 11, 12 under the surrounding rock of category-Ⅳ are smaller and more stable under the seismic wave excitation, indicating that the higher the surrounding rock of a double-arch tunnel, the smaller the acceleration response of the corresponding lining when the seismic wave excites. A good surrounding rock can weaken the effect of the seismic wave.
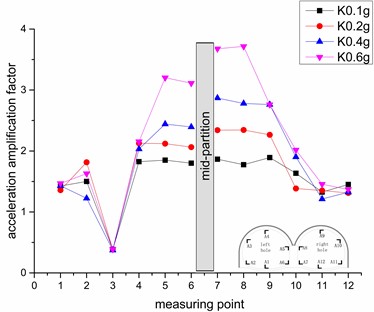
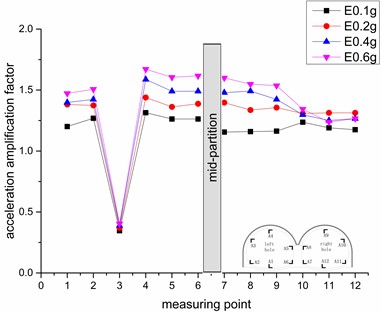
Fig. 8 shows the change rule of acceleration amplification coefficient of different measuring points under different seismic intensities, and it can be more intuitive to see the trend of each measuring point under different seismic intensities.
It can be seen from Fig. 8 that under EI seismic wave excitation, the trend of each measuring points is approximately the same, which is the largest at 0.1 g, and then when the seismic intensity increases, the acceleration amplification factor decreases, and then slowly increases, indicating that under low intensity seismic waves, the lining will amplify the effect of seismic waves. The trend under Kobe wave is more irregular, especially the left tunnel, which shows that under different surrounding rock pressures, the tunnel lining is greatly affected by Kobe wave and less affected by EI wave.
Fig. 8Variation rule of horizontal acceleration amplification factor at different measuring points
a) Left tunnel
b) Right tunnel
The distribution of acceleration amplification coefficients of each measuring points under Kobe wave excitation is more discrete than that of EI wave excitation, indicating that the tunnel acceleration response is more intense under Kobe excitation, because Kobe wave has two dominant frequencies, which has more energy than EI wave. Among the measurement points of 3, 9, 10 with larger acceleration amplification factor, the difference between the acceleration amplification coefficients under two different wave excitations is larger, and the difference between 4, 8, 11, 12 points is smaller. It shows that different seismic waves have different effects on different measuring points, and Kobe waves will aggravate the increasing degree to the measuring points that already have a larger amplification factor. At the same time, under the action of different seismic wave excitations, the difference of the left tunnel is larger, indicating that the seismic wave has a greater influence on the acceleration amplification factor of the measuring point when the soil cover is thicker.
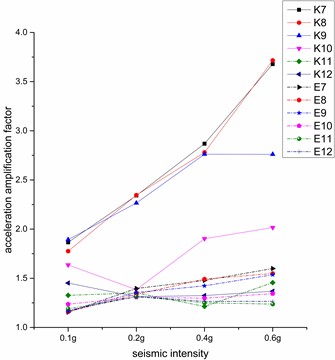
3.1.2. Response law of vertical acceleration of shallow double-arch tunnels under unsymmetrical pressure
Compared with the horizontal acceleration response, the vertical acceleration response is more regular, Fig. 9. is the variation rule of the vertical acceleration amplification factor under different seismic intensities. It can be seen from the figure that except for the acceleration amplification factor of the measurement point 3 is less than 1, the other measurement points are all greater than 1. It shows that all the measuring points of the tunnel lining, except the left-hole shoulder, have an amplification effect on the seismic wave. The reason that the right-hole shoulder is much larger than the left-hole shoulder may be that the right-hole shoulder is close to the slope, and the response of the slope under the seismic wave is coupled with the response of the tunnel lining under the seismic wave, which magnifies the acceleration response of the right-hole shoulder. At the same time, under the action of different seismic wave excitations, although the maximum difference of the magnification factor can reach 2.4 times, the trend of the acceleration response is similar. It shows that different seismic waves have a greater influence on the numerical value of the acceleration response of the lining, but have a smaller influence on the overall trend.
Fig. 9Variation rule of vertical acceleration amplification factor under different earthquake intensities
a) Kobe-xz
b) EI-xz
Under different seismic wave excitations, in addition to the left-hole shoulder, the acceleration amplification factor shows obvious symmetry in the vertical acceleration response of the left and right holes of the double-arch tunnel, and the difference in trend and value is relatively small. The trend of the acceleration response of the left tunnel shows a gradually increasing trend except for the arch shoulder. Under the Kobe wave excitation, the inflection point of the growth trend is the measurement point 5, and then decreases slightly, while under the EI wave excitation, the inflection point of the growth trend is the measuring point 4, and then it tends to be flat after the decline.
The acceleration amplification factor in the right tunnel is basically opposite to the left tunnel, showing a gradual downward trend. Under Kobe wave excitation, it drops sharply after the measurement point 9, and then the downward trend gradually smooths, while under the EI wave excitation, the acceleration amplification factor has a “bunch” after the measurement point 9. The acceleration response under high-intensity seismic waves decreases, the acceleration response under low-intensity seismic waves increases, and then the overall acceleration response tends to gentle.
Under different seismic waves, two regions of the left half-arch and the right half-arch appear obviously in the acceleration response of the double-arch tunnel.(For example, the measuring points 4, 5, and 6 of the left tunnel are the right half-arch area of the left tunnel, the other measuring points are the left half-arch area, the measuring points 7, 8, 9 of the right tunnel are the left half-arch area of the right tunnel, and the other measuring points are the right half-arch area.) The image shows that the overall response of the acceleration amplification factor of the right half-arch of the left tunnel is larger than that of the left half-arch of the left tunnel, and the overall response of the left half-arch of the right tunnel is greater than the right half-arch of the right tunnel. It shows that the interconnected lining of double-arch tunnel will amplify the degree of seismic wave excitation. In addition to the left-hole shoulder, the acceleration response of each measuring point is not much different in the specific half-arch area, such as the measuring points 4, 5, 6 under the right half-arch of the left tunnel and the measuring point 7, 8, 9 under the left arch of the right tunnel.
The main reason is that the right arche of the left tunnel and the left arche of the right tunnel are connected to each other, and the seismic wave affects each other at the connection part of the tunnel, which causes the response of both sides to be amplified. In the anti-vibration engineering, the connection part of the tunnel can be specially set regionally.
Fig. 10Variation rule of horizontal acceleration amplification factor at different measuring points
a) Left tunnel
b) Right tunnel
It can be seen from Fig. 10 that under different seismic waves, after the increase of seismic intensity, the overall response of the tunnel gradually expands. The measuring points with the largest acceleration amplification factor are the measuring point 7 under Kobe wave and the measuring point 4 under EI wave, and the maximum values reach 3.67 and 1.67 respectively. The effect of the half-arch area is obvious when the Kobe wave is excited. The acceleration factor of the right half-arch of the left tunnel and the left half-arch of the right tunnel increase gradually from 0.1 g to 0.4 g, but after loading 0.6 g seismic wave, the growth trend becomes faster. The left half-arch of the left tunnel and the right half-arch of the right tunnel that are not in contact with each other, although the acceleration amplification factor fluctuates when the seismic intensity increases, the overall acceleration response does not change as much as other measurement points. It shows that under Kobe wave excitation, the larger the acceleration amplification factor, the faster the increase trend with the increase of seismic intensity. The acceleration response under the EI wave is relatively flat, and the growth trend is relatively slow but stable, and is less affected by the seismic intensity than the Kobe wave. When designing the earthquake resistance of the tunnel, the two adjacent half-arch of the tunnel lining should be taken as an integral anti-shock measure to achieve the best anti-shock effect.
3.2. Dynamic strain response law of shallow double-arch tunnels under unsymmetrical pressure
This paper mainly analyzes the tensile and compressive strain response of lining under Kobe wave and EI wave excitation. Because the magnitude and direction of the main stress of the lining are difficult to determine under the excitation of seismic waves, the strain gauges are affixed in the form of a 45 °triaxial spline to calculate the maximum and minimum values of the main strain. Then, Eqs. (1) and (2) [17] calculate the maximum principal strain and the minimum principal strain:
where – maximum principal strain, – minimum principal strain, – direction strain, – direction strain, – 45°direction strain.
The maximum principal strain is tensile strain and the value is positive. The minimum principal strain is compressive strain and the value is negative.
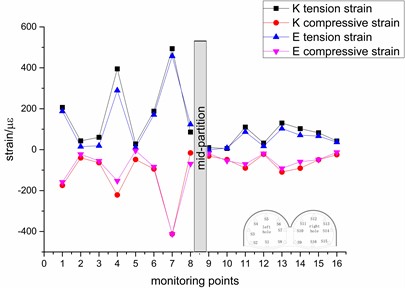
Fig. 11Variation trend of the peak strain
a) 0.1 g
b) 0.2 g
c) 0.4 g
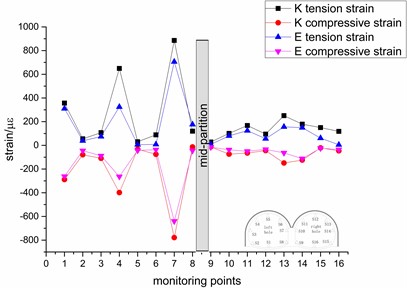
d) 0.6 g
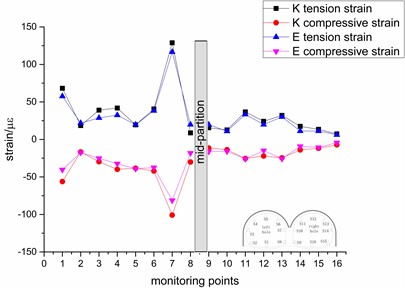
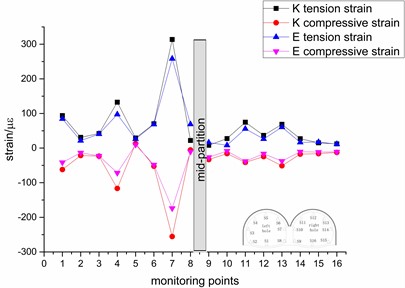
It can be seen from Fig. 11. that under the influence of different seismic waves, the change law and value of strain are basically the same, indicating that the seismic wave has little effect on the strain of the tunnel. With the gradual increase of the intensity, the strain value of the measuring point also gradually increases, but the value of most of the strain does not exceed 200 με, indicating that the seismic intensity has little effect on most of the measuring point. The reason may be that the strain of the tunnel lining has been in the process of elastic deformation and has not produced enough plastic deformation. Among them, the measuring points with greater response are the left tunnel arch, the left-hole shoulders and the top left of the mid-partition. The maximum value of the top left of the mid-partition reaches 885 με, which has caused damage, indicating that these places have weak seismic resistance.
The trend of the left tunnel is more obvious, there are three peaks, the trend of the right tunnel is relatively gentle, the strain values of the left and right arch shoulders are slightly larger. It shows that under different seismic waves, seismic wave excitation has a greater impact on the left tunnel and a smaller effect on the right tunnel. The reason may be that the left tunnel is covered with heavy soil and the surrounding rock pressure is high, while the right tunnel is weakened by the coupling of lining and slope, which reduces the effect of seismic waves. It shows that the dynamic strain response is greatly affected by the location and the surrounding rock pressure.
The tensile and compressive strains of the tunnel show an obvious symmetrical trend, indicating that the tunnel may always be in the tensile and compressive load cycle when it is in an earthquake state. The tensile strain is greater than the compressive strain, indicating that the lining is mainly affected by the tensile strain, but the tensile capacity of concrete is less than the compression capacity, indicating that the tunnel lining is more susceptible to earthquake disasters, so pay attention to enhancing the tensile strength of the lining.
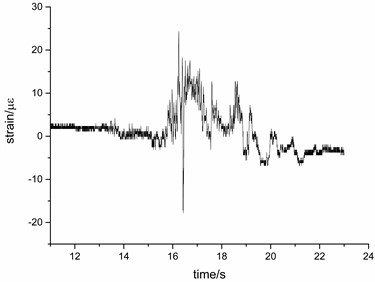
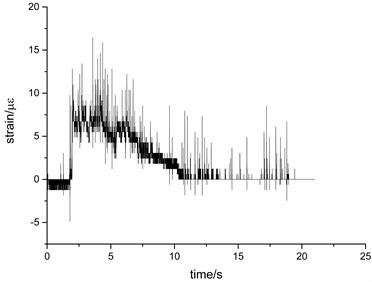
Figs. 12 and 13 are the time-history curves of the strain response of the measuring point 2 and the measuring point 12 when the seismic intensity is 0.6 g. It can be seen from the figure that under the seismic wave excitation, the strain values in three directions are not all returned to zero, the reason is that the measuring point has been permanently deformed after multiple seismic waves.
Fig. 12Time history curve of strain measurement point 2 under Kobe wave
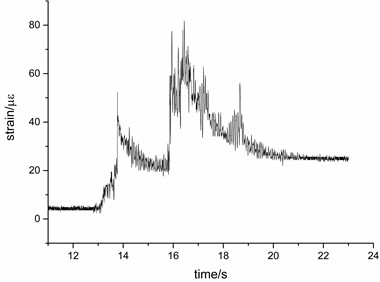
a)-time curve
b)-time curve
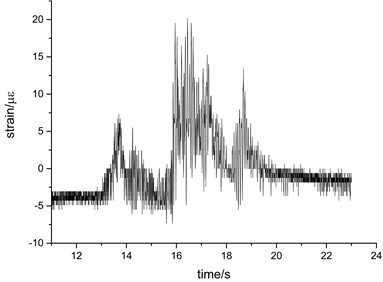
c)-time curve
4. Conclusions
1) Under different seismic wave excitations, only the left-hole vault, the righ-hole invert and the top right of the mid-partition have amplification factors less than 1, and the acceleration amplification factors of other measuring point are all greater than 1. The measuring points with large acceleration response include the left-holel shoulder, the top left of the mid-partition, the right-hole vault and the shoulder. These places are the unfavorable parts in the earthquake and should be specially fortified in the earthquake reduction and earthquake resistance.
2) The vertical acceleration response of the double-arched tunnel clearly appears in the left half-arch and the right half-arch. In the case where the left half-arch and the right half-arch are connected to each other by the mid-partition, the seismic wave is refracted and reflected at the connecting part to cause the superposition of the seismic wave, which causes the response of both sides to be amplified. The overall response of the left half-arch of the left tunnel is greater than the left half-arch of the left tunnel, and the overall response of the left half-arch of the right tunnel is greater than the right half-arch of the right tunnel. The measured points in the left half-arch of the left tunnel and the right half-arch of the right tunnel have small differences in acceleration response.
Fig. 13Time history curve of strain measurement point 12 under EI wave
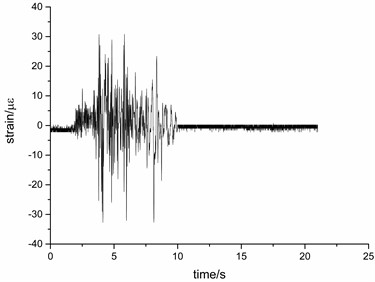
a)-time curve
b)-time curve
c)-time curve
3) The effect of Kobe wave on horizontal acceleration and vertical acceleration is greater than EI wave, and the average value of the vertical acceleration response of the lining is greater than the average value of the horizontal acceleration response. With the increase of seismic intensity, the larger the acceleration amplification factor is, the greater the increase is.
4) The dynamic strain response is greatly affected by the surrounding rock pressure. The left tunnel is covered with heavy soil and the surrounding rock pressure is greater, while the right tunnel is near the slope and the surrounding rock pressure is smaller. Under the action of different seismic waves, the seismic wave excitation has a greater impact on the dynamic strain response of the left tunnel, and the right tunnel has less impact. Among them, the strain value of the left-hole shoulder, left-hole invert and the top left of the mid-partition is much larger than the other measurement points, the trend of the right tunnel is relatively gentle, and the strain values of the left tunnel and right tunnel shoulders are slightly larger.
References
-
Gao Bo, Wang Zhengzheng, Yuan Song, et al. Lessons learnt from damage of highway tunnels in Weng Chuang earthquake. Journal of Southwest Jiao Tong University, Vol. 44, Issue 3, 2009, p. 336-341+374.
-
Li Tianbin Failure character ist ics and influence factor analysis of mountain tunnels at epicenter zones of great Wen Chuang earthquake. Journal of Engineering Geology, Vol. 16, Issue 6, 2008, p. 742-750.
-
W. L., Wang T. T., Wang J. J., et al. Assessment of damage in mountain tunnels due to the Taiwan Chi-Chi Earthquake. Pergamon, Vol. 16, Issue 3, 2001, p. 133-150.
-
Yang Xiaoli, Zhang Bingqiang, Wang Zhibin, et al. Earthquake response of large span and double-arch shallow tunnel. Journal of Central South University (Science and Technology), Vol. 37, Issue 5, 2006, p. 991-996.
-
Huang Ming Study on seismic dynamic response of shallow double-hole tunnels. Ph.D. Thesis, Southwest Jiaotong University, 2009, (in Chinese).
-
Wang Zhengzheng, Wang Zhengsong, Gao Bo Research on seismic measures of double-arch tunnel potalsim high-intensity earthquake zone. China Journal of Highway and Transport, Vol. 24, Issue 6, 2011, p. 80-85.
-
Wang Zhengsong Study on Seismic Dynamic Response and Vibration Absorbing Measures for Portal of Double-Arch Tunnel. Master’s Thesis, Southwest Jiaotong University, 2008, (in Chinese).
-
Ling Yanting, Gao Bo, Zheng Shangfen Dynamic seismic responses of a double-arch tunnel in high-intensity earthquake region. China Journal of Modern Tunnelling Technology, Vol. 45, Issue 6, 2008, p. 11-15.
-
Guangyao Cui, Hao Su, Yang Zhang A Seismatic analysis on low-burying twin-arch double-deck urban tunnel. International Conference of Logistics Engineering and Management, 2010, p. 1314-1319.
-
Kim D. S., Konagai K. Seismic isolation effect of a tunnel covered with coating material. Tunnelling and Underground Space Technology Incorporating Trenchless Technology Research, Vol. 15, Issue 4, 2000, p. 437-443.
-
Meymand P. J. Shaking Table Scale Model Tests of Nonlinear Soil-Pile-Superstructure Interaction in Soft Clay. University of California, Berkeley, 1998.
-
Iai S. Similitude for shaking table tests on soil-structure-fluid model in 1 gravitational field. Soils and Foundations, Vol. 29, Issue 1, 1989, p. 105-108.
-
Yang Linde, Ji Qianqian, Zheng Yonglai, et al. Shaking table test on metro station structures in soft soil. Modern Tunnelling Technology, Vol. 40, Issue 1, 2003, p. 7-11.
-
Chen Guoxing, Zhuang Haiyang, Du Xiu Li, et al. A large-scale shaking table test for dynamic soil-metro tunnel interaction: analysis of test result. Journal of Earthquake Engineering and Engineering Vibration, Vol. 27, Issue 1, 2007, p. 164-170.
-
The National Standards Compilation Group of People’s Republic of China. Code for seismic design of buildings (GB50011-2010). Beijing: China Architecture and Building Press, 2010. (in Chinese).
-
The National Standards Compilation Group of People’s Republic of China. Code for seismic design of railway engineering (GB50011-2006). China Planning Press, Bejjing, 2009, (in Chinese).
-
Wu Yungduan A graphical method of stress analysis strain rosette. Journal of Nanjing University of Aeronautics and Astronautics, Vol. 1, Issue 1, 1980, p. 128-150.
About this article

This work was supported by the National Natural Science Foundation of China (Grant Nos. 51204125, 51404309); The Hunan Provincial Natural Science Foundation of China (Grant Nos. 2018JJ3882, 2020JJ4944).
