Abstract
This paper describes the seismic performance of a steel frame with additional LYP steel dampers. LYP steel dampers provides passive energy dissipation device in a structure, it also reduces the lateral forces in efficient way which is produced by seismic wave. The seismic performance of structures is needed in the design of structure, especially in countries where seismic activities occur. This analysis is accomplished with the FEM and software called SAP2000. The steel frame is only analyzed using numerical simulation. This paper describes two steel frames, the first steel frame is a two story steel frame without LYP steel dampers while the second steel frame has with LYP steel dampers. The seismic mechanism analysis was accomplished with the help of nonlinear time history analysis technique and the results for inter-story drift, steel frames, base shear, the displacement of the top story and the stress of the dampers was obtained. The time history analysis was taken out with three different earthquake waves according to the Chinese code for the seismic design of buildings; the earthquake waves were divided into the three different earthquake levels in China which include the frequent, moderate and rare earthquake level. The seismic mechanism analysis was accomplished on the three different earthquakes and three different earthquake levels in China. The modal analysis was taken to obtain the frequency and the period of the steel frames. The steel frames were examined under the different load combination which is also described in the code for the seismic design of buildings to obtain the internal forces of the members of the steel frame which include the axial force, shear force and bending moment. The different load combinations are used to get the stress of the dampers. We notice that the addition of LYP steel dampers increases the seismic resistance of the steel frame as we can observe by a reduction in the displacement of the top story, base shear, and inter-story drift angle by the addition of LYP steel dampers on the steel frame. We can be able to observe the behavior of the frames under the different earthquake levels in China using the pushover analysis.
1. Introduction
Earthquakes have always been taken into consideration when constructing an engineering structure, other branches of civil engineering have sprung up to study the effects of earthquakes, and the best possible ways to prevent structural failure. The effects of an earthquake on a structure can cause loss of lives and investments, an expensive engineering structure can be destroyed in an instant because of the occurrence of an earthquake, so engineers need to make the structures resistant to earthquakes and other natural forces to prevent loss of investments and lives. In seismic structures upgrading, one of the lateral force reduction caused by the earthquake is the use of dampers. During an earthquake, high energy is applied to the structure. This energy is applied in two types of kinetic and potential (strain) to the structure and it is absorbed or amortized [1].
Structural seismic control is to change or adjust the dynamic characteristic or dynamic action by installing devices (such as a seismic isolation bearing), some mechanisms (such as energy-dissipation braces and joints, fluid viscous damper, and metallic damper), some substructure (such as tuned mass damper), or external force (such as external energy input) in a certain part of structure [2]. These devices, which require no additional energy to operate, generate a control force or provide improved energy dissipation in structural systems [3]. The passive energy dissipation devices are also special structural elements that when incorporated into a structure absorb or consume a portion of the input energy [4].
By using plastic hysteresis deformation of different forms of metals to dissipate energy, low-yield-point metal damper has superior hysteretic characteristics and absorbs a large amount of energy in the process of plastic hysteresis. Thus, it is used as energy-dissipation dampers in civil engineering with diverse types [2]. The principal types of damper currently available on the market are Elastomeric Visco-Elastic Dampers (EVED), Fluid Viscous Dampers (FVD), Steel Hysteretic Dampers (SHD) and Friction Dampers (FD) [5]. Heysami [1] investigated the various types of dampers and their performance and concluded that dampers have a satisfactory level of seismic resistance. The input energy caused by an earthquake on a structure with additional damper is:
where is the earthquake input energy, is the kinetic energy, is reversible strain energy in the elastic range, is the amount of wasted energy due to inelastic deformation and is the amount of amortized energy due to the additional damper. The paper also shows that the dampers have reduced construction limitations in multi-story buildings. Haoxiang He [2] proposed a combined low-yield-point steel plate damper involving low-yield-point steel plates and common steel plates, the “maximum stiffness” and “full stress state” are used as the optimization objectives, and the topology optimization of different hollow forms by alternating optimization method is to obtain the optimal shape. Bairrao [6] analyzed how the LNEC 3D earthquake simulator can be used as a means for which to carry out tests for checking the seismic performance of structures, the paper talks about the advantages of the LNEC 3D simulator. Wenguang Liu [7] Hamed Kalili [8] analyzed the seismic performance of an isolated museum structure in high earthquake intensity region using a shaking table test with and without base isolators. The scaled down model was used in the shaking table test and analysed by using ANSYS software. Bahador Bagheri [15] proposed a new kind of hysteretic damper device which provides relatively high initial stiffness, stable hysteresis with the limited but controlled yield strength in different stories in order to have equal plastic deformation in high intensity of ground motion, and excellent energy dissipation capabilities. Hye-Min Shin [16] studied the performances of various seismic reinforcement systems. Yasunari W. [17] investigated the advantages of using high strength steel and hysteric dampers for low and medium rise buildings using the time history analysis. X. Yan [18] investigated the shaking table tests and nonlinear analysis of a six-story steel frame structure model with and without oval steel-lead damper were performed and compared.
T. Takeuchi [9] proposed on-uplifting spine frame system with energy-dissipating members without post-tensioned strands. Gennaro [10] analyzed how shaking table tests are performed in order to investigate the seismic behaviour of plasterboard continuous suspended ceilings under strong earthquakes. Chaofeng Zhang [11] studied the superplastic property and the maximum energy dissipation capacity per unit mass of low-yield-strength steel (LYS) are investigated via comparison with those of several common metallic damping materials. Chen Xingchen [12] proposed a controlled spine frame system consisting of an elastic moment frame. Zhiguo Shi [13] researched about how eddy-current-based tuned mass dampers (ECTMDs) have been developed to cope with problems which other kind of dampers like viscous dampers, the ECTMDs have been able to deal with these problems which other kind of dampers have. Junfeng Jie [14] the hysteretic behavior of the novel rhombic steel plate dampers made of three types of steel was investigated by testing and finite element method with ABAQUS.
Antonio Di Cesare [19] analyzed experimental tests and parametric nonlinear time history analysis have been carried out changing the characteristics of the hysteric dampers stiffness and strength. Huang Li-Jeng [20] analyzed the finite element seismic response simulation of a typical tower crane frame using SAP2000. Vittoria Mazzotta [21] presents the design and verification steps of tall steel frame structures with braced core, belt and outrigger trusses. P. Pinot [22] the numerical simulation method is used to design dampers with the MATLAB software, with the information gotten from the simulation, they were able to make the damper as efficient as possible. Effy Hidayaty [23] this article will present an analytical model of the viscous wall damper. Hector Guerrero [24] studied the effects of Buckling-Restrained Braces (BRBs) on precast, reinforced concrete (RC) models using the shaking table test. M. Chandravanshi [25] explained how to get the dynamic characteristics of structures using modal analysis experimentally and theoretically using ANSYS. Vosoughifar [26] explained how an 18-story structure was modeled using the proper Finite Element software with different types of bracings which includes Unbonded Braced Frame (UBF), Eccentrically Braced Frame (EBF) and Concentrically Braced Frame (CBF) systems. W. Sean [27] showed how a non-linear plane frame model is presented that is capable of analyzing high-rise buildings subjected to earthquake forces, time-history analysis and pushover analysis. B. Saman [28] studied the bracing member stiffness to the damper devise stiffness (B/D) using SAP2000 to determine the optimum use of dampers. J. Zhou [29] this paper presents the contents of inter-story drift as well as calculation methods for harmful and harmless inter-story drift, the paper presents the secant method, improved secant method, the tangent method and the fixing floor method. This study used the improved secant method. X. HuanHuan [30] analyses the drift angle of two types of structural systems which are steel frame and steel-support frame, they are grouped into different types of steel frame and steel-support frame groups and they are compared to the drift angle limit in different countries limit and their performance level according to the drift angle limits are found.
2. Materials and methods
2.1. Modelling of the steel frame
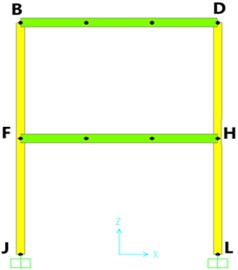
A two-story steel frame is designed as shown in Fig. 1, and another two-story steel frame is designed with V-shaped bracing equipped with the LYP steel dampers as shown in Fig. 2.
Fig. 1Steel frame model
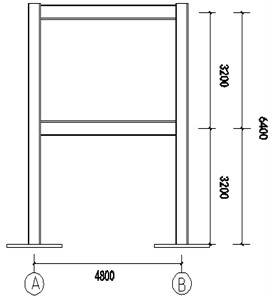
Fig. 2Steel frame model with LYP
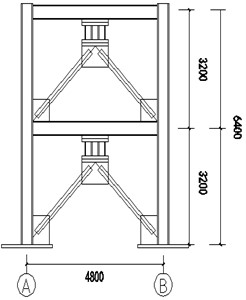
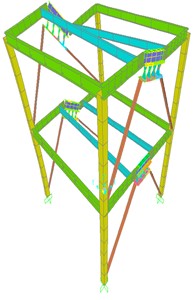
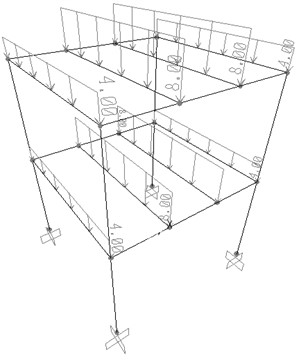
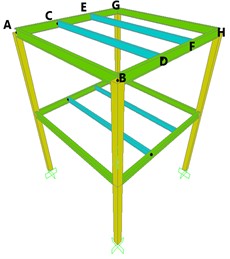
The units used in the modelling of the steel frame are in millimeters. The height of each floor is 3200 mm and the length of the span 4800 mm. The steel frames were designed according to the guidelines as stated in the Chinese code for the standard for design of steel structures GB50017-2017 [39]. The height of each floor is 3200 mm and the total height of the overall floors is 6400 mm, the building is a square shaped building with a span of 4800 mm in the model used in SAP2000. The columns are fixed to the foundation with the nuts and bolts, the joints between the beams and columns are joined together with a combination of welding and nuts and bolts. The brace may be assumed to the pin-connection at the end. Table 1 shows the detailed components that were used in designing the steel frame. The 3D view of two-story steel frame is designed as shown in Fig. 3(a) and another two-story steel frame is designed with V-shaped bracing equipped with the LYP steel dampers as shown in Fig. 3(b).
Fig. 3Steel frame a) without LYP steel dampers, b) with LYP steel dampers
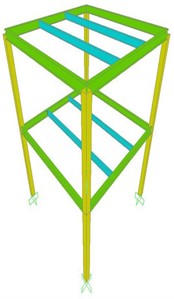
a)
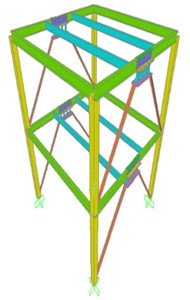
b)
2.2. Properties of materials
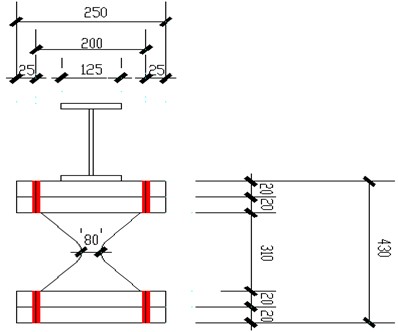
Table 1 and Table 2 describe the mechanical properties of the materials used in constructing of the steel frames. The materials include the Q235B steel and the LYP steel dampers show in Table 2. The damper used LYP100. The properties of the LYP 100 steel are shown in Table 3. The diagram of the LYP steel damper is shown in Fig. 4.
Table 1detailed of components used in the steel frame
Column | Main beam | Secondary beam | Brace |
Tube | I/wide flange | I/wide flange | Double angle |
 | 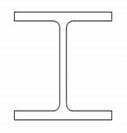 |  |  |
200×200×8 | H×250×125×5×8 | H×200×100×4.5×6 | 63×132 |
Table 2Properties of Q235 steel
Steel grade | Quality | Yield strength (≥ N/mm2) | Tensile strength ( ) | Elongation (≥ %) | |||||||||
Thickness (Ø mm) | Thickness (Ø mm) | ||||||||||||
Ø ≤ 16 | 16<Ø ≤ 40 | 40 < Ø ≤60 | 60 < Ø ≤ 100 | 100 < Ø ≤ 150 | 150 < Ø ≤ 200 | Ø ≤ 40 | 40 < Ø ≤60 | 60 < Ø ≤ 100 | 100 < Ø ≤ 150 | 150 < Ø ≤ 200 | |||
Q235 | Q235A | 235 | 225 | 215 | 205 | 195 | 185 | 370 - 500 | 26 | 25 | 24 | 22 | 21 |
Q235B | |||||||||||||
Q235C | |||||||||||||
Q235D | |||||||||||||
Table 3Properties of LYP100 steel damper
Damper | Yield strength (MPa) | Ultimate strength (MPa) | Elongation (%) | Yield ratio (%) | Charpy impact work (J) |
LYP100 | 80-120 | 200-300 | ≥ 50 | ≤ 60 | ≥ 27 |
Fig. 4Model of the LYP steel damper
3. Seismic mechanism analysis
The seismic mechanism analysis is the important part of this paper for its simulation. We determined the behavior of structural members under seismic forces. The two-story steel frame structure is used in this reach which is located in Nanjing, China. The earthquake design region should be determined before designing the structure.
3.1. Modal analysis
Modal analysis is a powerful tool used to identify the dynamic characteristics of structures. Every structure vibrates with high amplitude of vibration at its resonant frequency [25]. Natural time periods or natural frequencies are the important characteristics of a structure [26].
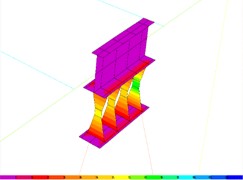
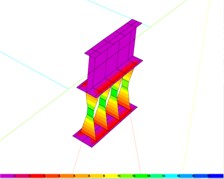
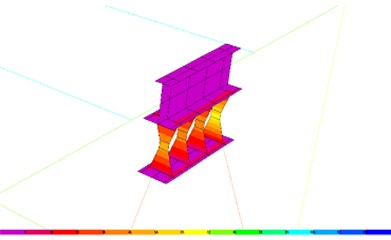
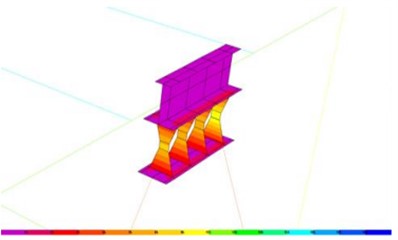
In reality, the number of natural modes of a building is infinity. But for engineering purposes, the number of modes is finite [40]. The steel frame without LYP steel dampers has a total of 12 modes in the SAP2000 software. To get the effect of adding LYP steel damper to the steel frame, we would study the second mode at the horizontal or direction, since the LYP steel dampers were added along this direction. Fig. 5 shows the second mode shape or deformation of the steel frame without LYP steel dampers and with LYP steel damper. Table 4 and 5 shows the respective period and frequency of the second mode of the steel frame without LYP steel damper. The steel frame with LYP steel dampers have 12 modes in the SAP2000 software as well, we would study the second mode as well since it shows the effects of adding LYP steel dampers to the steel frame. Fig. 6 shows the second mode shape or deformation of the steel frame with LYP steel dampers.
Table 4Period and frequency of the steel frame without LYP steel damper
Mode number | Period (sec) | Frequency (Hz) |
2 | 0.608 | 1.645 |
Table 5Period and frequency of the steel frame with LYP steel damper
Mode number | Period (sec) | Frequency (Hz) |
2 | 0.602 | 1.661 |
Fig. 5Mode 2 deformation of the steel frame without LYP Steel dampers
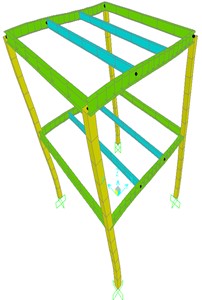
Fig. 6Mode 2 deformation of the steel frame with LYP steel dampers
3.1.1. Period
We can observe that the steel frame without LYP steel dampers has a higher period compared to the steel frame with LYP steel dampers. With the introduction of the LYP steel damper, there is a reduction in the period because the damper increases the stiffness of the steel frame. This shows that the addition of LYP steel dampers reduces the seismic response on the steel frame. Fig. 7 shows the periods of two steel frames.
Fig. 7Period of the two steel frames
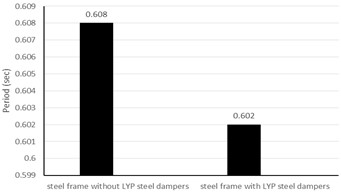
Fig. 8Frequency of the two steel frames
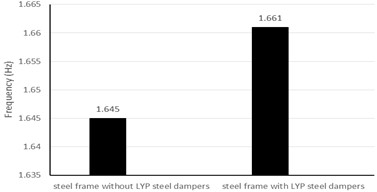
3.1.2. Frequency
The frequency is inversely proportional to the period, so lower periods would generally have higher frequencies and vice versa. So the steel frame with LYP steel dampers will have a larger frequency compared to the steel frame without LYP steel dampers. The chart comparing the two different steel frames is shown in Fig. 8.
4. Rustles
4.1. Nonlinear dynamic time history analysis
Analysis describes three earthquake levels in China, which are called frequent, moderate and rare 8 earthquake level. The fortification intensity of 8 is used with PGA of 70 cm/s2 or 0.07 g in frequent earthquake, 200 cm/s2 or 0.2 g in moderate earthquake and 0.4 g in rare earthquake as stated in the CCFSDB show in Table 6. Buildings which covers the zone of fortification intensity 6 or more is designed in such a way to resist earthquake effects. The seismic category of the structure is category D [41]. The three different earthquake levels frequent, moderate and rare earthquake. We assumed that there were dead and live load acting on the steel frame. We assumed that the dead load has a value of 2 kN/m2 on the side beams and 4 kN/m2 on the middle or secondary beams while the live load has a value of 4 kN/m2 on the side beams and 8 kN/m2 on the middle beams or secondary beams. Dead load and live load values remain unchanged on both floors. Fig. 9 and Fig. 10 shows the dead and live load acting on the frame respectively.
Table 6Maximum values for the seismic acceleration of ground motion used for time-history analysis
Seismic action | Intensity 8 (cm/s2) |
Frequent earthquake | 70 (110) |
Moderate earthquake | 200 (300) |
Rare earthquake | 400 (510) |
Fig. 9Dead load acting on the steel frame model (unit: kN/m)
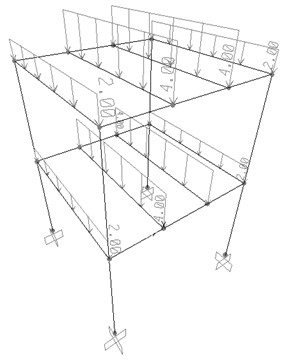
Fig. 10Live load acting on the steel frame model (unit: kN/m)
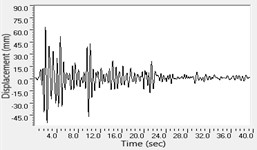
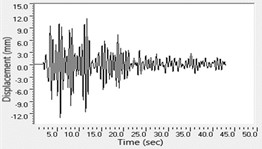
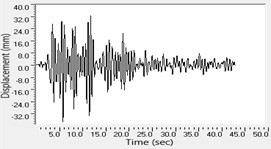
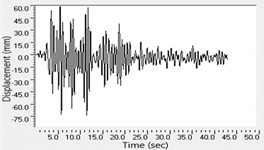
Nonlinear analysis involves the Time history analysis of the structure. Time history analysis is used to determine the seismic response of a structure under dynamic load of representative earthquake [27]. Nonlinear dynamic analyses were performed on the models subjected to selected ground motions time histories [28]. When the time history method is adopted in the analysis, at least 2 sets of strong earthquake records and 1 set of acceleration time-history curve shall be selected based on the intensity, the design seismic group and site class [29]. The selected seismic waves used were the El Centro, Taft and an artificial earthquake records. The El Centro and Taft wave records were found from the PEER ground motion database. 5 percent damping ratio is assumed. The Artificial earthquake record is defined by accelerograms which is compatible with a design spectrum and their response spectra will be equal to the target spectrum. The El Centro earthquake occurred in United States of America on 18th May, 1940 with moment magnitude of 6.9 and Mercalli intensity scale. The Taft earthquake occurred in the southern San Joaquin Valley on July 21st, 1952, it measured 7.3 on the moment magnitude scale. The Artificial earthquake record has a maximum acceleration of 325 cm/s2.
4.1.1. Amplitude adjustment for earthquake waves
As stated in the CCFSDB maximum acceleration should be adopted for different seismic waves in the time history analysis. The maximum acceleration of the three types of earthquake level in China (i.e. frequent, moderate and rare) under fortification intensity of 8 is shown in Table 6. Eq. (2) is used to change the earthquake record maximum acceleration, time-history graph under their respective seismic levels:
where is the adjusted seismic acceleration graph, is the maximum value of acceleration in the time-history graph under different seismic intensity as stated in the code for the sdob, defines the original seismic record. Time-history graph of the three different seismic intensity levels as stated in the code for the seismic design of buildings.
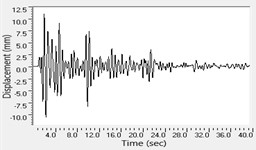
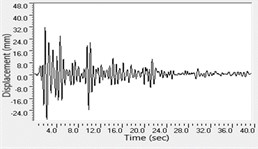
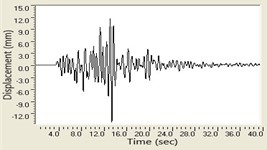
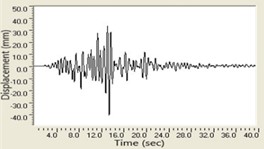
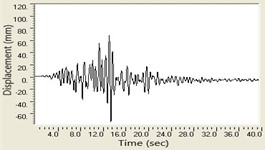
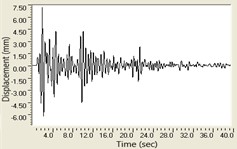
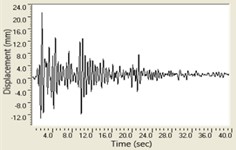
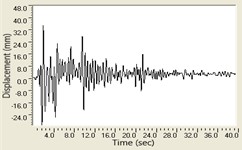
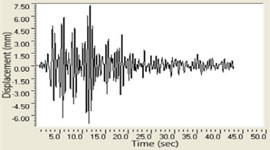
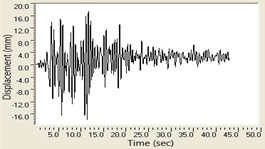
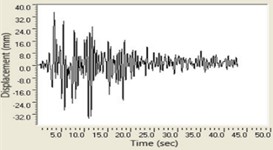
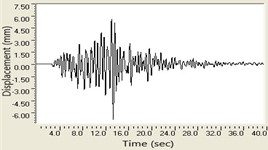
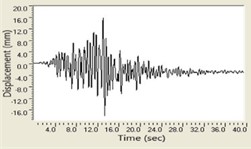
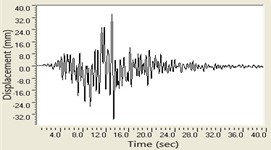
Note: values in the bracket are used that the design basic acceleration of ground motion is 0.15 g and 0.30 g respectively. The representative seismic waves and corresponding frequency spectra of PGA = 300 gal as an example of these three ground records are shown in Fig. 11 and Fig. 12. The dominant frequencies of adopted El Centro and Taft earthquake waves are 1.82 Hz and 1.72 Hz, respectively. Under the seismic mechanism analysis, we should try and find the stress distribution, top story displacement, inter-story drift, and base shear, frame’s forces and the damper’s stress. First steel frame without steel dampers is analyzed and the results are studied. The structure was modelled using the SAP2000 software.
Fig. 11Loading earthquake waves
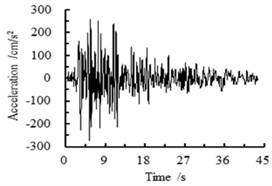
a) El Centro wave
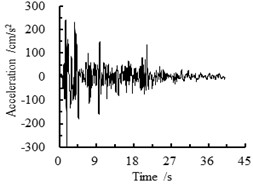
b) Taft wave
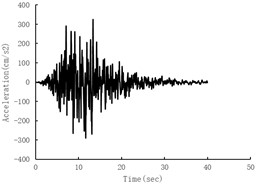
c) Artificial wave
Fig. 12Corresponding frequency spectra
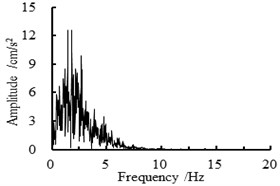
a) El Centro wave
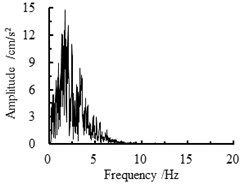
b) Taft wave
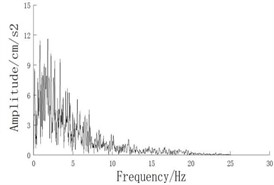
c) Artificial wave
4.2. Nonlinear dynamic time history analysis results of the two steel frames under the three earthquake levels
This section shows the results obtained from the time history analysis of the three seismic waves (El Centro, Taft and Artificial) under the three earthquake levels (frequent, moderate and rare).
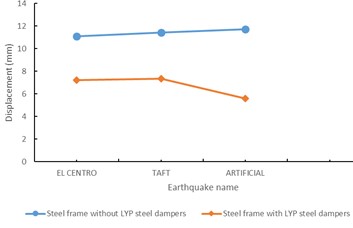
4.2.1. Displacement of the top story
Top story displacement is obtained for the respective earthquake waves. Time displacement graph is shown in Fig. 13 and 14 of the respective earthquake waves for both steel frames. The algorithm for computing the time history analysis is the HHT method. The HHT method or alpha method is used in the structural dynamics for the numerical integration of a linear set of second ODE. The SAP2000 software would use the HHT method in performing the time history analysis. The maximum displacement in the steel structure without LYP steel dampers top story for the different earthquake waves under the three different earthquake levels are shown in Fig. 13. Table 7 shows the maximum displacement values of the structure without LYP steel dampers in the horizontal direction or direction.
Fig. 13Displacement of earthquake waves under the three earthquake levels for the steel frame without LYP steel dampers
a) El Centro frequent
b) El Centro moderate
c) El Centro rare
d) Taft frequent
e) Taft moderate
f) Taft rare
g) Artificial frequent
h) Artificial moderate
i) Artificial rare
Fig. 14Displacement of earthquake waves under the three earthquake levels for the steel frame with LYP steel dampers
a) El Centro frequent
b) El Centro moderate
c) El Centro rare
d) Taft frequent
e) Taft moderate
f) Taft rare
g) Artificial frequent
h) Artificial moderate
i) Artificial rare
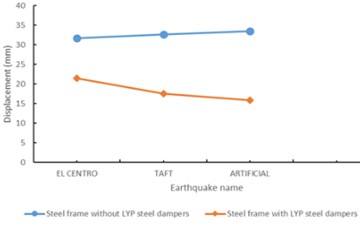
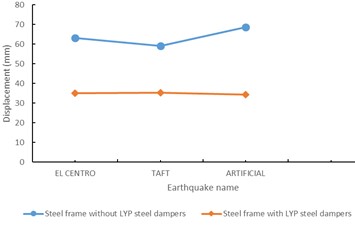
The steel frame with LYP steel dampers was also analyzed, the maximum displacement in the steel structure with LYP steel dampers top story is obtained and the displacement of the respective earthquake waves under the three earthquake levels are shown below in Fig. 14. Table 8 shows the maximum displacement values of the steel frame with LYP steel dampers in the horizontal direction. We can observe that with the addition of LYP steel dampers, top story’s displacement reduction is observed in frequent, moderate and rare earthquake. This conforms to the fact that the addition of and Artificial waves under the three earthquake levels respectively. The Artificial earthquake wave produces less seismic influence on the steel frame when compared to the other earthquake waves. The maximum displacements of the top story of the two steel frames under the three earthquake ground motions are shown in Fig. 15.
Fig. 15Maximum displacement of earthquake waves under the three earthquake levels
a) Top story frequent earthquake level
b) Top story moderate earthquake level
c) Top story rare earthquake level
The LYP steel dampers reduce the seismic response of the steel frame. Frequent type earthquake produces lower displacements on the structures as compared to the rare earthquake, this shows that the rare earthquake produces more seismic force on the structure. The maximum displacement in the top story is reduced by 62.8 %, 59.3 % and 48.4 % in the El Centro, Taft and Artificial waves under the three earthquake levels respectively.
Table 7Maximum displacement values of the steel frame without LYP steel dampers in the horizontal direction
Earthquake level | El Centro (mm) | Taft (mm) | Artificial (mm) |
Frequent earthquakes | 11.08 | 11.44 | 11.74 |
Moderate earthquakes | 31.65 | 32.68 | 33.51 |
Rare earthquakes | 63.25 | 59.12 | 68.59 |
Table 8Maximum displacement values of the steel frame with LYP steel dampers in the horizontal direction
Earthquake level | El Centro (mm) | Taft (mm) | Artificial (mm) |
Frequent earthquakes | 7.24 | 7.36 | 5.61 |
Moderate earthquakes | 21.43 | 17.55 | 15.82 |
Rare earthquakes | 34.97 | 35.25 | 34.42 |
4.2.2. Inter-story drift angle
Inter-story drift is an important indicator of structural behavior in performance-based seismic analysis; inter-story drift is one of the particularly useful engineering response quantity and indicator of structural behavior especially for high-rise buildings [29]. Story drift angle is one of the main indexes to test the seismic performance of building structures [30]. The steel frame examined in this study is a two-story steel frame-structure. The frame that is being studied here is not a high-rise structure but it is necessary to study the inter-story drift to get a better understanding of the structural behavior of the structure show in Fig. 16.
Fig. 16Inter-story drift on the structure
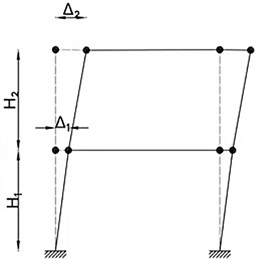
Inter-story drift is an important indicator of structural behavior in performance-based seismic analysis; inter-story drift is one of the particularly useful engineering response quantity and indicator of structural behavior especially for high-rise buildings [29]. Story drift angle is one of the main indexes to test the seismic performance of building structures [30]. The steel frame examined in this thesis is a two-story steel frame-structure. The frame that is being studied here is not a high-rise structure but it is necessary to study the inter-story drift to get a better understanding of the structural behavior of the structure.
First floor’s Inter-story drift angle is defined as:
Second floor’s Inter-story drift angle is defined as:
where – inter-story drift angle; – displacement, – floor height.
Table 9 shows the inter-story drift angle for the steel frame without LYP steel damper and their respective earthquake waves.
Table 9Inter-story drift angle values of the steel frame without LYP steel dampers (Source: Author’s own calculations Trough Sap2000)
Floor | El Centro frequent (rad) | El Centro moderate (rad) | El Centro rare (rad) | Taft frequent (rad) | Taft moderate (rad) | Taft rare (rad) | Artificial earthquake frequent (rad) | Artificial earthquake moderate (rad) | Artificial earthquake rare (rad) |
First floor () | 0.001366 | 0.004230 | 0.008467 | 0.001557 | 0.004470 | 0.008480 | 0.001684 | 0.004832 | 0.009844 |
Second floor () | 0.001985 | 0.005659 | 0.011300 | 0.002018 | 0.005743 | 0.009995 | 0.001984 | 0.005640 | 0.011592 |
Table 10Inter-story drift angle values of the steel frame with LYP steel damper (Source: Author’s own calculations Trough Sap2000)
floor | El Centro frequent (rad) | El Centro moderate (rad) | El Centro rare (rad) | Taft frequent (rad) | Taft moderate (rad) | Taft rare (rad) | Artificial earthquake frequent (rad) | Artificial earthquake moderate (rad) | Artificial earthquake rare (rad) |
First floor () | 0.000657 | 0.001772 | 0.002559 | 0.000746 | 0.002284 | 0.004326 | 0.000534 | 0.001410 | 0.003514 |
Second floor () | 0.001604 | 0.004926 | 0.008369 | 0.001552 | 0.003199 | 0.006689 | 0.001218 | 0.003534 | 0.007244 |
The floor height of each floor is 3200 mm.
1) For El Centro earthquake wave.
2) For Taft earthquake wave.
3) For the Artificial earthquake wave.
4.2.3. Steel frame with LYP steel damper
We obtained the inter-story drift from Eqs. (3-4) for the steel frame with LYP steel dampers.
The floor height of each floor is 3200 mm.
1) For El Centro earthquake wave.
2) For Taft earthquake wave.
3) For the Artificial earthquake wave.
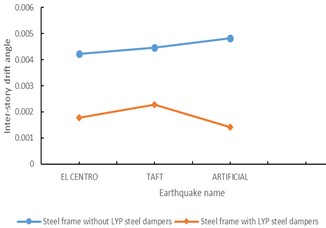
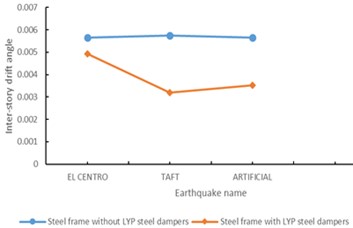
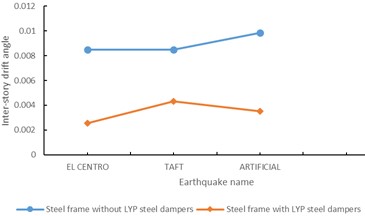
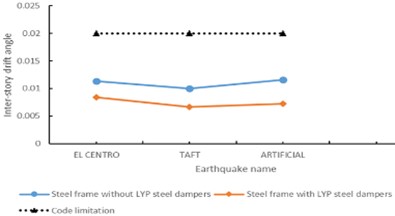
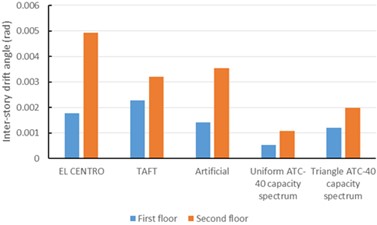
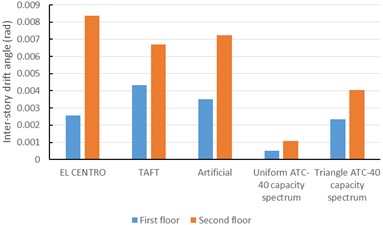
The maximum limit given in the China seismic codes is 1/250 = 0.004 under frequent earthquake and 1/50 = 0.02 under rare earthquake [41]. There is inter-story’s reduction in drift angle with LYP steel damper in the steel frame. The inter-story’s reduction drift in the second floor is studied. Inter-story drift’s reduction in the frequent earthquake type 81 %, 77 % and 61 % in the El Centro, Taft and Artificial earthquake waves is observed by introducing the LYP steel dampers in the steel frame. we noticed a reduction in inter-story drift in the moderate earthquake level by 86 %, 56 % and 63 % in the El Centro, Taft and Artificial earthquake waves respectively by introducing the LYP steel dampers in the steel frame, we noticed inter-story’s reduction drift in the rare earthquake type by 74 %, 67 % and 62 % in the El Centro, Taft and Artificial earthquake waves by introducing the LYP steel dampers in the steel frame. This shows that with the introduction of LYP steel dampers, we can reduce the inter-story drift in the steel frame if the steel frame was a high-rise structure, we would be able to notice that the inter-story drift of the steel frame without LYP steel dampers would most likely have an inter-story drift greater than the maximum limit given in the China seismic codes, but since the steel frame being studied here is a two-story frame, we were not able to see the inter-story drift angle of the steel frame exceed the maximum limit. The distribution of the inter-story drift angle of the two steel frames under the three earthquake level is shown in Fig. 17.
Fig. 17Inter-story drift angle under the three earthquake levels
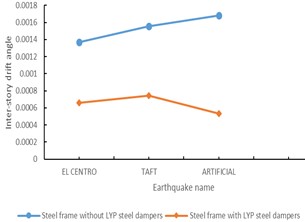
a) First floor frequent earthquake level

b) Second floor frequent earthquake level
c) First floor moderate earthquake level
d) Second floor moderate earthquake level
e) First floor rare earthquake level
f) Second floor rare earthquake level
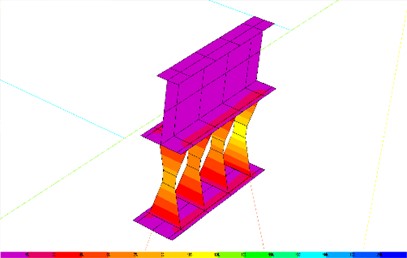
4.2.4. Stress of dampers
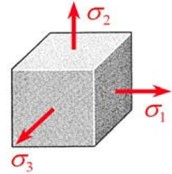
This section shows the stress in the LYP steel dampers, Von Mises stress is one of the dampers’ type stress. In order to determine whether given material is yield or fracture Von Mises stress value is used for its evaluation. Von Mises state of stress on a 3D object showing the principal in Fig. 18. In SAP2000 the von Mises stress provides a measure if the stress is shear, or distortional in the material. Eqs. (5, 6) shows the on Mises stress in 3D. The derivation of this form of the von Mises stress is based on the principal axes and arrives at the final result that is, of course, expressed in terms of the principal stresses , and [32] in Eq. (5):
The general form of the von Mises stress:
Fig. 18Von Mises state of stress on a 3D object showing the principal
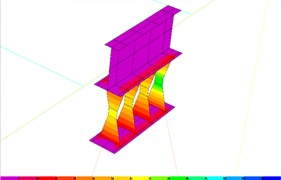
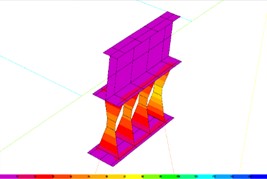
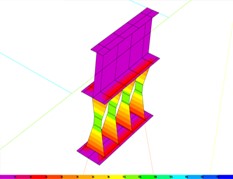
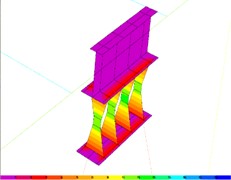
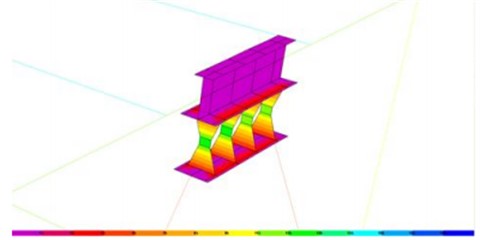
For the El Centro frequent, moderate and rare earthquake level the maximum stress in the LYP steel damper are 128.99 MPa, 209.69 MPa and 209.73 MPa respectively, we can observe that the stress are almost similar in all the LYP steel. The Taft frequent, moderate and rare earthquake level the values of the maximum stress in the LYP steel damper are 129.97 MPa, 209.51 MPa and 209.77 MPa. The maximum stress in the damper is 154.29 MPa for the artificial earthquake frequent level, the LYP steel damper on the right-hand side experience the greatest stress while stress in the middle area of the damper is greatest and the stress reduces as the dampers connects to both the top and bottom plates. This shows that the LYP steel dampers are good seismic energy dissipation agent. For the Artificial earthquake moderate level, all the LYP steel dampers are in the elastic-plastic stage and the maximum stress on the dampers is 209.62 MPa.
For the Artificial earthquake rare level, the maximum stress is 209.81 MPa, this shows that the energy dissipation of the LYP steel damper has a good effect on the steel frame. We can observe that the stress of the LYP steel dampers increases as the earthquake level increases, this shows that the LYP steel dampers are good energy dissipation agents.
Fig. 19Damper stress of the earthquake waves under the three earthquake levels for the steel frame with LYP steel dampers (Source: Author’s own calculations Trough Sap2000)
a) El Centro frequent
b) El Centro moderate
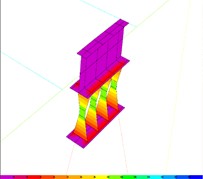
c) El Centro rare
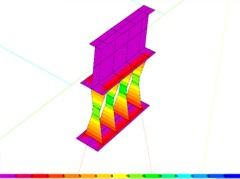
d) Taft frequent
e) Taft moderate
f) Taft rare
g) Artificial frequent
h) artificial moderate
i) Artificial rare
4.3. Internal force of members
Different loads can act on a structure at the same time, different load combinations should be evaluated to determine the structural capacity. With the help of stress distribution, we can obtain the values of the internal forces acting in the steel frame and stress in LYP steel dampers. The internal force depends on the external forces which are acting on the structure or frame. The loads that were considered in calculating the internal forces on the frame were:
1) Dead load (DL).
2) Live load (LL).
3) Earthquake load (Ek).
Different load combination are given below:
The acts in direction.
The research also describes the internal forces which act on the frame members. The axial force, shear force and bending moment are the types of internal forces. This paper also describes the internal forces of beams, columns and LYP steel dampers. Fig. 20 shows the column sections in the steel frame without LYP steel dampers and the steel frame with LYP steel dampers. In Fig. 21, sections AB and GH have the same internal forces or stresses acting on them, so we have taken section AB. Section CD and EF have the same internal forces or stresses acting on them, so we have taken section CD. Section AG and BH have different internal forces or stress acting on them, so we have chosen both of them. The sections are the same in the second and first floor. The internal force acting on the steel frame without LYP steel dampers is shown in Fig. 22 and the internal forces acting on the columns and beams are shown in Fig. 23.
Fig. 20Model of the steel frame showing the column sections
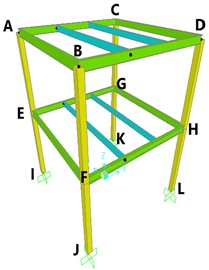
a) 3D view
b) Side view
Fig. 21Model of the steel frame the beam section
a) 3D view
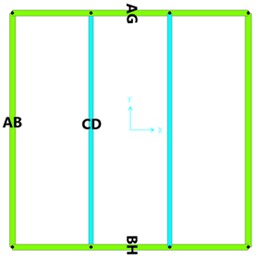
b) Top view
4.3.1. Axial force
An axial force is the tension or compression which acts on a frame or a member of a structure. Tensile forces are positive while compression forces are negative. We compared the axial forces in the members of the two different steel frames. The axial force acting on the beams of the steel frame without LYP steel dampers has greater force as compared to the steel frame without steel dampers. It conforms that LYP steel dampers reduces the internal forces acting on the members of the structure. The comparison of the axial force of both beam and column member of the two steel frames is shown in Fig. 24.
Fig. 22Combination 2 (1.2(DL + 0.5LL) + 1.3Ek) bending moment diagram of the steel structure without LYP dampers (Newton-mm)
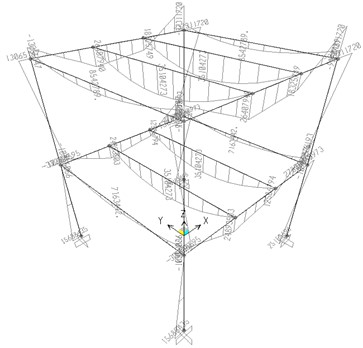
Fig. 23Combination 2 (1.2(DL + 0.5LL) + 1.3Ek) bending moment diagram of the steel structure with LYP dampers (Newton-mm)
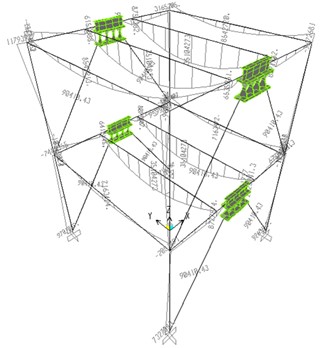
Fig. 24Maximum axial force of members
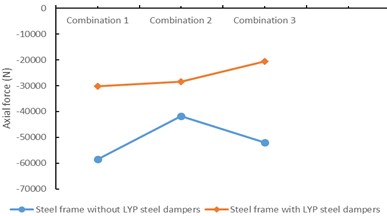
a) Column section AE
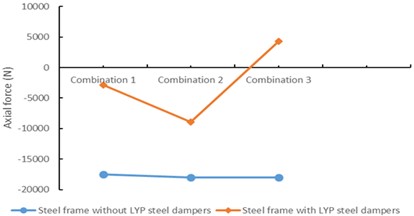
b) Beam section BH
Table 11Maximum Internal force values of columns of the steel frame without LYP steel dampers (Source: Author’s own calculations (Source: Author’s own calculations Trough Sap2000))
Floor | Section | Internal force combination | ||||||||
Combination 1 1.2DL + 1.4LL | Combination 2 1.2(DL + 0.5LL) + 1.3Ek | Combination 3 1.2(DL + 0.5LL) - 1.3Ek | ||||||||
Axial force (N) | Bending moment (N-mm) | Shear force (N) | Axial force (N) | Bending moment (N-mm) | Shear force (N) | Axial force (N) | Bending moment (N-mm) | Shear force (N) | ||
2 | AE | –58395.04 | 31684175.88 | –17467.65 | –41823.67 | 13065146.56 | –7423.04 | –51926.41 | 37311720.39 | –20349.98 |
BF | –58395.04 | 31684175.88 | –17467.65 | –41823.67 | 13065146.56 | –7423.04 | –51926.41 | 37311720.39 | –20349.98 | |
CG | –58395.04 | –31684176 | 17467.65 | –51926.41 | –37311720 | 20349.98 | –41823.67 | –13065146.6 | 7423.04 | |
DH | –58395.04 | –31684176 | 17467.65 | –51926.41 | –37311720 | 20349.98 | –41823.67` | –13065146.6 | 7423.04 | |
1 | EI | –116790.08 | 12033845.23 | –5621.32 | –81007.02 | 15688434.62 | 5006.86 | –106493.15 | –25155696 | –13944.58 |
FJ | –116790.08 | 12033845.23 | –5621.32 | –81007.02 | 15688434.62 | 5006.86 | –106493.15 | –25155696 | –13944.58 | |
GK | –116790.08 | –12033845.2 | 5621.32 | –106493.15 | 25155696.02 | 13944.58 | –81007.02 | –15688434.6 | –5006.86 | |
HL | –116790.08 | –12033845.2 | 5621.32 | –106493.15 | 25155696.02 | 13944.58 | –81007.02 | –15688434.6 | –5006.86 | |
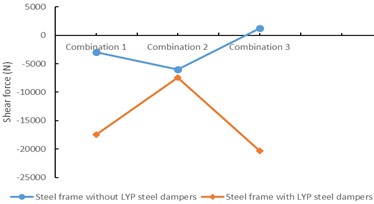
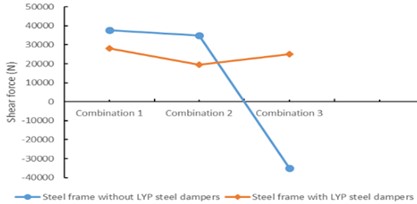
4.3.2. Shear force
Shear force acts on a member or frame in perpendicular or horizontal direction. For its design, the capacity to resist shear forces is important than to resist axial forces. In Fig. 25, we observed a reduction in the shear force in beam BH. It shows that the addition of the dampers increases the member’s resistance of the steel frame.
Table 12Maximum Internal force values of columns of the steel frame with LYP steel dampers (Source: Author’s own calculations Trough Sap2000)
Floor | Section | Internal force combination | ||||||||
Combination 1 1.2DL + 1.4LL | Combination 2 1.2(DL + 0.5LL) + 1.3Ek | Combination 3 1.2(DL + 0.5LL) – 1.3Ek | ||||||||
Axial force (N) | Bending moment (N–mm) | Shear force (N) | Axial force (N) | Bending moment (N–mm) | Shear force (N) | Axial force (N) | Bending moment (N–mm) | Shear force (N) | ||
2 | AE | –30253.85 | 5424415.82 | –2991.05 | –28409.4 | 11793926.69 | –6024.78 | –20605.82 | –3165205.03 | 1267.7 |
BF | –30214.56 | 5347740.64 | –2887.62 | –27199.6 | 9599847.25 | –2815.2 | –21752.89 | –6778864.46 | –1776.65 | |
CG | –30253.85 | –5424415.82 | –2991.05 | –20605.82 | 3165205.03 | –1267.7 | –28409.4 | –11793926.7 | 6024.78 | |
DH | –30214.56 | –5347740.64 | 2887.62 | –21752.89 | 6778864.46 | 1776.65 | –27199.6 | –9599847.25 | 2815.2 | |
1 | EI | –89629.58 | 2717053.21 | –1330.02 | –64308.8 | 9707058.78 | 2150.2 | –80110.45 | –12153282 | –4264.11 |
FJ | –87760.36 | 2202895.57 | –1069.24 | –60392.73 | 7327883.48 | 2931.05 | –81040.07 | –9263652.02 | –4629.27 | |
GK | –89629.58 | –2717053.21 | 1330.02 | –80110.45 | 12153282.02 | 4264.11 | –64308.8 | –9707058.78 | –2150.2 | |
HL | –87760.36 | –2202895.57 | 1069.24 | –81040.07 | 9263652.02 | 4629.27 | –60392.73 | –7327883.48 | –2931.05 | |
Table 13Maximum Internal force values of beams of the steel frame without LYP steel dampers (Source: Author’s own calculations Trough Sap2000)
Floor | Section | Internal force combination | ||||||||
Combination 1 1.2DL + 1.4LL | Combination 2 1.2(DL + 0.5LL) + 1.3Ek | Combination 3 1.2(DL + 0.5LL) – 1.3Ek | ||||||||
Axial force (N) | Bending moment (N-mm) | Shear force (N) | Axial force (N) | Bending moment (N-mm) | Shear force (N) | Axial force (N) | Bending moment (N-mm) | Shear force (N) | ||
2 | AB | –6611.59 | –12016411.2 | –18942.73 | –5271.31 | –9580489.06 | –15102.73 | –5271.31 | –9580489.06 | –15102.73 |
CD | –13.17 | 44320273.27 | 36933.56 | –10.50 | 35104273.27 | 29253.56 | –10.50 | 35104273.27 | 29253.56 | |
BH | –17467.65 | –31684176 | 37636.29 | –17984.30 | –37311720 | 35007.66 | –17984.30 | –37311720 | –35007.66 | |
AG | –17467.65 | –31684176 | –37636.29 | –17984.30 | –37311720 | 35007.66 | –17984.30 | –37311720 | –35007.66 | |
1 | AB | 4481.02 | –13746468.6 | –18942.73 | 3572.64 | –10959835.7 | –15102.73 | 3572.64 | –10959835.7 | –15102.73 |
CD | 11.97 | 44320273.27 | 36933.56 | 9.55 | 35104273.27 | 29253.56 | 9.55 | 35104273.27 | 29253.56 | |
BH | 11846.33 | –36246145 | 37636.29 | 11327.63 | –47275193 | 37647.99 | 11327.63 | –47275193 | –37647.99 | |
AG | 11846.33 | –36246145 | –37636.29 | 11327.63 | –47275193 | 37647.99 | 11327.63 | –47275193 | –37647.99 | |
Table 14Maximum Internal force values of beams of the steel frame with LYP steel dampers (Source: Author’s own calculations Trough Sap2000)
Floor | Section | Internal force combination | ||||||||
Combination 1 1.2DL + 1.4LL | Combination 2 1.2(DL + 0.5LL) + 1.3Ek | Combination 3 1.2(DL + 0.5LL) – 1.3Ek | ||||||||
Axial force (N) | Bending moment (N-mm) | Shear force (N) | Axial force (N) | Bending moment (N-mm) | Shear force (N) | Axial force (N) | Bending moment (N-mm) | Shear force (N) | ||
2 | AB | –6618.19 | –12016761.7 | –18942.89 | –5277.81 | –9671872.88 | 15140.86 | –5275.33 | –9672681.29 | –15141.12 |
CD | –6.53 | 44320273.27 | 36933.56 | –3.72 | 35104273.27 | 29353.56 | –6.70 | 35104273.27 | 29253.56 | |
BH | –2887.74 | 9406517.13 | 28044.78 | –8905.03 | –9599611.59 | 19501.45 | 4312.99 | 8391761.57 | 25024.67 | |
AG | –2990.94 | 9393208.91 | 28005.17 | –11858.29 | –11794162.3 | 18367.91 | 7101.40 | 8751382.02 | 26094.97 | |
1 | AB | 4484.09 | –13748029 | –18943.38 | 3596.60 | –11113374.1 | 15166.70 | 3553.60 | –11115830.6 | –15167.74 |
CD | 8.82 | 44320273.27 | 36933.56 | –47.41 | 35104273.27 | 29253.56 | 61.47 | 35104273.27 | 29253.56 | |
BH | 21877.41 | 6918524.84 | 29132.41 | 13154.57 | 8727873.88 | 25783.73 | 23564.24 | –12330068.1 | 20488.68 | |
AG | 21688.61 | 9143357.38 | 27261.56 | 12829.60 | –10313022.3 | 19132.96 | 23588.53 | 8098007.37 | 24150.40 | |
Fig. 25Maximum shear force of members
a) Shear force of column section AE
b) Beam section BH
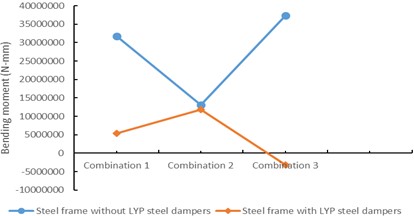
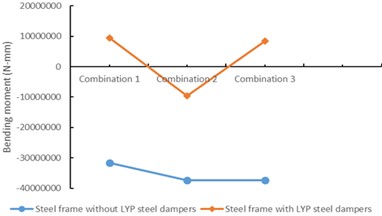
4.3.3. Bending moment
The reaction which is produced in a structural member when an external force is applied which cause some bending of the member, this phenomenon is known as bending moment. We can notice a reduction in the internal forces which acts on the steel frame with LYP steel dampers when it is compared to the steel frame without LYP steel dampers. This shows that the addition of LYP steel dampers causes a reduction in the bending. Fig. 26 describes the bending moments in the steel frame with LYP steel dampers are closer to the zero mark as compared to the steel frame without LYP steel dampers. It represents the introduction of dampers helps to reduce the bending moment in the members of the steel frame.
Fig. 26Maximum bending moment of members
a) Bending moment of column section AE
b) Bending moment of beam section BH
4.3.4. Stress of damper
We would use the three different load combinations to get the stress in the dampers of the steel frame with LYP steel dampers. This is to make sure we check for the design requirements of the steel frame with LYP steel dampers. From Fig. 27, the maximum stress in the damper for the combination 1 (1.2DL + 1.4LL) is 53.80 MPa, we notice that the two outer LYP steel dampers experience more stress compared to the two inner LYP steel dampers, the two outer LYP steel dampers are within the range of 17-35 MPa which is within the elastic-plastic stage and has begun to consume energy, the LYP steel dampers are used as a defense mechanism to prevent the steel frame from destruction. The maximum stress in Fig. 28 for combination 2 (1.2(DL + 0.5LL) + 1.3Ek) for the LYP steel dampers is 221.99 MPa.
Fig. 27Stress of dampers for Combination 1 (1.2DL + 1.4LL) (MPa)
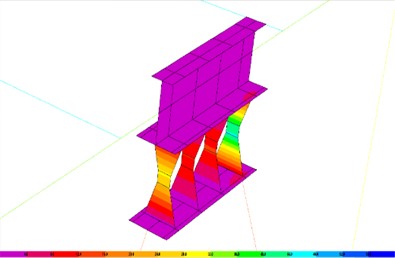
Fig. 28Stress of dampers for Combination 2 {1.2(DL + 0.5LL) + 1.3Ek}
4.4. Pushover analysis
Pushover analysis is a series of incremental static analysis carried out to develop a capacity curve for the building. This procedure needs the execution of a nonlinear static analysis of the structure that allows the monitoring of the progressive yielding of the structure component [33].
Pushover analysis produces a pushover curve or capacity curve that presents the relationship between the base shear and roof displacement. The Pushover curve depends on the strength and deformation capacities of the structure and describes how the structure behaves beyond the elastic limit [34].
Fig. 29Typical Load-deformation relation and target performance level
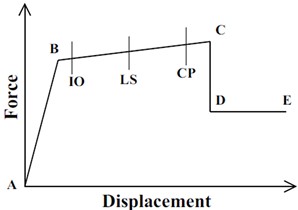
From Fig. 29, Point A corresponds to the unloaded condition. Load deformation relation shall be described by the linear response from A to an effective yield B. Then the stiffness reduces from point B to C. Point C has a resistance equal to the nominal strength then a sudden decrease in lateral load resistance to point D, the response at reduced resistance to E, final loss of resistance [34].
Where IO means immediate occupancy, LS means life safety and CP means collapse prevention.
The pushover analysis consists of the application of a representative lateral load patterns. We would apply two different lateral loads; the first load would be called uniform load and the second load is called triangle load. Uniform load has a value of 1000 N in both the first and second story while triangle load has a value of 2000 N in the second story and a value of 1000 N on the first story. The load application applies for both the steel frames without LYP steel dampers and the steel frame with LYP steel dampers. The diagram showing their application in the steel frame is shown in Fig. 30. The lateral loads were applied monotonically in a step-by-step nonlinear static analysis [35]. The total number of steps was 50.
Fig. 30Loads acting on the steel frame (N) (Source: Author’s own Figure Trough Sap2000)
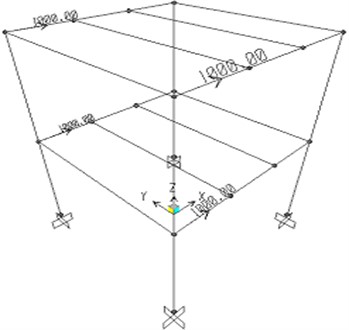
a) Uniform load
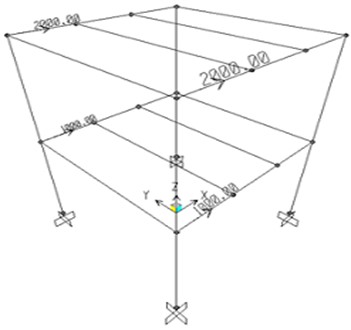
b) Triangle load
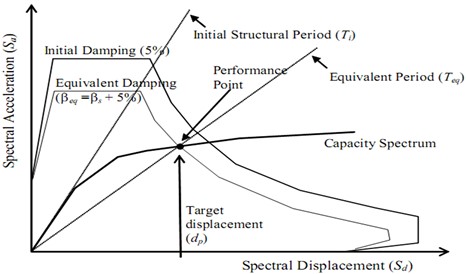
4.4.1. Capacity spectrum method (ATC-40)
The Capacity Spectrum Method (CSM) was developed by S. A. Freeman for frame buildings, its concept have been introduced in several United States guidelines for seismic evaluations such as ATC-40 and the NEHRP guidelines for the seismic rehabilitation of buildings [36] show in Fig. 31. In this method the maximum inelastic deformation of a nonlinear SDOF system can be approximated from the maximum deformation of a linear elastic SDOF system with an equivalent period and damping [37]:
Fig. 31Schematic representation of Capacity Spectrum Method (ATC-40)
4.5. The analysis results of the pushover method
4.5.1. The base shear displacement curve of the two structures
Using the base shear displacement curve, we are able to get the structural stiffness of both steel frames show in Fig. 32. This will help us understand how the LYP steel dampers affect the structural stiffness of the steel frame ATC-40.
Fig. 32Structural stiffness ATC-40
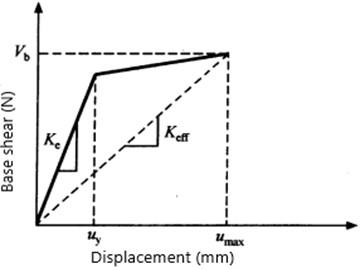
The structural stiffness is the slope of the pushover curve at the elastic stage. Structural stiffness gotten from the pushover curve formula is, we can get the structural stiffness of both steel frames:
where – base shear from point B to IO in the pushover curve, – displacement from B to IO in the pushover curve.
From [11], we can get the structural stiffness of both steel frames.
For uniform load for steel frame without LYP steel damper:
For triangle load pushover curve for steel frame without LYP steel damper:
For uniform load for steel frame with LYP steel damper:
For triangle load pushover curve for steel frame with LYP steel damper:
Fig. 33The based curve of the two steel frames (Source: Author’s own Figure Trough Sap2000)
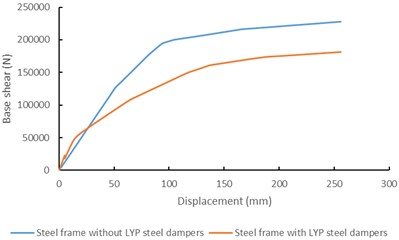
a) Uniform load
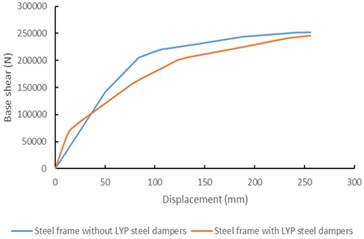
b) Triangle load
The comparison on the two loads analyzed in the pushover analysis shows that the steel frame without LYP steel dampers is safe since it did not collapse while for the uniform pushover curve, we noticed that the frame entered the yield zone very early; a further check on the structure shows that the braces yielded; this conforms to the fact that the braces and the LYP steel dampers are the first line of defense against structural failure. The structural stiffness of the steel frame with LYP steel dampers is greater than the steel frame without LYP steel dampers as can be observed from the higher curve as seen from the pushover curves for the uniform load and triangle load .in the uniform pushover curve of the steel frame with LYP steel damper, we noticed the frame yielded early. The stiffness has an increase of 44 % for both the uniform and triangle load pushover curve with the addition of LYP steel dampers to the steel frame. The higher structural stiffness shows that the addition of LYP steel dampers to the steel frame helps the steel frame increase its seismic resistance.
Table 15Structural stiffness from pushover curve (Source: Author’s own calculations Trough Sap2000)
Frame type | Uniform load (N/mm) | Triangle load (N/mm) |
Steel frame without LYP steel damper | 2476.27 | 2818.69 |
Steel frame with LYP steel damper | 4427.54 | 5040.98 |
4.5.2. Inter-story drift angle and comparison with the inter-story drift angle results of the time history analysis
Inter-story drift is one of the most important aspect in the seismic design of a structure, we would present the inter-story drift angle from the ATC-40 capacity spectrum and then compare it with the inter-story drift angle gotten from the time history analysis. The performance of a structure based on the drift limit is presented in Table 16.
Table 16Performance levels on a structure based on the drift limit
Performance level | Degree of damage | Drift limit |
Fully operational | No damage | 1/500 (0.002) |
Operational | Slight damage | 1/200 (0.005) |
Life safety | Moderate damage | 1/66.7 (0.015) |
Near collapse | Heavy damage | <1/40 (0.025) |
Collapse | Collapse | >1/40 (0.025) |
The inter-story drift angle values obtained from the ATC-40 capacity spectrum is shown in Table 17 and Table18 for their respective lateral loads for the steel frame without LYP steel dampers.
Table 17Uniform ATC-40 capacity spectrum inter-story drift angle values of the steel frame without LYP steel dampers
Floor | Frequent (rad) | Moderate (rad) | Rare (rad) |
First floor () | 0.001474 | 0.004438 | 0.008840 |
Second floor () | 0.001737 | 0.005173 | 0.010307 |
Table 18Triangle ATC-40 capacity spectrum inter-story drift angle values of the steel frame without LYP steel dampers
Floor | Frequent (rad) | Moderate (rad) | Rare (rad) |
First floor () | 0.001586 | 0.004774 | 0.008617 |
Second floor () | 0.001625 | 0.004878 | 0.008763 |
The inter-story drift angle values obtained from the ATC-40 capacity spectrum is shown in Table 19 and 20 for their respective lateral loads for the steel frame with LYP steel dampers.
Table 19Uniform inter-story drift angle values of the steel frame with LYP steel dampers
Floor | Frequent (rad) | Moderate (rad) | Rare (rad) |
First floor () | 0.000522 | 0.000522 | 0.000522 |
Second floor () | 0.001080 | 0.001080 | 0.001080 |
Table 20Triangle inter-story drift angle values of the steel frame with LYP steel dampers
floor | Frequent (rad) | Moderate (rad) | Rare (rad) |
First floor () | 0.000602 | 0.001213 | 0.002358 |
Second floor () | 0.001000 | 0.001990 | 0.004044 |
We would ignore the uniform ATC-40 capacity spectrum inter-story drift angle since the frame yielded and it would not give us the required results under the different earthquake types, we would focus solely on the triangle ATC-40 capacity spectrum. According to the seismic codes for the design of buildings is 1/250 = 0.004 under frequent earthquake and 1/50 = 0.02 under rare earthquake. From Fig. 34 and Fig. 35 for both ATC-40 capacity spectrum and the time-history analysis, we can see that the maximum inter-story drift angle value is 0.0016 for the frequent earthquake type and 0.0083 for the rare earthquake type. Based on the performance level of structures, we can notice that for frequent, moderate and rare earthquake type, the building was not damaged, slightly damaged and moderately damaged respectively; this shows that the building satisfies the specifications as stated in the code for the seismic design of buildings.
Fig. 34Inter-story drift comparing the inter-story drift in time-history analysis and that of ATC 40 capacity spectrum for the steel frame without LYP steel dampers
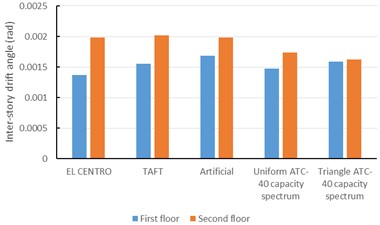
a) Frequent earthquake motion
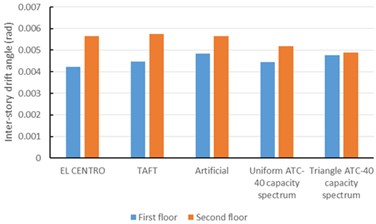
b) Moderate earthquake motion
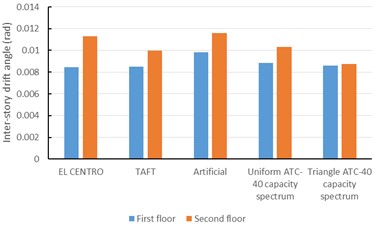
c) Rare earthquake motion
Fig. 35Inter-story drift comparing the inter-story drift in time-history analysis and that of ATC 40 capacity spectrum for the steel frame with LYP steel dampers
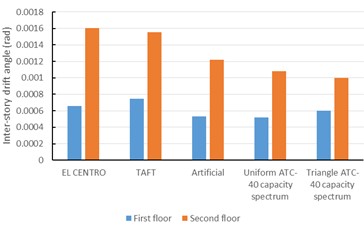
a) Frequent earthquake motion
b) Moderate earthquake motion
c) Rare earthquake motion
4.5.3. Stress of damper and comparison with the base stress of damper results of the time history analysis
We would get the von Mises equivalent stress which is the force per unit area in the LYP steel dampers in the uniform and triangle load pushover analysis. In the uniform load ATC-40 capacity spectrum, for frequent, moderate and rare earthquake level, the maximum yield stress reaches up to 130.4 MPa, we notice that most of the LYP steel dampers are in the yield stage, this conforms to the fact that the LYP steel dampers are the first yield of defense in the steel frame.
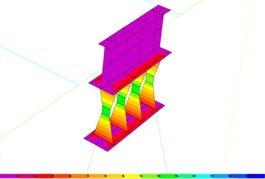
From Fig. 36, As can be seen from the stress distribution in the LYP steel dampers, for the triangle load pushover analysis, the maximum stress for the frequent, moderate and rare earthquake levels are 128.02 MPa, 206.26 MPa and 209.41 MPa respectively, for the frequent and moderate earthquake levels we can observe that the LYP steel dampers are mostly in the near yield stage, for the rare earthquake level, we can observe that the LYP steel damper are mostly in the range of collapse and yield stage, we can say the stress in the damper increases as the earthquake level increases and vice versa. We can say that the LYP steel dampers are good energy dissipation agents since they mostly absorb the seismic energy during a seismic occurrence in order to protect the main steel frame from destruction.
Fig. 36Distribution of stress of LYP steel damper under triangle load for frequent, moderate and rare earthquake level
a) Triangle frequent
b) Triangle moderate
c) Triangle rare
Table 21The error between the maximum stress under the different earthquake waves and the maximum stress of the uniform ATC-40 capacity spectrum of the steel frame with LYP steel dampers (Source: Author’s own calculations Trough Sap2000)
Earthquake name | Maximum stress under frequent earthquake (MPa) | Maximum stress pushover analysis under frequent earthquake (MPa) | Error (%) | Maximum stress under moderate earthquake (MPa) | Maximum stress pushover analysis under moderate earthquake (MPa) | Error (%) | Maximum stress under rare earthquake (MPa) | Maximum stress pushover analysis under rare earthquake (MPa) | Error (%) |
El Centro | 128.99 | 130.40 | –1.08 | 209.69 | 130.40 | 60.81 | 209.73 | 130.40 | 60.84 |
Taft | 129.97 | 0.34 | 209.51 | 60.67 | 209.77 | 60.87 | |||
Artificial | 154.29 | 18.32 | 209.62 | 60.75 | 209.81 | 60.90 |
Table 22The error between the maximum stress under the different earthquake waves and the maximum stress of the triangle ATC-40 capacity spectrum of the steel frame with LYP steel dampers (Source: Author’s own calculations Trough Sap2000)
Earthquake name | Maximum stress under frequent earthquake (MPa) | Maximum stress pushover analysis under frequent earthquake (MPa) | Error (%) | Maximum stress under moderate earthquake (MPa) | Maximum stress pushover analysis under moderate earthquake (MPa) | Error (%) | Maximum stress under rare earthquake (MPa) | Maximum stress pushover analysis under rare earthquake (MPa) | Error (%) |
El Centro | 128.99 | 128.02 | 0.76 | 209.69 | 206.26 | 1.66 | 209.73 | 209.41 | 0.15 |
Taft | 129.97 | 1.52 | 209.51 | 1.58 | 209.77 | 0.17 | |||
Artificial | 154.29 | 20.52 | 209.62 | 1.63 | 209.81 | 0.19 |
We can notice that the difference in the maximum stress of the three earthquake waves and the maximum stress of the LYP steel damper from the pushover analysis under the uniform and triangle loads, the difference in the uniform load pushover analysis is 60, 97 %, the reason is that the braces in the steel frame yielded, so this would not give us an accurate comparison between both the time history analysis and the pushover analysis.
From the pushover analysis under the triangle load, we can notice that the maximum difference in the maximum stress between the time history analysis and the pushover analysis is 20.52 % in the artificial frequent earthquake level, the triangle load pushover analysis would give us a more accurate comparison between both the time history analysis maximum stress and the pushover analysis maximum stress, so from all these observations, we can say that the maximum stress in the damper is almost similar in both results.
5. Conclusions
We summarized different results obtained from the two steel frame models that are the steel frame model without LYP steel dampers and the steel frame with LYP steel dampers, this will give us a summary about the different behavior of the two structures under seismic forces. The effects of adding LYP steel dampers to the structure were also observed.
1) In the modal analysis, we observed a reduction in the period of the frame with the addition of LYP steel dampers. This shows that the steel frame vibrates less in the event of a seismic occurrence. We also observed an increase in the frequency of the steel frame with LYP steel dampers as the frequency is inversely proportional to the period.
2) The nonlinear time history analysis, we can see that the addition of LYP steel dampers reduces the displacement of the top story in the three different seismic waves under the three different earthquake levels. With this observation, we can say the addition of dampers reduces the displacement of the frame in the event of a seismic occurrence.
3) There is a reduction in the inter-story drift angle of the steel frame with the addition of LYP steel dampers in the time history analysis. The inter-story drift is an important parameter to check in the seismic design of structures, so we can say the addition of the LYP steel dampers greatly improve the steel frame capacity to resist the inter-story drift.
4) The addition of LYP steel dampers to the steel frame reduce the base shear force acting on the structure in the time history analysis for the three earthquake waves under the three earthquake levels. The base shear force average reduced by 45 %, 69 % and 70 % for the El Centro, Taft and Artificial earthquake waves respectively under the three earthquake levels. So, we can say that the addition of LYP steel dampers reduces the base shear acting in the steel frame.
5) The von Mises stress of the LYP steel damper is found under the three earthquake waves under the three earthquake levels, these results shows that the LYP steel dampers are mostly in the yield stage, this conforms to the fact that the LYP steel dampers are a yield of defense against seismic forces and this shows that the LYP steel dampers are good energy dissipation agents in the steel frame Under the different load combinations the internal force of the members of both steel frames was obtained. The internal forces consist of the axial, shear and bending moment. We have also observed a reduction in the internal forces of individual members by the introduction of the LYP steel dampers. The stress of the LYP steel dampers is obtained under the different load combinations in the steel frame with LYP steel dampers.
6) The ATC-40 capacity spectrum is carried out under the pushover analysis, the Ca and Cv are found for the intensity 8 for the frequent, moderate and rare earthquake level. We get the base shear of the two steel frames under the different earthquake levels and we compared the results to the results from the nonlinear dynamic time history analysis and we make sure it meets the requirements of the Chinese seismic codes which says according to China seismic design codes, the average value of the base shear force calculated by the time-history analysis should not be less than 65 % of the base shear force calculated by the Capacity spectrum and the average value of base shear calculated by multiple time history curve should not be less than 80 % of the base shear value calculated from the capacity spectrum method. We would ignore the uniform ATC-40 capacity spectrum, since the braces yielded and this means the steel frame would not be able to give us the desired results under the three different earthquake levels.
7) Under the ATC-40 capacity spectrum, we can get the inter-story drift angle of the two steel frames under the different earthquake levels, we then compare the results to the results of the inter-story drift angle from the time history analysis. We can see that the results of the time history analysis have higher values compared to the pushover ATC-40 capacity spectrum.
8) We concluded from different results, the addition of LYP steel dampers to the steel frame improves the seismic resistance of the steel frame, this shows that the addition of LYP steel dampers is needed in structures in places that seismic events could occur.
References
-
Heysami A. Types of dampers and their seismic performances during an earthquake. Special Issue of Current World Environment, Vol. 10, 2015, p. 1002-1015.
-
He H., Wang X., Zhang X. Energy-dissipation performance of combined low yield point steel plate damper based on topology optimization and its application in structural control. Advances in Materials Science and Engineering, Vol. 2016, 2016, p. 5654619.
-
Baikuntha S., Michael R. J., Ozbulut O. E. Superelastic viscous damper for enhanced seismic performance of steel moment frames. Engineering Structure, Vol. 105, 2015, p. 152-164.
-
Amadeo B.-C., Leandro M., David E.-M. Seismic performance and damage evaluation of a reinforced concrete frame with hysteretic dampers through shake‐table tests. Earthquake Engineering and Structural Dynamics, Vol. 43, Issue 15, 2014, p. 791-810.
-
Castellano M. G., Balducci F., Antonucci R. Shaking table tests on R.C. frame with dissipative bracings. AIP Conference Proceedings, 2008.
-
Bairrao R., Vaz C. T. Shaking table testing of civil engineering structures – the LNEC 3D simulator experience. Proceedings of the 121th world Conference on Earthquake Engineering NZ Society for Earthquake Engineering, Auckland, 2000.
-
Wenguang L., Chuan Q., Yang L., Wenfu H., Qiaorong Y. Shaking table tests on earthquake response characterization of a complex museum isolated structure in high intensity area. Shock and Vibration, Vol. 2016, 2016, p. 7974090.
-
Kalali H., Ghanbari G. T., Hajsadeghi M., Zirakian T., Alaee F. Numerical study on steel shear walls with sinusoidal corrugated plates. Latin American Journal of Solids and Structures, Vol. 13, Issue 15, 2016, p. 2802-2814.
-
Takeuchi T., Chen X., Matsui R. Seismic performance of controlled spine frames with energy-dissipating members. Journal of Constructional Steel Research, Vol. 114, 2015, p. 51-65.
-
Gennaro M., Vincenzo P., Giuseppe M., Vittorio C., Crescenzo P., Pauline L., Renato T., Gaetano M. Shake table tests for seismic assessment for suspended continuous ceilings. Bull Earthquake Engineering, Vol. 10, Issue 6, 2012, p. 1819-1832.
-
Chaofeng Z., Jiajia Z., Meiping W., Jinhu Y., Junhua Z. The lightweight design of a seismic low yield-strength steel shear panel damper. Materials, Vol. 9, 2016, p. 424.
-
Chen X., Takeuchi T., Matsui R. Simplified design procedure for controlled spine frames with energy-dissipating members. Journal of Constructional Steel Research, Vol. 135, 2017, p. 242-252.
-
Zhiguo S., Loong C. N., Tan Y., Cc C., Shan J. Performance evaluation of an eddy current tuned mass damper for seismic protection using shaking table tests. 7th World Conference on Structural Control and Monitoring, Qingdao, 2018.
-
Jia J., Song N., Xu Z., Han Q., Zhang Q. Hysteretic behavior simulation of novel rhombic mild steel dampers. Journal of Vibroengineering, Vol. 17, Issue 6, 2015, p. 3122-3132.
-
Bahador B., Kwang Yong C., Sang Hoon O., Hong Sik R. Shaking table test for evaluating the seismic response characteristics of concentrically braced steel structure with and without hysteretic dampers. International Journal on Steel Structures, Vol. 16, Issue 1, 2016, p. 23-39.
-
Hye Min S., Hee Du L., Kyung Jae S. Shaking table test and analysis of reinforced concrete frame with steel shear wall with circular opening and slit damper. International Journal on Steel Structures, Vol. 18, Issue 4, 2018, p. 1420-1430.
-
Yasunari W., Toshiaki S., Haruyuki K., Daiki S., Kazuaki M., Takuya U., Yukio M. Evaluation of effectivity of high-strength steels and seismic performance for low- and medium-rise passive control steel structures. AIJ Journal of Technology and Design, Vol. 22, Issue 52, 2016, p. 909-914.
-
Xueyuan Y., Ai Q., Hong C. Mechanical property and shaking table test of oval steellead damper. Harbin Gongye Daxue Xuebao/Journal of Harbin Institute of Technology, Vol. 49, Issue 6, 2017, p. 136-141.
-
Di Cesare A., Ponzo F., Nigro D. Assessment of the performance of hysteretic energy dissipation bracing systems. Bulletin of Earthquake Engineering, Vol. 12, Issue 6, 2014, p. 2777-2796.
-
Huang L.-J., Syu H.-J. Seismic response analysis of tower crane using SAP2000. Procedia Engineering, Vol. 79, 2014, p. 513-522.
-
MazzottaV., Brunesi E., Nascimbene R. Numerical modeling and seismic analysis of tall steel buildings with braced frame systems. Periodica Polytechnica Civil Engineering, Vol. 61, Issue 2, 2017, p. 196-208.
-
Pinot P., G. G. Numerical simulation for designing tuned liquid dampers to damp out double-pendulum oscillations. Measurement Science and Technology, Vol. 22, Issue 6, 2011, p. 065103.
-
Hidayaty E., Setio H. D., Surahman A., Moestopo M. Numerical analysis of viscous wall dampers on steel frame. 3rd International Conference on Sustainable Infrastructure and Built Environment, 2017.
-
Guerrero H., Ji T., Alberto E. J. Experimental studies of a steel frame model with and without buckling-restrained braces. Revista de Ingeniería Sísmica, Vol. 95, 2016, p. 33-52.
-
Chandravanshi M. L., Mukhopadhyay A. K. Modal analysis of structural vibration. International Mechanical Engineering Congress and Exposition, California, 2013.
-
Vosoughifar H., Zeinab H. S., Shabazi N., Mohialdin H. S. Evaluating the seismic stress distribution in the high-rise structures connections with optimal bracing system. The International AAAI Conference on Web and Social Media, Paris, 2016.
-
Sean W., Hiley R. A. A nonlinear response history model for the seismic analysis of high-rise framed buildings. Computer and Structures, Vol. 64, Issue 5, 2006, p. 318-329.
-
Saman B., Ali H., Alireza A. Heightwise distribution of stiffness ratio for optimum seismic design of steel frames with metallic-yielding dampers. Procedia Engineering, Vol. 14, 2011, p. 2891-2898.
-
Z. J., Bu G. B., Li K. N. Calculation methods for inter-story drifts of building structures. 15th World Conference on. Earthquake Engineering, Lisboa, 2012.
-
Huanhuan X., Wengfeng L., Yanqiang G. Statistical analyses of steel frame structure drift angle. Applied Mechanics and Materials, Vol. 204, Issue 208, 2012, p. 1102-1108.
-
Dorbani S., Badaoui M., Benouar D. Seismic base shear force depending on building fundamental period and site conditions: deterministic formulation and probabilistic analysis. International Journal of Civil and Environmental Engineering, Vol. 11, Issue 3, 2017, p. 282-285.
-
Ing Chang J., William S. Teaching von mises stress: from principal axes to nonprincipal axes. Annual Conference and Exposition, Texas, 2009.
-
Ioannis G. P. Seismic assessment of RC building according to FEMA 356 and Eurocode 8. 16th Conference on Concrete, 2009.
-
Riza A. H., Mohammed S. A., Samir A. A seismic assessment of an RC building using pushover analysis. engineering. Technology and Applied Science Research, Vol. 4, Issue 3, 2014, p. 631-635.
-
Tande S. N., Karad R. M. Performance based inelastic seismic analysis of buildings. International Journal of Latest Trends in Engineering and Technology (IJLTET), Vol. 2, Issue 4, 2013, p. 380-390.
-
Kaspar P., Marc B. Application of the capacity spectrum method to R.C. buildings with bearing walls. 12th World Conference on Earthquake Engineering, 2000.
-
Sachin K., Karad U. N. Case study of RC slab bridge using nonlinear analysis. International Journal of Engineering and Innovative Technology, Vol. 3, Issue 12, 2014, p. 314-320.
-
Mazumder R. K. Application of capacity spectrum method based on ATC 40 and BNBC 1993. International Journal of Advanced Structures and Geotechnical Engineering, Vol. 3, Issue 4, 2014, p. 364-367.
-
Standard for Design of Steel Structures. National Standard of the People’s Republic of China, GB 50017-2017, Ministry of Housing and Urban-Rural Development of PRC, 2017.
-
Murty C. V. R., Rupen G., Vijayanarayanan A., Vipul V. M. Some concepts in earthquake behaviour of buildings. Gujarat State Disaster Management Authority, 2012.
-
Code for Seismic Design of Buildings. National Standard of the People’s Republic of China, GB50011-2010, Building Industry Press, Ministry of Housing and Urban Rural Construction of the People’s Republic of China, 2010.
About this article

This paper was supported by the Strategic Priority Research Program of Chinese Academy of Sciences (Grant No. XDA 20030301), and 135 Strategic Program of the Institute of Mountain Hazards and Environment, CAS (No. SDS-1351701).
