Abstract
Pushover analysis has become an effective tool for seismic design of high-rise buildings under severe earthquakes. However, the applicability of traditional pushover analysis is often questioned for long-span structures due to their complex dynamic characteristics. In this paper, pushover analysis was adopted to determine the seismic behavior of a long-span steel truss structure under severe earthquakes. Load distributions were determined based on the fundamental modes for vertical and horizontal earthquakes respectively. Pushover curves were obtained by nonlinear static analysis. Target displacements were determined with capacity spectrum method. The maximum displacements and plastic hinge distributions determined by traditional pushover analysis agreed well with those by nonlinear time history analysis for both horizontal and vertical earthquake actions. It was then concluded that the seismic behavior of this kind of long-span steel truss structures can be evaluated by traditional pushover analysis accurately enough for practical design purpose.
1. Introduction
Long-span steel truss structures are widely used in public buildings, such as gymnasium, train stations and conference centers. The failure of these structures may cause huge loss of properties and even human’s lives. In addition, these structures are often temporary shelters for people after severe earthquakes. Therefore, this kind of structures is often of high safety level and should be designed carefully to prevent the structures from collapsing even under the action of the severe earthquake.
Response spectrum method (RSM) is the conventional approach for seismic design of building structures. RSM accesses the maximum response of multi-degrees-of-freedom systems under earthquake load based on mode superposition method and response spectrum theory of single-degree-of-freedom (SDF) systems. Thus, RSM is applicable only to dynamic analysis of building structures with linear elastic behaviour. Nonlinear time history analysis (NTHA) is the most commonly used approach to determine the elasto-plastic dynamic response of building structures under severe earthquakes. NTHA solves the dynamic response of building structures by direct numerical integration of dynamic equilibrium equations. The result of NTHA is accurate for specific ground motions. However, NTHA is time-consuming, dependent of the selection of ground motions and sometimes too complicated for common structural engineers, which hamper its application in engineering practice. With the development of performance-based seismic design concept, pushover analysis (PA) [1, 2] began to be another effective tool for seismic design of structures. In pushover analysis, a structure is pushed with certain distributed loads until a predetermined target displacement is reached, to estimate the seismic behavior of the structure under severe earthquakes. Lots of research works have been done on pushover analysis of high-rise buildings [3-5] and the accuracy of pushover analysis has been verified by comparing with the results of NTHA [6-9] and shaking table tests [10].
Recently, pushover analysis has been adopted in the seismic analysis of long-span steel structures by some researchers and engineers [11-14]. However, pushover analysis is based on the assumption that the dynamic response of the structure is controlled by the elastic fundamental mode, which is the case for most regular high-rise buildings [15]. Due to their large number of degrees of freedom, long-span steel structures often have densely distributed natural frequencies and complex vibration modes. The accuracy of pushover analysis is then often questioned because the above assumption may not be satisfied. Though some modified pushover procedures [16-21] have been presented to consider the effect of high-order vibration modes, they all improve the accuracy of pushover analysis at the expense of losing the simplicity of traditional pushover analysis. In addition, different from high-rise buildings, vertical earthquake should also be considered in the seismic design of long-span steel structures. Therefore, it is desired that the accuracy of traditional pushover analysis can be evaluated for long-span steel structures.
In this paper, a long-span steel truss structure was taken as a case study. Pushover analysis was adopted to evaluate its seismic behavior under vertical and horizontal severe earthquakes respectively. Nonlinear time history analysis was conducted for comparison. Typical ground motion, El-Centro (1940), and the corresponding acceleration response spectrum were used in the comparative analysis. The maximum displacements and plastic hinge distributions obtained by pushover analysis and NTHA were compared to evaluate the accuracy of traditional pushover analysis for this kind of long-span steel truss structures.
2. Capacity spectrum method
Target displacement is the largest displacement of a structure possibly occurred under severe earthquake. In traditional pushover analysis, the pushover curve of a structure is first obtained by nonlinear static analysis, and then the target displacement can be determined by capacity spectrum method (CSM) [1, 2].
The fundamental concept of capacity spectrum method is setting up two spectra in the same coordinate system, i.e. capacity spectrum based on the pushover curve and demand spectrum based on the acceleration response spectrum. The intersection point of the two spectrum curves is called performance point, which gives the target displacement of the structure. The computational procedure of capacity spectrum method is as following:
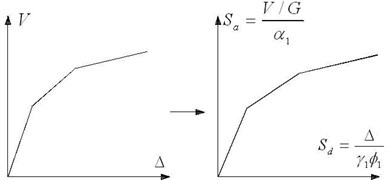
(1) Obtain pushover curve (total reaction force of the supports, , versus displacement along earthquake direction, ) of the structure by nonlinear static analysis. Construct the capacity spectrum by transforming the pushover curve to a spectral acceleration () versus spectral displacement () curve, as shown in Fig. 1. In the figure, , and are the maximum amplitude, mass participating factor and mode participating factor of fundamental vibration mode. G is the gravity load.
Fig. 1Construction of capacity spectrum
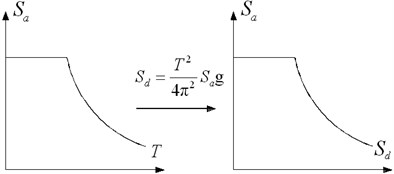
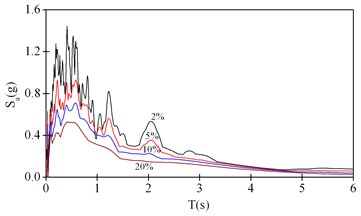
(2) Generate elastic acceleration response spectrum with elastic damping ratio . Transform the curve to spectral acceleration versus spectral displacement curve, as shown in Fig. 2. to obtain the elastic demand spectrum. Set the initial value for the iterative computation of the target displacement. is the fundamental period of vibration.
Fig. 2Generation of demand spectrum
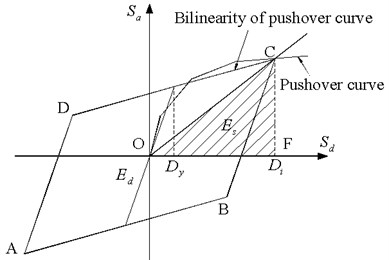
(3) Determine equivalent damping ratio . is the viscous damping ratio and . is the area of □ABCD and is the area of △OCF, as shown in Fig. 3. is a modification factor based on the hysteretic behaviour of the structure. For structures with stable and plump hysteretic loop, 1 if 16.25 %; 0.77 if 45 %. If 16.25 % 45 %, can be determined by linearly interpolation. In Fig. 3, is the displacement for the first yielding of the structure.
Fig. 3Definition of Ed and Es for determination of viscous damping ratio
(4) Generate demand spectrum with equivalent damping ratio . The displacement , corresponding to the intersection point of the demand spectrum and the capacity spectrum is a new estimation of the target displacement.
(5) Check the convergence. If is smaller than the allowable value, is thought to be the performance point. Otherwise, set and repeat (3)-(5).
3. Description of the studied long-span steel truss structure
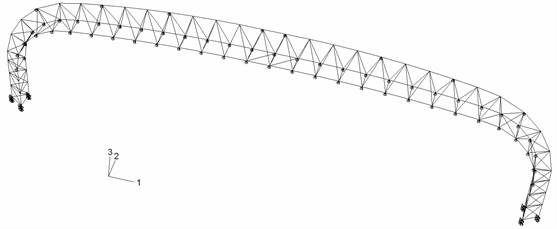
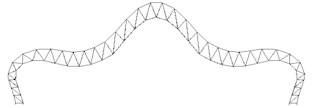
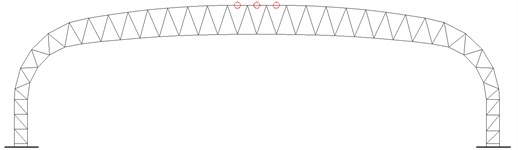
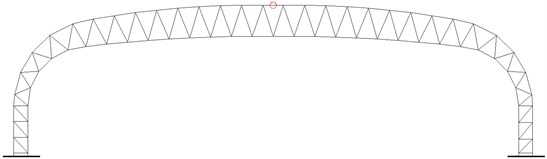
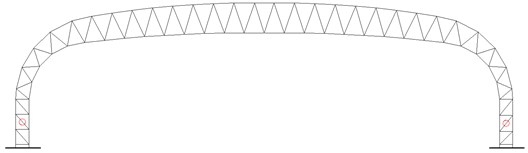
The studied long-span steel truss structure was designed as the roof structure of the platform of a rail station. The steel truss spans 74.6 m and is composed of truss columns and truss beam with variable triangular section, as shown in Fig. 4. The bottom ends of the three chord members of each truss column were pinned to the steel reinforced concrete bases. All members of the steel truss are of circular hollow section, as shown in Table 1. Continuous members are adopted for the chords and the diagonal members are connected to the chords with unstiffened tubular joints. The grade of the steel is Q235B [22] with yield stress 235 MPa for all members. Q235B steel in China is equivalent to S235 in EN standardand A36 in ASTM standard of USA. The roof structure is composed of a number of this kind of steel trusses, connected by longitudinal members and bracing system. The distance between adjacent steel trusses is 22 m. The dead load and live load acting on the roof are 1.5 kN/m2 and 0.5 kN/m2 respectively.
In the roof structure, steel trusses subject all loads in vertical and lateral directions, while the bracing system between the trusses subjects the longitudinal loads. So, the steel truss subjects only vertical and lateral earthquake actions and two-dimensional pushover analysis satisfies the requirement of practical design.
Fig. 4Configuration of the long-span steel truss structure
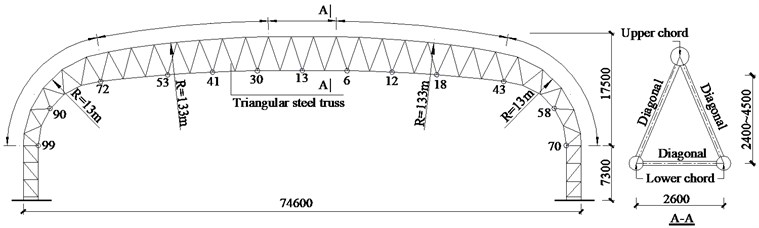
Table 1Member sections for the steel truss structure
Truss column | Truss beam | |
Upper chord | Φ550×18 | Φ550×14 |
Lower chord | Φ426×18 | Φ426×14 |
Diagonal member | Φ146×6, Φ180×8, Φ273×10 | Φ114×6, Φ168×8, Φ273×8 |
4. Setup of finite element model and natural vibration analysis
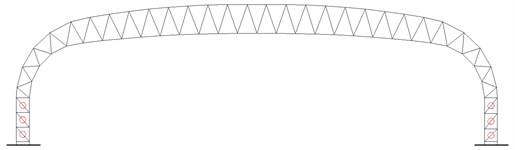
Finite element model was setup for the steel truss structure with commercial finite element software ABAQUS [23], as shown in Fig. 5. Primary analysis showed that the moments in chord members were small enough to be ignored in the analysis. Therefore, all the joints were assumed to be hinge joints and the members subject only axial forces, either tension or compression. 2-node linear displacement 3-D truss element, T3D2, implemented in ABAQUS was adopted for all members. The bottom-end nodes of the three chord members of each truss column were simply supported with all three translations being restrained. At all locations of longitudinal members, the nodes of the steel truss were restrained laterally. All dead loads and half of the live load acting on the steel truss were considered by attaching equivalent mass elements to lower-chord nodes. The material model for the steel is idealized elastic-plastic material with yield stress 235 MPa. If the axial stress of a member reaches the yield stress of the material, a plastic hinge is thought to be generated at that location, which means the complete yield of the axial loaded member.
Fig. 5Finite element model of the long-span steel truss structure
Natural vibration analysis was conducted for the steel truss structure with Lanczos method. The first 4 natural frequencies and corresponding vibration modes are as shown in Table 2 and Fig. 6. It can be seen that mode 1 and 3 are vibration modes in horizontal direction, while mode 2 and 4 are vibration modes in vertical direction. The effective mass ratio illustrates the predominant direction of the vibration modes precisely [24]. The effective mass ratio in horizontal direction of mode 1 is 85.84 %. The effective mass ratio in vertical direction of mode 2 is 60.33 %. Therefore, mode 1 and mode 2 are fundamental modes for the pushover analysis in horizontal and vertical directions respectively. It should be noted that there is little vibration couple between the first two modes though they have very close frequencies. In addition, no significant vibration couple was found between higher modes.
Fig. 6First four vibration modes of the steel truss
a)
b)
c)
d)
Table 2First four natural frequencies and mode participating factors of the steel truss
Mode number | Natural frequency | Mode participating factor | Effective mass ratio | ||
In direction | In direction | In direction | In direction | ||
1 | 1.4972 | 0.9847 | –0.0000 | 85.84 % | 0.00 % |
2 | 1.5035 | 0.0000 | 1.3117 | 0.00 % | 60.33 % |
3 | 3.2879 | –0.4679 | 0.0000 | 9.66 % | 0.00 % |
4 | 5.0891 | 0.0000 | –0.5317 | 0.00 % | 8.73 % |
5. Nonlinear time history analysis
The seismic behaviour of the long-span steel truss under severe earthquakes was determined by nonlinear time history analysis. Vertical and horizontal earthquake actions were considered respectively. The outcomes of the NTHA were set to be the benchmark to evaluate the accuracy of pushover analysis.
Fig. 7Ground motion for horizontal earthquake: El-Centro (1940)
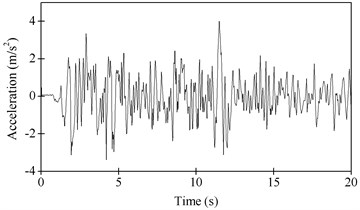
Typical ground motion, El-Centro (1940), lasting 20 seconds with equal time spacing of 0.02 second, was adopted in nonlinear time history analysis. The peak value of the ground motion was adjusted proportionally to 4.0 m/s2 for horizontal earthquake. In order to produce notable plastic deformation, the peak value of the ground motion for vertical earthquake was adjusted proportionally to 3.3 m/s2, instead of 0.65 times that of horizontal earthquake according to Code for Seismic Design of Buildings of China [25]. The ground motion for the horizontal earthquake after adjustment is as shown in Fig. 7. The Rayleigh damping was applied to the steel truss and the damping ratio, 0.05, was assumed for the first two vibration modes. All gravity loads were applied on the triangular steel truss before NTHA.
The time history of vertical displacements of node 13 under vertical earthquake is as shown in Fig. 8(a). The maximum vertical displacement of node 13 is 96.0 mm, which occurs at 12 s. The time history of horizontal displacements of node 13 under horizontal earthquake is as shown in Fig. 8(b). The maximum horizontal displacement of node 13 is 77.8 mm. Node 13 is the node at the mid-span of the lower chord of the steel truss, as shown in Fig. 4. The plastic hinge distribution is as shown in Fig. 9(a) and 9(b) for vertical and horizontal earthquake respectively.
Fig. 8Dynamic displacements of node 13 by NTHA
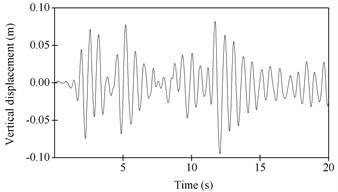
a) Under vertical earthquake
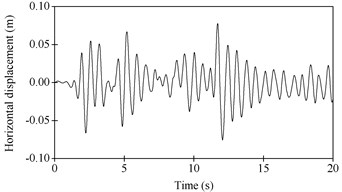
b) Under horizontal earthquake
Fig. 9Plastic hinge distribution by NTHA
a) Under vertical earthquake
b) Under horizontal earthquake
6. Pushover analysis
6.1. Vertical earthquake action
For vertical earthquake action, mode 2 is the fundamental mode and controls the seismic behaviour of the long-span steel truss. Load distribution was then calculated as for nonlinear static analysis, as shown in Fig. 10, in which is the mass matrix and is the natural mode of mode 2. The pushover curve was determined as relationship between total vertical reaction force and vertical displacement of node 13, as shown in Fig. 11.
It should be noted that all gravity loads were applied on the steel truss before nonlinear static analysis. For the sake of comparison, the acceleration response spectrum of the ground motion adopted in NTHA was generated for different damping ratio, as shown in Fig. 12. The pushover curve and the response spectrum were then transferred to capacity spectrum and demand spectrum for target displacement determination by capacity spectrum method.
Fig. 10Load distribution for vertical earthquake
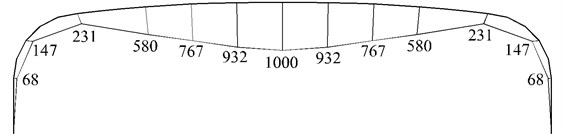
Fig. 11Pushover curve for vertical earthquake
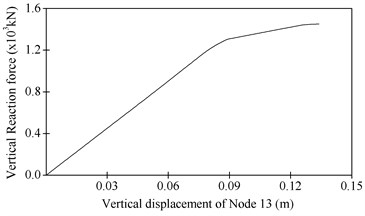
Fig. 12Acceleration response spectrum for the ground motion of vertical earthquake
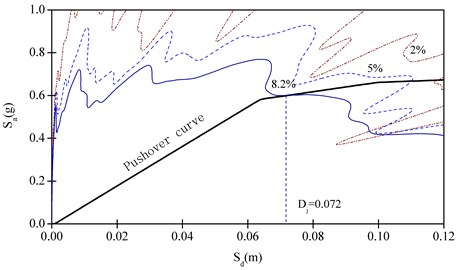
Determination of the target displacement by capacity spectrum method needs iterative calculation. The final outcome of the iteration is as shown in Fig. 13. The intersection of capacity spectrum and demand spectrum gives 0.072 m. The target displacement can then be calculated as 94.4 mm based on the relationship between the pushover curve and capacity spectrum. This displacement represents the maximum dynamic vertical displacement of node 13 under the vertical earthquake action.
Fig. 13Target displacement determination by CSM for vertical earthquake action
The dynamic vertical displacements obtained by pushover analysis (PA) were compared with those by nonlinear time history analysis (NTHA) for the lower chord of the triangular steel truss in Table 3. It can be seen that the dynamic displacements obtained by the two methods agreed very well. The difference between the dynamic vertical displacements of node 13 obtained by the two methods is (96.0-94.4)/96.0×100 % ≈ 2 %. The difference is even smaller and can be ignored for the total displacement, as shown in Fig. 14.
Table 3Dynamic vertical displacement (mm) comparison for vertical earthquake action
Node | 99# | 90# | 72# | 53# | 41# | 30# | 13# |
NTHA | 0.4 | 1.6 | 22.7 | 56.6 | 74.6 | 90.1 | 96.0 |
PA | 0.4 | 1.3 | 20.2 | 52.3 | 70.2 | 86.7 | 94.4 |
The plastic hinge distribution obtained by pushover analysis is as shown in Fig. 15. It can be seen that the plastic hinge occurred at the mid-span of the upper chord of the steel truss, which is consistent with the result of nonlinear time history analysis. However, the number of plastic hinges obtained by pushover analysis is less than that by NTHA.
Fig. 14Total displacement comparison for vertical earthquake action
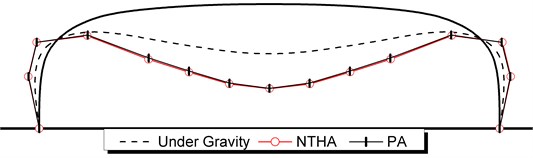
Fig. 15Plastic hinge distribution by pushover analysis for vertical earthquake action
6.2. Horizontal earthquake action
For horizontal earthquake action, mode 1 is the fundamental mode and load distribution for nonlinear static analysis was calculated as , as shown in Fig. 16, in which is the natural mode of mode 1. Target displacement was then determined for horizontal earthquake following the same procedure described in the previous section.
Fig. 16Load distribution for horizontal earthquake
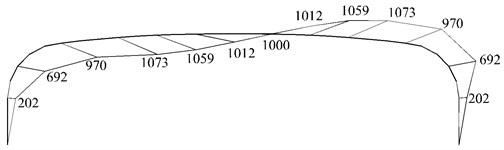
Fig. 17Target displacement determination by CSM for horizontal earthquake action
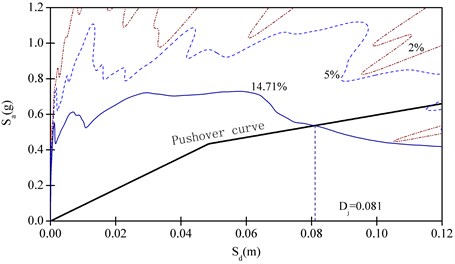
The intersection of the capacity spectrum and the demand spectrum was determined at 0.081 m by iteration calculation of capacity spectrum method, as shown in Fig. 17. According to the relationship between the pushover curve and capacity spectrum, the target displacement is 78.8 mm, which represents the maximum dynamic horizontal displacement of node 13 under the horizontal earthquake action.
The dynamic horizontal displacements obtained by pushover analysis (PA) agreed well with those by nonlinear time history analysis (NTHA) for nodes of the lower chord, as shown in Table 4. The difference between the dynamic horizontal displacement of node 13 obtained by the two methods is |77.8-78.8|/77.8×100 % ≈ 1 %. The total displacements are compared for horizontal earthquake action in Fig. 18.
Table 4Dynamic horizontal displacement (mm) comparison for horizontal earthquake action
Node | 99# | 90# | 72# | 53# | 41# | 30# | 13# |
NTHA | 21.8 | 53.7 | 71.1 | 75.0 | 76.5 | 77.2 | 77.8 |
PA | 29.7 | 57.8 | 73.1 | 76.5 | 77.8 | 78.6 | 78.8 |
Node | 6# | 12# | 18# | 43# | 58# | 70# | – |
NTHA | 77.9 | 77.9 | 77.4 | 75.5 | 66.0 | 48.1 | – |
PA | 79.4 | 79.6 | 79.4 | 78.4 | 72.4 | 58.2 | – |
The plastic hinge distribution obtained by pushover analysis is as shown in Fig. 19. The position of the plastic hinge is consistent with the result of nonlinear time history analysis, and again the number of plastic hinges obtained by pushover analysis is less than that by NTHA.
Fig. 18Total displacement comparison for horizontal earthquake action
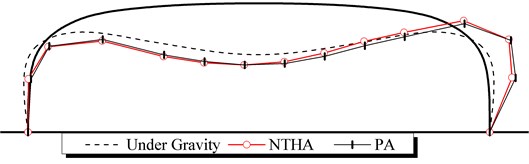
Fig. 19Plastic hinge distribution by pushover analysis for horizontal earthquake action
7. Conclusions
In this paper, traditional pushover analysis was adopted to determine the seismic behavior of a long-span steel truss structure under vertical and horizontal severe earthquakes respectively. Target displacements were determined with capacity spectrum method based on the pushover curves obtained by nonlinear static analysis. The accuracy of traditional pushover analysis was verified for the studied long-span steel truss structure by comparing with the results of nonlinear time history analysis. It was concluded that: (1) the maximum displacements and plastic hinge positions obtained by traditional pushover analysis agree well with those by nonlinear time history analysis for both horizontal and vertical earthquake action and are accurate enough for practical design purpose; (2) the natural mode with predominant effective mass along the earthquake direction should be adopted to determine the load distribution for nonlinear static analysis; (3) though the plastic hinge position obtained by traditional pushover analysis is consistent with the result of nonlinear time history analysis, but the number of plastic hinges obtained by pushover analysis is less than that by nonlinear time history analysis. It should be noted that these conclusions were obtained based on two-dimensional behaviour of the steel trusses and are applicable for similar structures only.
References
-
Seismic Evaluation and Retrofit of Concrete Buildings. Applied Technology Council (ATC), Report No. ATC-40, Redwood City, California, 1996.
-
Prestandard and Commentary for the Seismic Rehabilitation of Buildings. Federal Emergency Management Agency (FEMA), Report No. FEMA-356, Washington, D.C., 2000.
-
Di Sarno L., Wyatt T. A. High rise steel buildings under wind loads. Proceedings of the 11th International Conference on Metal Structures, Rzeszow, Poland, 2006.
-
Yin Y., Li S., Bai L. J. Study on pushover analysis method for multi-story staggered steel truss structures. Journal of Earthquake Engineering and Engineering Vibration, Vol. 28, Issue 3, 2008, p. 52-57, (in Chinese).
-
D'ambrisi A., De Stefano M., Tanganelli M. Use of pushover analysis for predicting seismic response of irregular buildings: A case study. Journal of Earthquake Engineering, Vol. 13, Issue 8, 2009, p. 1089-1100.
-
Kim S., D’amore E. Pushover analysis procedure in earthquake engineering. Earthquake Spectra, Vol. 15, Issue 3, 1999, p. 417-434.
-
Moghaddam H., Hajirasouliha I. An investigation on the accuracy of pushover analysis for estimating the seismic deformation of braced steel frames. Journal of Constructional Steel Research, Vol. 62, Issue 4, 2006, p. 343-351.
-
Huang K. On the applicability of pushover analysis for seismic evaluation of medium-and high-rise buildings. Structural Design of Tall and Special Buildings, Vol. 19, Issue 5, 2010, p. 573-588.
-
Causevic M., Mitrovic S. Comparison between non-linear dynamic and static seismic analysis of structures according to European and US provisions. Bulletin of Earthquake Engineering, Vol. 9, Issue 2, 2011, p. 467-489.
-
Cardone D. Nonlinear static methods vs. experimental shaking table test results. Journal of Earthquake Engineering, Vol. 11, Issue 6, 2007, p. 847-875.
-
Fu X. Y., Gu L., Yang X. Q., Yu W. J., Chen X. C. Structural design and research on Beijing Olympic National Swimming Center. Spatial Structures, Vol. 11, Issue 3, 2005, p. 14-21, (in Chinese).
-
Pan P., Ohsaki M. Nonlinear multimadal pushover analysis method for spatial structures. International Symposium on New Olympic, New Shell and Spatial Structures, 2006.
-
Paraskeva T. S., Kappos A. J., Sextos A. G. Extension of modal pushover analysis to seismic assessment of bridges. Earthquake Engineering and Structural Dynamics, Vol. 35, 2006, p. 1269-93.
-
Zhang W. J., Qian J. R. Application of pushover analysis in estimating seismic demands for large-span spatial structure. Evolution and Trends in Design, Analysis and Construction of Shell and Spatial Structures, 2009.
-
Elnashai A. S., Di Sarno L. Fundamentals of Earthquake Engineering. Wiley and Sons, UK, 2008.
-
Chopra A. K., Goel R. K. A modal pushover analysis procedure for estimating seismic demands for buildings. Earthquake Engineering and Structural Dynamics, Vol. 31, Issue 3, 2002, p. 561-582.
-
Chopra A. K., Goel R. K., Chintanapakdee C. Evaluation of a modified MPA procedure assuming higher modes as elastic to estimate seismic demands. Earthquake Spectra, Vol. 20, Issue 3, 2004, p. 757-778.
-
Kalkan E., Kunnath S. K. Adaptive modal combination procedure for nonlinear static analysis of building structure. Structural Engineering, Vol. 132, Issue 1, 2006, p. 1721-1731.
-
Mao J. M., Zhai C. H., Xie L. L. An improved modal pushover analysis procedure for estimating seismic demands of structures. Earthquake Engineering and Engineering Vibration, Vol. 7, Issue 1, 2008, p. 25-31, (in Chinese).
-
Davoudi T. A., Abbasnia R., Sarvghad Moghadam A., Maddah M. M., Khodam A. An alternative modal combination rule for adaptive pushover analysis. Structural Design of Tall and Special buildings, Vol. 25, 2016, p. 325-39.
-
Xiang Y., Luo Y. F., Shen Z. Y. An extended modal pushover procedure for estimating the in-plane seismic responses of latticed arches. Soil Dynamics and Earthquake Engineering, Vol. 93, 2017, p. 42-60.
-
Code for Design of Steel Structures GB 500017-2017. National Standard of the People’s Republic of China, Beijing; 2017 (in Chinese).
-
ABAQUS/Standard user’s manual. Hibbitt, Karlsson & Sorensen Inc, Pawtucket (RI), 2002.
-
Yin Y., Huang X., Han Q. H., Bai L. J. Study on the accuracy of response spectrum method for long-span reticulated shells. International Journal of Space Structures, Vol. 24, Issue 1, 2009, p. 27-35.
-
Code for Seismic Design of Buildings GB 50011-2010. National Standard of the People’s Republic of China, Beijing; 2010, (in Chinese).
About this article

