Abstract
Steel frames designed to the current codes will undergo an unrecoverable plastic deformation under strong earthquakes. The structures subjected to excessive deformations after earthquakes cannot be desirably repaired to their serviceable state, and can only be demolished, which brings about a serious direct and indirect economic loss. Thus, it is of great significance to predict the residual drift for the performance evaluation and control of structures after earthquakes. In order to investigate the residual drift response of steel frames under strong earthquakes, steel frames between 2 and 10 stories in height are designed according to Code for seismic design of buildings (GB50011-2010) and Code for design of steel structures (GB50017-2003) in this study. The designed structures are investigated numerically by pushover analysis and elasto-plastic time history analysis. Furthermore, the peak drifts, residual drifts and drift concentration factors are reasonably obtained under the action of moderate earthquakes and major earthquakes. The results indicate that the scatter in the residual drift results is a bit large. On the basis of analysis results, the calculation formulae are proposed to estimate the residual drifts of steel frames as a function of the expected peak drift, the initial recoverable elastic drift, and the drift concentration factor of steel frames.
1. Introduction
Steel frames will undergo an unrecoverable plastic deformation under strong earthquakes. The magnitude of residual drift reflects the damage degree of structures, and it is also a major index representing the post-earthquake repairability of structures. The larger the residual deformation is, the more difficult it is to repair. When the residual deformation exceeds the allowable value, the structure cannot be desirably repaired and can only be demolished [1-3]. For example, due to the excessive residual drifts, dozens of reinforced concrete buildings in Mexico City couldn’t be repaired and had to be demolished after the 1985 Michoacan earthquake. In 1994 California Northridge earthquake and 1995 Kobe earthquake, a large number of beam-column connections of traditional steel frames suffered brittle failures, which is always initiated at the welds of beam flanges and column flanges, the plasticity in these places is poor [4]. After the earthquakes, a lot of experts and scholars have also modified this kind of traditional welded connections, but it always needs high cost, and the modified connections would result in residual deformation and destruction to the structure under the major earthquakes. Likewise, after Wenchuan earthquake in 2008, many frame columns and bridge piers couldn’t be repaired due to the excessive residual deformations [3, 5, 6].
The Chinese current Code for seismic design of buildings (GB50011-2010) [7] use the calculation of bearing capacity under frequent earthquakes and elasto-plastic deformation under rare earthquakes to ensure the structure not to collapse. But it only gives a qualitative description to the repairability of structures under strong earthquakes and has no specific design parameters and design methods. Surveys of earthquake damages indicate that the structure designed according to this method can be ensured not to collapse under strong earthquakes, but it may suffered excessive residual deformations and need to be rebuilt, thus leading to a serious social economic loss [7, 8].
The research on structure residual deformation after earthquakes has been focused by more and more foreign and domestic scholars. This is mainly because a small residual deformation can greatly reduce the technical difficulties and economic investment on repairing structure, and the residual deformation is an important parameter of structural performance after the earthquakes. In addition, the residual deformation can also be taken as a quantitative design index [8]of “repairable under moderate earthquakes” in the Code (GB50011-2010).
Kawashima et al. [1] studied the residual drifts of different single degree of freedom (SDOF) systems with different natural periods, damping ratios, ductility coefficients, stiffness ratios under different ground motion inputs. The results showed that the residual drifts were mainly affected by the post-yield stiffness. MacRae and Kawashima [9] pointed out that the stiffness ratio of bilinear SDOF system had a significant influence on the residual drift amplitude. And Christopoulos and Pampanin [10] stated that the residual drift amplitude may be also influenced by the hysteretic behavior. Recently, Ruiz-Garcia and Miranda [11] researched the nonlinear SDOF systems whose lateral strengths were known, and the results indicated that the residual drifts of systems were very sensitive to the stiffness ratio and the unloading stiffness of stiffness-degrading systems. Erochko et al. comparatively investigated the residual drift response of special moment-resisting frames (SMRFs) and buckling-restrained braced (BRB) frames, obtained the peak drift response and residual drift response of the two systems, and then gave the estimation formulas for the residual drift respectively [12].
By use of the program BISPEC, Li and Zhu [13] selected 45 near-fault seismic records with pulse to analyze the time-history response and the residual displacement ratio of a bilinear SDOF structure with different natural periods, ductility coefficients, bilinear factors, and put forward a residual displacement ratio spectrum with pulse ground motions in near-fault zones. OuYang and Liu [14] investigated the residual deformation of SDOF systems by the elasto-plastic time history analysis. They explored the influence of hysteretic models, natural periods, ductility factors and damping ratios on the residual deformation, obtained the governing factors and analyzed its mechanism. Gong et al. [2] studied the relationship between the results of pushover analysis and elasto-plastic time history analysis for a SDOF system, as well as the relationship between the average maximum residual deformation and the maximum plastic deformation under 100 normalized recorded ground motions, and gave the corresponding calculation formula. Zhang et al. [3] analyzed the effects of different parameters on seismic residual deformation based on the statistical analysis of elasto-plastic seismic responses for SDOF system, and put forward simplified calculation methods for estimating residual deformations which is applicable to the Kinematic and Takeda hysteresis models respectively. On the basis of 18 earthquake intensity indices and 60 seismic records, Hao et al. [8] chose bilinear SDOF systems and calculated the correlation coefficient between each intensity index and residual deformation index, studied the change of coefficient along with natural periods. The results showed that the correlation coefficient was greatly affected by the strength reduction factor, and was little affected by the post-yield stiffness factor, and some indices like the velocity type strength index of PGV exhibited the best correlation to the residual deformations.
Although domestic and foreign scholars have extensively studied the residual drifts, their researches mainly focus on SDOF systems, and few researches have been centered around the residual drifts of multi-degree-of-freedom systems. In this paper, on the basis of a large number of nonlinear finite element analyses, a systematic research is conducted on the peak drifts, the residual drifts under the action of moderate earthquakes and major earthquakes for five steel frames between 2 and 10 stories in height, and a calculation formula about estimating the residual drift is put forward for the steel frame structure.
2. Parameters of steel frame structure
The building is a steel frame with the story height of 4.2 m. The floor and roof both use the profiled steel sheet and cast-in-situ concrete composite structure, and the thickness of slab is 100 mm. The floor and roof dead loads are 4.5 kN/m2, the floor live load is 2.0 kN/m2, the roof live load is 0.5 kN/m2, and the snow load is 0.3 kN/m2. The seismic fortification intensity is 8 degree and the site condition is II. The design earthquake classification is the 1st group. The floor plan and elevation are shown in Fig. 1-2 respectively.
Fig. 1Floor plan of structure
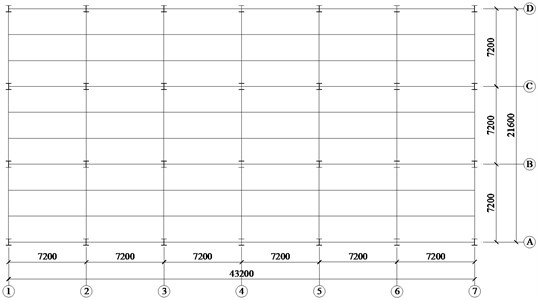
Fig. 2Elevation of structure
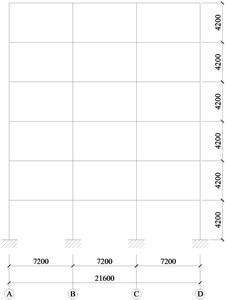
Table 1Steel frame characteristics
Stories | / s | / s | / kN | / kN | / G | / kN | / kN | / G | / kN |
2 | 0.906 | 0.303 | 1676.765 | 113.982 | 0.068 | 331.530 | 413.370 | 0.247 | 472.120 |
4 | 1.777 | 0.638 | 3479.454 | 130.484 | 0.038 | 407.790 | 490.240 | 0.141 | 630.680 |
6 | 2.32 | 0.826 | 5304.325 | 189.703 | 0.036 | 409.890 | 549.360 | 0.104 | 740.430 |
8 | 2.896 | 1.017 | 7145.477 | 242.379 | 0.034 | 479.810 | 611.050 | 0.086 | 851.410 |
10 | 3.49 | 1.266 | 9033.921 | 289.264 | 0.032 | 687.350 | 798.330 | 0.088 | 949.070 |
Table 2Member sections of beam and column
Steel frame | Story | Beam section | Column section | |
Exterior column section | Interior column section | |||
2 stories | 1~2 | H330×160×14×20 | H250×250×10×12 | H270×270×12×16 |
4 stories | 1~2 3 4 | H350×160×14×20 H330×160×14×20 H310×160×14×20 | H280×280×12×16 H240×240×12×16 H230×230×10×12 | H300×300×16×20 H240×240×12×16 H230×230×10×12 |
6 stories | 1~2 3~4 5 6 | H360×160×14×20 H340×160×14×20 H330×160×14×20 H310×150×14×20 | H360×360×12×16 H290×290×12×16 H260×260×12×16 H230×230×12×14 | H400×400×18×22 H330×330×16×20 H260×260×12×16 H230×230×12×14 |
8 stories | 1~2 3~4 5~6 7 8 | H380×160×14×20 H360×160×14×20 H340×160×14×20 H320×160×14×20 H300×160×14×20 | H400×400×14×18 H350×350×12×16 H300×300×12×16 H280×280×12×16 H250×250×12×16 | H460×460×20×24 H380×380×18×22 H320×320×16×20 H280×280×12×16 H250×250×12×16 |
10 stories | 1~2 3~4 5~6 7~8 9 10 | H380×180×14×20 H360×180×14×20 H340×180×14×20 H300×180×14×20 H280×180×14×20 H260×180×14×20 | H440×440×16×20 H380×380×16×20 H340×340×16×20 H300×300×14×18 H280×280×12×16 H250×250×12×16 | H520×520×22×26 H420×420×22×26 H360×360×22×26 H320×320×18×22 H280×280×12×16 H250×250×12×16 |
In order to consider the effects of structural height on residual drifts, the floor plan of the above structure remains the same, and only the height changes, five steel frames with 2, 4, 6, 8, 10 stories in height are designed as examples according to the Code (GB50017-2003) [15] and Code (GB50010-2010) [7]by the software PKPM. The basic design parameters of steel frames are shown in Table 1. The welded H-shaped sections are selected for both beams and columns and the material types are defined as Q235 whose yield strength is 235 MPa. The elasticity modulus is 200000 MPa and the Poisson’s ratio is 0.3. The preliminary member sections are shown in Table 2.
3. Nonlinear analysis and results
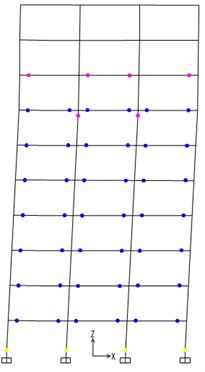
The finite element planar model of the above five steel frames were established by the software SAP2000 and the finite element model is shown in Fig. 3 (Take 8-story steel frame as an example). The frame sections are adopted for all the beams and columns. Each beam and column comprises only one element with two nodes. The steel frames are all rigidly connected. The column base is fixed.
Fig. 3Finite element planar model of 8-story steel frame
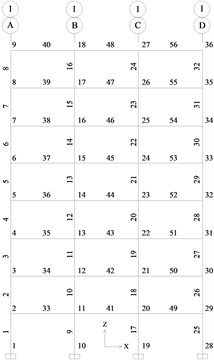
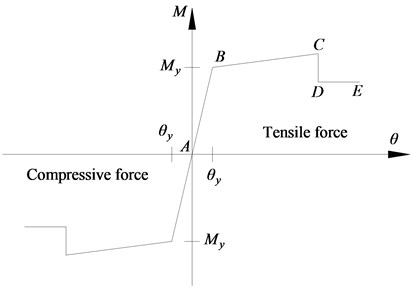
Fig. 4Constitutive relation of the hinge P-M-M
3.1. Pushover analysis results
The finite element planar model was established completely and the corresponding pushover analyses were performed. The hinge P-M3 is used to simulate the material nonlinearity of the frame columns, and the hinge M3 to simulate the nonlinearity of the frame beams. The constitutive relation of the hinge P-M-M is shown in Fig. 4. The vertical coordinate represents the bending moments and the horizontal coordinate represents the rotation. The mechanical behavior of plastic hinges can be determined in accordance with FEMA-356. During the pushover analysis, the material strength uses the average values, and the lateral force adopts the inverted triangular distribution pattern.
Figs. 5-9 show the locations of plastic hinges of the five steel frames at the time of ultimate capacity. From Figs. 5-9, the plastic hinges nearly form in the beams of each story except the top story. As for columns, there are plastic hinges occurring at both ends of columns for the 1st story in Figs. 5-6. While in Figs. 7-9, plastic hinges only appear at the bottom of columns for the 1st story.
The base shear-roof drift curve of the five steel frames are shown in Fig. 10. This, figure shows the points corresponding to the first yielding of members and the achievement of the design level interstory drift limit at each level. denotes the design base shear of steel frames. At the same time, Table 1 gives the parameters of pushover analysis, the base shear at the first yield, the base shear at the full yield, and the base shear at the story drift limit. Table 1 also gives the ratios of base shear to seismic weight (one is the design base shear, and the other is the base shear at the full yield). It can be seen from Table 1 that the steel frame structures have a certain design overstrength.
Fig. 5Plastic hinges of 2-story steel frame
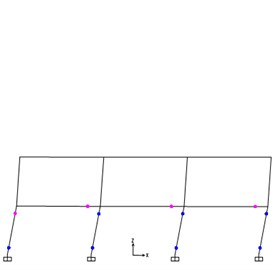
Fig. 6Plastic hinges of 4-story steel frame
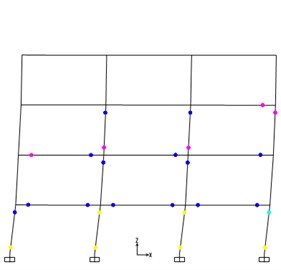
Fig. 7Plastic hinges of 6-story steel frame
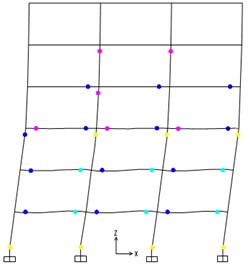
Fig. 8Plastic hinges of 8-story steel frame
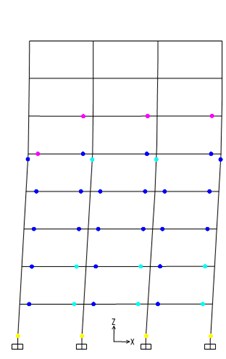
Fig. 9Plastic hinges of 10-story steel frame
3.2. Nonlinear time history analysis
3.2.1. Selection of ground motion records
The identical finite element model is used to perform the elasto-plastic time history analysis. The hinge P-M3 is used to simulate the material nonlinearity of the frame columns, and the hinge M3 to simulate the nonlinearity of the frame beams. The mechanical behavior of plastic hinges can be determined in accordance with FEMA-356. The peak value of the earthquake accelerograms in the time history analysis is determined by the current seismic code (GB50011-2010) [7]. 22 earthquake records with different frequency contents are selected as ground motion inputs from the U.S. Pacific earthquake engineering research center (PEER) earthquake database and Chinese earthquake records. The selected earthquake waves are respectively Cape (0163), Elcentro, Lanzhou wave 1, Artificial wave 2, Artificial wave 4, Taft, Chichi, Loma (0915), Coalinga and Landers, Duzce, North, Erz, Imperial, Loma (0247), Parke, San, Koca, Bor, Smart, Tabas, Cape (0178) as shown in Table 3.
Fig. 10Pushover analysis results
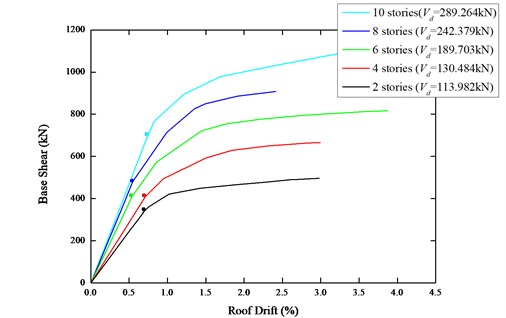
Table 3Earthquake wave input
Records | Sequence name | Date | PGA (g) | Duration (s) |
1 | Cape Mendocino (0163) | 1992.4.25 | 0.163 | 36.000 |
2 | Elcentro | 1940.5.18 | 0.349 | 30.000 |
3 | Lanzhou wave 1 | – | 0.200 | 20.000 |
4 | Artificial wave 2 | – | 0.200 | 20.000 |
5 | Artificial wave 4 | – | 0.200 | 20.000 |
6 | Taft | 1952.7.21 | 0.225 | 54.360 |
7 | Chichi | 1999.9.20 | 0.173 | 60.000 |
8 | Loma (0915) | 1989.10.18 | 0.195 | 39.950 |
9 | Coalinga | 1983.5.2 | 0.147 | 40.000 |
10 | Landers | 1992.6.28 | 0.109 | 60.000 |
11 | Duzce | 1999.11.12 | 0.348 | 25.885 |
12 | Northridge | 1994.1.17 | 0.424 | 24.440 |
13 | Erzikan | 1992.3.13 | 0.515 | 21.310 |
14 | Imperial | 1940.5.19 | 0.215 | 40.000 |
15 | Loma (0247) | 1989.10.18 | 0.247 | 39.090 |
16 | Parkfield | 1966.6.28 | 0.476 | 43.690 |
17 | San Fernando | 1971.2.9 | 0.210 | 28.000 |
18 | Kocaeli | 1999.8.17 | 0.136 | 30.000 |
19 | Borrego Mountain | 1968.4.9 | 0.130 | 40.000 |
20 | Taiwan Smart1 | 1986.11.14 | 0.153 | 40.000 |
21 | Tabas | 1978.9.16 | 0.107 | 35.000 |
22 | Cape Mendocino (0178) | 1992.4.25 | 0.178 | 44.000 |
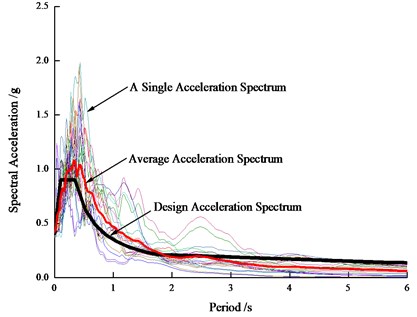
Because the research object is the post-earthquake residual drift response of steel frame structures, therefore an acceleration period with a length of 25 s and an amplitude of 0 is artificially added to the end of each ground motion, to ensure the structure freely decay to a steady state after earthquakes [8,12]. All these records are scaled to match the design acceleration response spectrum. Two different earthquake levels are considered: one is the moderate earthquake with a 10 % probability of exceedance in 50 years, and the other is the major earthquake with a 2 % probability of exceedance in 50 years. The acceleration response spectra of all earthquake records and the average response spectrum are compared to the design acceleration spectra shown in Figs. 11-12. It can be seen from Fig. 11 and Fig. 12 that the average response spectra of selected seismic records within 0.2 s-1.8 s are slightly higher than the design response spectrum specified in the code, and however it is slightly lower than the design response spectrum within 1.8 s-6.0 s.
Fig. 11Response spectra under moderate earthquake
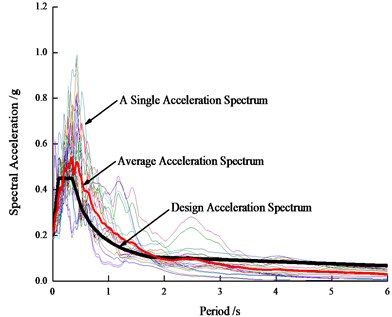
Fig. 12Response spectra under major earthquake
3.2.2. Peak drift and residual drift
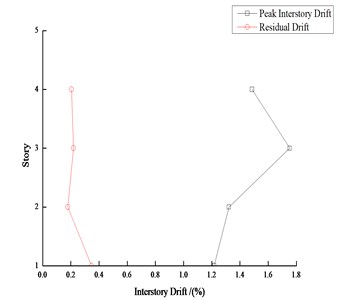
Take 4-story and 8-story steel frames as samples, the interstory drifts under moderate earthquakes and major earthquakes are shown in Fig. 13 and Fig. 14 respectively. The average peak story drift and average residual drift of each story under 22 earthquake records are also shown. It can be seen from Fig. 13 and Fig. 14 that the residual drift is usually a percentage of the peak drift, and the residual drift is closer to the peak drift when the peak drift is large.
Fig. 13Peak interstory drift and residual drift response of 4-story steel frame
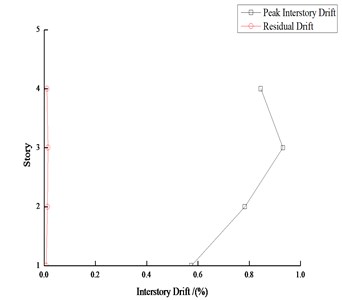
a) Moderate earthquake
b) Major earthquake
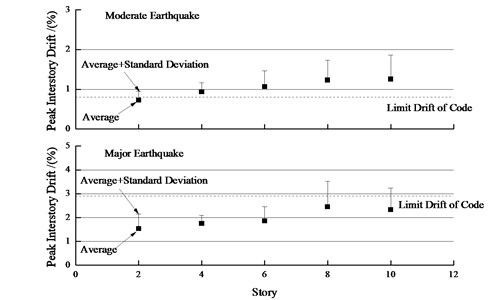
The mean peak interstory drifts of all steel frames under moderate earthquakes and major earthquakes are shown in Fig. 15. As for 2-story and 4-story steel frames, both frames underwent collapse due to the lateral dynamic instability or excessive drifts under 3 seismic waves, so these three groups of data have been removed. From Fig. 15, for a moderate earthquake level the 10-story steel frame has the maximum peak drift. The peak drift approximately converges to the same value with the increase of structural height. The scatter in the peak drift increases with increasing the height (Fig. 15 shows the average plus the standard deviation). For a major earthquake level, the 8-story steel frame structure has the maximum peak drift. The peak drifts of different-height frame structures tend to converge with the increase of height, and the scatter in the peak drift approximately increases with the height. Additionally, under moderate earthquakes, the peak drift of 2-story structure is less than the limit value 0.8 % specified in General Rule for Performance-based Seismic Design of Buildings (CECS 160:2004) [16]. The peak drifts of the 4-, 6-, 8-, 10-story steel frame structures are approximately 0.93 %-1.25 %, which are slightly larger than the limit. Under major earthquakes, the peak drifts of 2-, 4- and 6-story structures are less than the limit value 2 % in Code (GB50011-2010), the peak drifts of 8- and 10-story structures are 2.33 %-2.45 %, which are larger than the limit value in seismic code, but less than the limit value 2.9 % in General Rule.
Fig. 14Peak interstory drift and residual drift response of 8-story steel frame
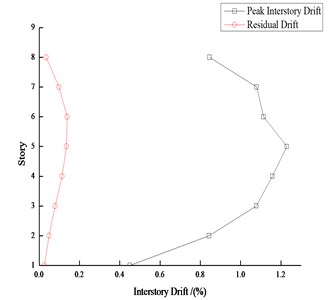
a) Moderate earthquake
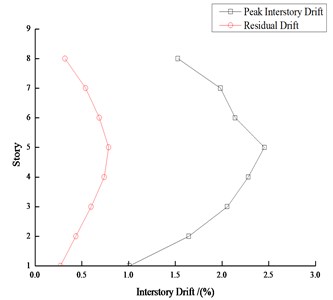
b) Major earthquake
Fig. 15Mean peak interstory drifts
Under the moderate and major earthquakes, the average residual drift responses of all steel frames are indicated in Fig. 16. Under the moderate earthquakes, the steel frame structures experience small residual deformations, the maximum residual drift is about 0.02 %-0.16 %, and the value is about 0.27 %-0.79 % under the major earthquakes. The existence of residual drifts indicate that the steel frame structures have suffered potential damages, which likely enables the structures not to be repaired to their serviceable state after the earthquakes. Furthermore, the residual drifts tend to approximately increase linearly with the height of structure. In short, the residual drifts have a high variability, the standard deviations are almost in the same magnitude with the average residual drift, the research results of Ruiz-Garci also reflect that the residual drifts have a high variability [17, 18].
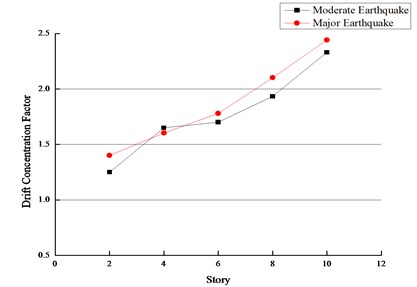
In order to assess the damage concentration degree of steel frame structures, the drift concentration factor (DCF) is defined, which is the ratio of the peak interstory drift to the maximum roof drift. MAcRae [19]have calculated DCFs of different structural types and heights. In this research, the calculated average value of DCFs are shown in Figs. 10-11. While the DCF is 1.0, it means that the peak story drift at each story is the same. The DCF of steel frame structures approximately proportionally increases with the building height. The increase of DCF is mainly due to the increase of - effect, resulting in the drift localization in the lower stories in which the gravity load is the largest. From Fig. 17 and Fig. 18, it can also be observed that the DCF is not significantly influenced by the ground motion intensity.
Fig. 16Mean maximum residual drifts
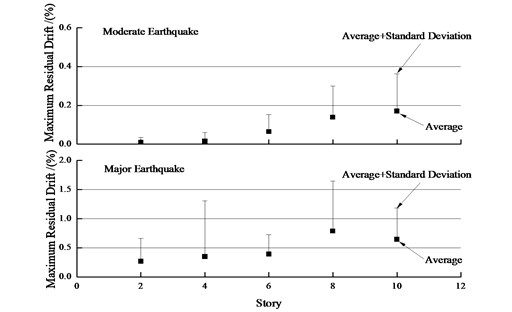
Fig. 17Drift concentration factor of peak drift
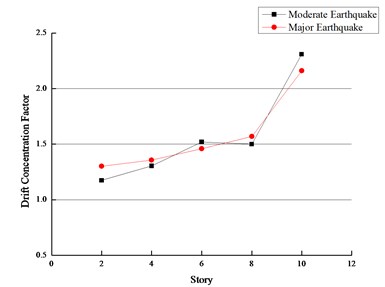
Fig. 18Drift concentration factor of residual drift
4. Calculation of residual drift
Fig. 19 shows the data between the peak drift and the residual drift under each earthquake excitation for the five steel frames. The diagonal line whose slope is 1.0 indicates that the residual drift is equal to the peak drift . The second diagonal line shows that the residual drift is equal to the peak drift minus the recoverable elastic drift , which can be recovered at the end of the loading cyclic. This straight line denotes the theoretical maximum residual drift which may occur in the structural system. In this case study, the elastic drift approximately equals 0.7 %, which is slightly larger than the limit 0.4 % in Code (GB50011-2010). The size of circles in the figure represents different heights of structure, and the larger circles represent the higher steel frames.
Fig. 19 also shows that the residual drift can be approximately calculated by the value of peak drift minus recoverable elastic drift. This regularity is essentially suitable for all peak drifts but is more critical for larger peak drifts because the - effect has a significant influence on the structural response. When the peak drift is low, the data points in the figure are far away from the theoretical maximum points. Because the - effect is so small that the seismic excitation can easily push the structure back to the opposite direction when the structure reached a certain peak drift, thus reducing the residual drift. With the increase of building height, the data points will be closer to the diagonal line denoting the theoretical maximum residual drift.
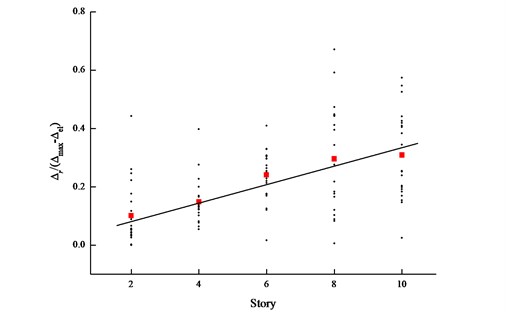
The influence of the structural height on residual drift is shown in Fig. 20. It shows the ratio of residual drift to peak drift minus the elastic drift. When this ratio reaches 1.0, the residual drift attains the theoretical maximum. The red squares in the figure represent the average of all points corresponding to the structural height, and the straight line is the linear fit for the average. Fig. 20 also shows that the scatter in the data concentrates near the theoretical maximum.
Fig. 19Residual drift versus peak drift of all stories
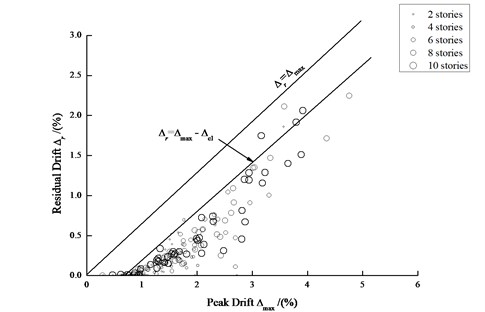
Fig. 20Residual drift divided by peak drift minus elastic drift versus height
On the basis of the above analysis, the maximum residual drift of a structure can be expressed as:
Because Eq. (1) gives the upper limit of residual drift according to the maximum elastic drift of structure, therefore, this equation is very useful from the viewpoint of performance based design. However, the average of the residual drift at each story are not only dependent on the recoverable elastic drift, but also on the peak drift and DCF.
The dependency relation between the residual drift and drift concentration factors DCF is shown in Fig. 21. By the linear fitting of the average values, the mean residual drift can be obtained as:
Under the moderate and major earthquakes, the mean residual drifts computed by Eq. (2) are shown in Figs. 22-23. It can be seen from the figures, Eq. (2) can reasonably estimate the mean residual drifts under the moderate and major earthquakes.
Fig. 21Residual drift versus drift concentration factor
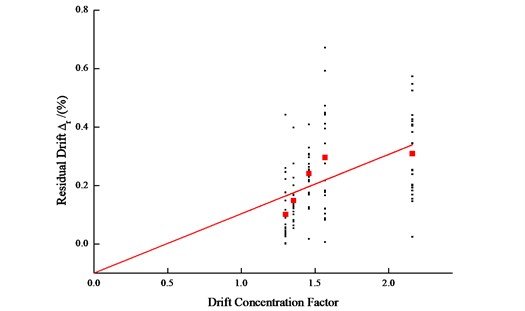
Fig. 22Estimation of residual drifts under moderate earthquake
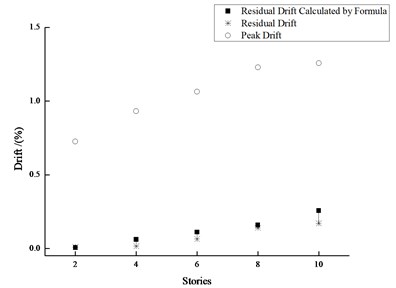
Fig. 23Estimation of residual drifts under major earthquake
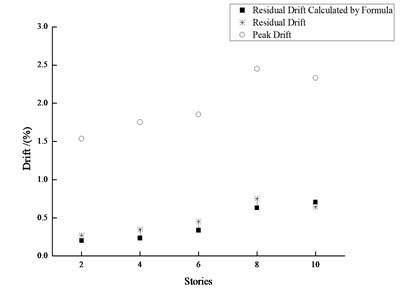
Besides, Eq. (2) can also be utilized to estimate the peak drift level which causes the mean residual drift of 0.5 %. This is an important performance level, because once this level is exceeded, the maintenance cost of the structure will be higher than the cost of reconstruction [20]. For the 4- and 6-story steel frame structures whose DCF is approximately 1.6, the corresponding peak drift is 2.26 % which induces the mean residual drift of 0.5 %. For 8-and 10-story steel frame structures whose DCF is approximately 2.0, its corresponding peak drift is 1.95 %. These peak drift values from Eq. (2) give an approximate mean residual drift, which means that approximately half of the earthquakes produced residual drifts greater than this mean. To ensure the achievement of the 0.5 % residual drift level, Eq. (1) should be used instead, giving peak drifts of 1.2 % for all structural heights. All of these target peak values are smaller than the drift limit of 2.0 % specified in current Code (GB50011-2010).
5. Conclusions
1) The pushover analysis results indicate that the five different-height steel frames designed according to the current codes all have design overstrength.
2) Under the moderate earthquakes, the 10-story steel frame structure has the maximum peak drift. However, the peak drifts of the five steel frames approximately converge to the same value, and the variability of peak drift increases with the structural height. Under the major earthquakes, the 8-story steel frame structure has the maximum peak drift, the peak drifts of all steel frames tend to converge with increasing the height, and the scatter in the peak drift approximately increases with the structural height.
3) Under the moderate earthquakes, the five steel frame structures undergo small residual deformations, and the maximum residual drift is within 0.02 %-0.16 %. Under the major earthquakes, the value is approximately within 0.27 %-0.79 %. In addition, the residual drifts tend to approximately increase linearly with the structural height and have a large variability.
4) The prediction formulas of residual drift in this study is related to the peak drift, the recoverable elastic drift and the drift concentration factors, and it can permit a reasonable estimation of the mean residual drift for steel frame structures.
5) In this study, the preliminary researches on the residual drifts are performed for steel frames under strong earthquakes. However, the influence of such factors as the hysteretic models, unloading stiffness should be further investigated on the residual drift response of steel frames.
References
-
Kawashima K., Macrae G. A., Hoshikuma J. I., Nagaya K. Residual displacement response spectrum. Journal of Structural Engineering, Vol. 124, Issue 5, 1998, p. 523-530.
-
Gong J. X., Cheng L., Zhang Q. Statistical relationship between results of static nonlinear analysis and elasto-plastic time-history and calculation of residual deformation for structures. Journal of Building Structures, Vol. 32, Issue 12, 2011, p. 224-233, (in Chinese).
-
Zhang Q., Zhu J. C., Gong J. X. Post-earthquake residual deformation prediction of SDOF system. Journal of Civil, Architecture and Environmental Engineering, Vol. 35, Issue 3, 2013, p. 32-41, (in Chinese).
-
Interim Guidelines. Evaluation, Repair, Modification and Design of Welded Steel Moment Frame Structures. Rep. No. FEMA-267, Federal Emergency Management Agency, Washington, D.C., 1995.
-
Gong J. X., Zhang Q., Wang X. T. Overview on current bridge seismic design approach in home and abroad codes based on survey of Wenchuan earthquake. Journal of Highway and Transportation Research and Development, Vol. 27, Issue 9, 2010, p. 44-54, (in Chinese).
-
Sun Z. G., Wang D. S., Li H. N., Guo X., Si B. J., Wang Q. X. Damage investigation of RC frames in Wenchuan earthquake and suggestions for post-earthquake rehabilitation. Journal of Natural Disasters, Vol. 19, Issue 4, 2010, p. 114-123, (in Chinese).
-
Code for Seismic Design of Buildings. GB50011-2010, China Architecture and Building Press, Beijing, China, 2010.
-
Hao J. B., Wu G., Wu Z. S. Correlation analysis between residual deformation of SDOF system and ground motion intensity indices. China Civil Engineering Journal, Vol. 46, Issue 6, 2013, p. 1-7, (in Chinese).
-
MacRae G. A., Kawashima K. Post-earthquake residual displacements of bilinear oscillators. Earthquake Engineering and Structural Dynamics, Vol. 26, Issue 7, 1997, p. 701-716.
-
Christopoulos C., Pampanin S. Towards performance-based seismic design of mdof structures with explicit consideration of residual deformations. ISET Journal of Earthquake Technology, Vol. 41, Issue 1, 2004, p. 53-73.
-
Ruiz-Garcia J., Miranda E. Inelastic displacement ratios for evaluation of existing structures. Earthquake Engineering and Structural Dynamics, Vol. 32, Issue 9, 2003, p. 1237-1258.
-
Erochko J., Christopoulos C., Tremblay R., Choi H. Residual drift response of SMRFs and BRB frames in steel buildings designed according to ASCE 7-05. Journal of Structural Engineering, Vol. 137, Issue 5, 2011, p. 589-599.
-
Li F. B., Zhu X. Residual displacement ratio spectrum of single-degree-of-freedom bilinear structure under ground motions with pulse in near-fault zones. China Railway Science, Vol. 28, Issue 3, 2007, p. 49-55, (in Chinese).
-
OuYang C. X., Liu C. Residual displacement of SDOF system under earthquakes. World Earthquake Engineering, Vol. 26, Issue 1, 2010, p. 143-146, (in Chinese).
-
Code for Design of Steel Structures. GB50017-2003, China Architecture and Building Press, Beijing, China, 2003.
-
2004 General Rule for Performance-based Seismic Design of Buildings. CECS 160, China Planning Press, Beijing, China, 2004.
-
Ruiz-Garcia J., Miranda E. Evaluation of residual drift demands in regular multi-story frames for performance-based seismic assessment. Earthquake Engineering and Structural Dynamics, Vol. 35, Issue 13, 2006, p. 1609-1629.
-
Ruiz-Garcia J., Miranda E. Residual displacement ratios for assessment of existing structures. Earthquake Engineering and Structural Dynamics, Vol. 35, Issue 3, 2006, p. 315-336.
-
MacRae G. A., Kimura Y., Roeder C. Effect of column stiffness on braced frame seismic behavior. Journal of Structural Engineering, Vol. 130, Issue 3, 2004, p. 381-391.
-
McCormick J., Aburano H., Ikenaga M., Nakashima M. Permissible residual deformation levels for building structures considering both safety and human elements. Proceedings of 14th World Conference Earthquake Engineering, Beijing, 2008.
Cited by
About this article

The author would like to acknowledge the financial support from the National Natural Science Foundation of China (Nos. 51678480, 51108035, 51208058, 51178388), the Natural Science Basic Research Plan in Shaanxi Province of China (No. 2016JM5007, No. 2013JM7030), and the Special Fund for Basic Scientific Research of Central College (No. 310828162017, No. 310828161009), Research Project of Shaanxi Provincial Department of Education (No. 14JK2073).
