Abstract
Pushover analysis has become one of the most commonly used nonlinear static procedures (NSP) for the seismic estimation of structures in engineering practice. In this paper, a new lateral load pattern is presented to enhance the accuracy of conventional pushover analysis (CPA) procedures for evaluating seismic behaviors of asymmetric-plan multistory buildings, which has considered the effect of torsion and higher modes. This spatially distributed lateral load pattern is proposed eventually by introducing and calculating the coefficients of adjustment and distribution respectively. The performance and accuracy of the proposed spatial pushover analysis (SPA) procedure is verified against two distinct multistory buildings with irregular plans subjected to five medium-to-strong ground motions. Furthermore, the peak responses in terms of base shear, roof displacements, interstory drifts, plastic hinge rotations and pushover capacity curves obtained from the SPA method are compared with those from nonlinear time history analyses (NTHA), and CPA procedures. The comparative results indicate that new lateral load pattern agrees very well with the NTHA procedure. The proposed SPA procedure shows its efficiency and overcomes the limitations of current extended pushover methods to assess the seismic responses of asymmetric-plan structures. It is strongly suggested that the new load pattern as an applicable method for pushover analysis of asymmetric-plan structures.
Highlights
- New lateral load patterns proposed for pushover analysis of asymmetric-plan multistory buildings.
- The effect of torsion and higher modes are properly considered in the presented pushover procedure.
- Proposed lateral load pattern best predicts base shear, roof displacements, story drifts, plastic hinge rotations and other seismic behaviors of asymmetric-plan structures.
1. Introduction
Recently, pushover analysis has been extensively used as a simplified tool for estimating seismic behaviors of virtually every type of building. Due to its simplification and accuracy, the pushover analysis is gaining increasing popularity among numerous engineers and researchers. Pushover analysis can provide the potential damage mechanism of structures subjected to intense earthquakes, so as to determine the weak members quickly and reliably. Reasonable selection of lateral load pattern is more significant than the determination of target displacement during pushover analysis. Several recommended invariant lateral load patterns are derived from Federal Emergency Management Agency (FEMA) report [1], including uniform, inverted triangular and first-mode vibration distribution. Despite of extensive applications in practical engineering, the CPA procedures are unable to estimate the general responses of high-rise asymmetric-plan structures due to ignoring the effect of higher modes and torsion. Such above-mentioned load patterns may produce unacceptable misleading results when applied in tall buildings with irregular plans. Additionally, the seismic responses of asymmetric-plan structures are influenced by the principal factor, coupled translational-torsional effect. Therefore, it is essential to retrofit and extend an appropriate pushover analysis method for asymmetric-plan structures currently.
Numerous researchers had attempted to extend the NSP methods to asymmetric-plan structures in the past decades. Relevant work was provided in this literature. A modal pushover analysis (MPA) was developed by Chopra and Goel [2] by considering the contribution of higher modes, which was based on the structural dynamic theory. To develop the applicability of MPA procedure for asymmetric-plan structures, Lin and Tsai [3] put forward a three-degree-of-freedom (3DOF) MPA to effectively deal with the torsional behavior of irregular buildings. Reyes and Chopra [4] extended MPA procedure to 3D analysis of asymmetric-plan buildings subjected to bidirectional horizontal ground excitations. Olivito and Porzio [5] has been aimed at developing a coupled numerical-geometrical methodology to represent the results arising from pushover analysis, by considering an appropriate number of Boundary Control Points (BCPs) that envelop the shape of the investigated structure. Erduran [6] carried out an investigation of current NSPs on the evaluation of torsion effects in low-rise frames. Kosmopoulos and Fardis [7] conducted pushover analyses and time history analyses respectively on four actual buildings in order to assess the coupling effect between lateral and torsional inelasticity. Shakeri and Tarbali [8] proposed a load pattern based on the height-wise distribution of the combined modal story shear and torsional moment. The proposed pushover procedure had been used to estimate the response of two frames with 9 and 20 stories. Tirca and Chen [9] proposed an innovative system labeled zipper braced frames with elastic zipper columns and a method for zipper column design based on the use of invariant load patterns. Manoukas and Avramidis [10] established a new multi-mode pushover procedure in which the equivalent single-degree-of-freedom (SDOF) system was created based on the assumption that the two components of the biaxial seismic excitation were proportional to each other. Recently, Bhatt and Bento [11] presented an improvement of the capacity spectrum method (CSM) procedure to overcome the torsional problem in asymmetric-plan buildings. Kreslin and Fajfar [12, 13] extended the idea for asymmetric high-rise buildings to consider higher mode effects in elevation using an approach that is consistent with the extended N2 method proposed for irregular buildings. Khoshnoudian and Kiani [14] proposed a modified consecutive modal pushover procedure (MCMP) to estimate the seismic demands of two-way asymmetric-plan tall buildings under two horizontal components of earthquakes simultaneously. Cimellaro et al. [15] proposed a bidirectional pushover analysis (BPA) method to overcome the limitations of current pushover methods to assess the seismic responses of irregular buildings subjected to bidirectional ground motions. However, the need for retrofitting existing lateral load patterns for pushover analysis of asymmetric-plan buildings was also critical. Following up on the investigations of the above-mentioned researchers, the simplification strategies in current pushover procedures affect their accuracies to some extent. Additionally, some of the methodologies require quite a complex analysis. Therefore, if the extended NSP procedures perform too complex, it is actually better to apply a more advanced method, like a spatial pushover analysis (SPA) procedure.
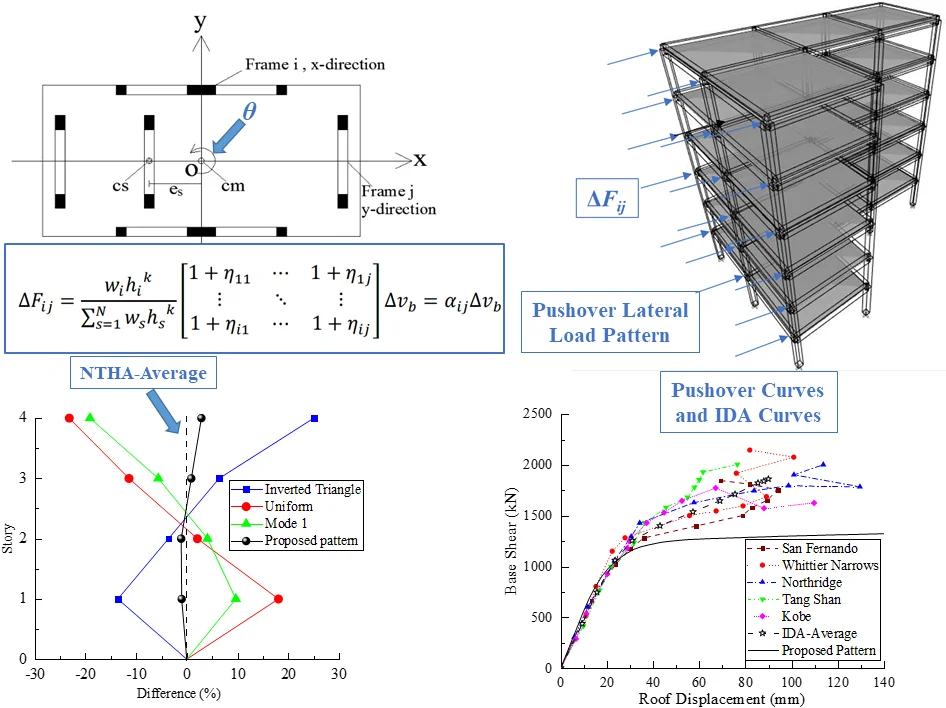
The main goal of this paper is to propose a new lateral load pattern as the SPA procedure to accurately and efficiently estimate seismic demands for 3D plan-irregular structural models under seismic ground motions. This load pattern consists of pushing an asymmetric-plan structure by imposing simultaneously in plan and elevation of frame the respective lateral load forces with beam-to-column nodes. Namely, the new pattern is consistent with practical distribution of inertia force of plan-irregular structure, so it can be applied when torsion effect needs to be considered in the analysis. The SPA procedure is aimed at minimizing the inaccuracies of conventional NSP methods in evaluating inelastic response of asymmetric-plan structures. The performance and serviceability of the SPA procedure are verified against two eccentric multistory buildings subjected to various ground motions. In order to facilitate the verification of proposed procedure, the mean response of the NTHA procedures is selected as the target roof displacement. Definitely, comparative results could demonstrate the efficiency and accuracy of the new load pattern in simulating the inertia force distribution of the studied models and predicting the plastic hinge rotations. It is also demonstrated that the SPA procedure has a similar degree of accuracy for estimating seismic behaviors for some types of irregular frames as it does for regular frames.
2. Simplification of torsional coupling effect
For a one-way eccentric multistory building with rigid diaphragms, it has 3DOFs per floor. The differential equation governing the elastic deformations under one-direction earthquake excitation can be expressed in Eq. (1):
where are the translational displacements in two horizontal directions and torsional response at the mass centre of each floor; [] is consisted of the translational and rotational mass submatrices, and , respectively; [] is consisted of the viscous damping submatrices; [] is consisted of the stiffness submatrices corresponding to the MDOF system; and is the ground acceleration.
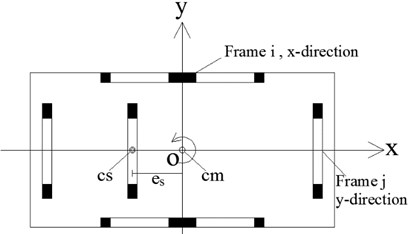
As can be seen, Eq. (1) is just used to calculate modal properties of the studied model and not the real governing equation of motion due to the sustain inelastic deformations of structures. Taking an assemblage of one-way asymmetric-plan structure as an example, the sketch of the typical floor is shown in Fig. 1. The centre of mass CM is located at the geometric centre of floor plan. The centre of stiffness CS is located on the -axis at a given distance from the CM. The model used represents a rigid floor slab, and it is approximated with systems of 3DOF.
Fig. 1Typical plan of asymmetric multistory building
According to the computing results obtained from Eq. (1), , where and are the translational displacements of and directions, respectively. is the torsional responses at the CM. The matrix of torsional modes could be formed as follows:
For most first-mode-dominated structures, the first column of content derived from the matrix represents the interstory rotation at the CM on each floor.
3. The spatial pushover analysis (SPA) analysis
According to the simplification of the coupling effect of translation and torsion, it is possible to rationally simulate the distribution of the inertia force of asymmetric-plan structures under earthquake excitations. Main sequential steps involved in the SPA procedure to estimate the seismic responses can be summarized as follows:
1) A 3D finite element analysis model is used with nonlinear force-deformation relationships for structural elements. Compute the first natural frequencies modes and modal participation factors , for linearly elastic of the model.
2) Determine and calculate the interstory rotation of asymmetric multistory building using the results of a response spectrum analysis (RSA).
3) Establish a new coordinate system by shifting the coordinate system (Fig. 1) to the CS. Thus, the horizontal distance to the CS of the th and th lateral resisting elements could be respectively expressed as the following:
4) Calculate the torsional effect contribution coefficient of each lateral resisting element. Namely, effective story stiffness consists of all pieces of frames in their or directions on the same floor. The additional inertia forces caused by torsion effect, and , can be determined as follows:
where , is the lateral resisting stiffness of th story vertical elements in the and -direction.
5) Normalize the torsion forces of irregular structure stories in step 4, a spatial matrix of lateral load adjustment coefficient is eventually obtained:
where is the lateral load adjustment coefficient of the th lateral resisting elements on the th story.
6) Distribute lateral load along the height of the building. In most cases, the SPA procedure is just applied in medium-rise buildings with asymmetric plans. Thus, ultimately presented spatial lateral load distribution (expressed in increments) that assigned to all beam-column nodes in building elevation is computed from the following:
where is the general lateral load distribution coefficient; is the height of base level to the th story; and is the fundamental period of structure; is the design base shear (expressed in increments); is the effective weight of the th story; is total number of stories.
7) In a few cases, for the high-rise building which is affected by higher mode vibrations, it is also critical to take this factor into account among lateral load distribution. Compute the equivalent mode shape of the th floor which is combined according to the simplified square root of sum of squares (SRSS) rule [16], which is expressed as:
where is the th modal value of the th floor during linearly elastic stage; is the modal participation factors of the th mode.
The ultimate spatial lateral load distribution (expressed in increments) which is generally suitable for high-rise asymmetric buildings could be expressed as the following:
where is the general lateral load distribution coefficient.
4. Case study
4.1. Description of buildings
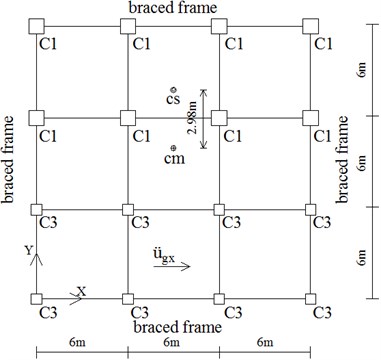
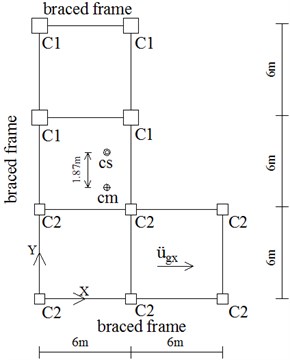
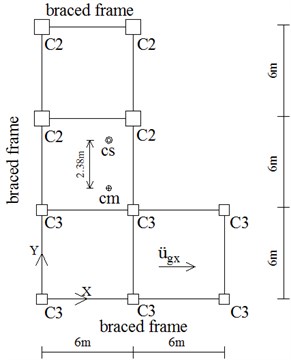
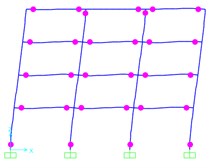
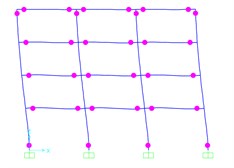
The NSPs and NTHAs are all applied to two different asymmetric-plan multistory RC buildings which have been designed according to the capacity design codes [17] for seismic design of structures. The two buildings are assumed to be rectangular plans with a floor dimension of 18 m by 18 m and L-shaped plans with a dimension of 18 m by 12 m. The typical story height of the buildings is assumed to be 3.3 m except for the first floor height of 4.2 m. The configurations of two buildings are shown as Fig. 2, and the building plans of typical floor are shown as Fig. 3 and Table 1. Each building is designed using square shape columns having the following dimensions, which range from 60 × 60 cm, 50 × 50 cm, to 40 × 40 cm (represented as C1, C2, and C3 respectively). All the beam sections are 25 × 50 cm. All the floor slabs are 12 cm thick.
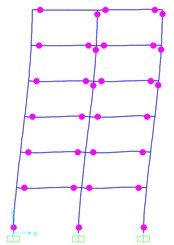
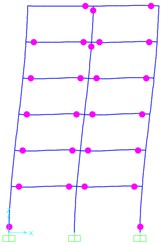
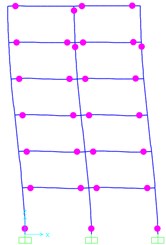
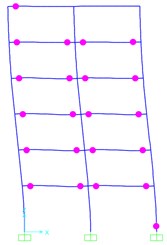
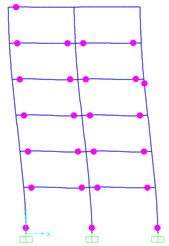
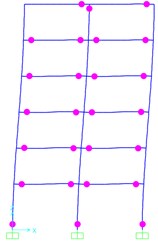
Fig. 2Configuration of two frames
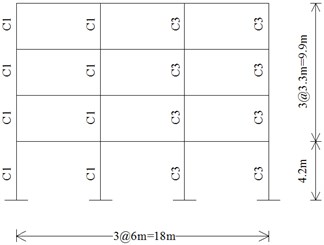
a) Elevation along line A (4-Story)
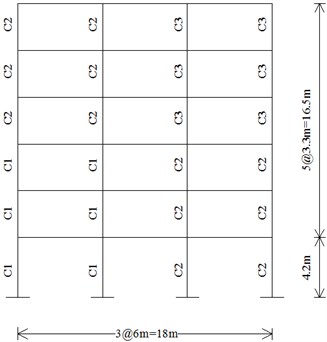
b) Elevation along line A (6-Story)
Table 1Structural details of two models
Seismic mass (for four-story model) | |
Story 1 | 1.85×10⁵kg |
Story 2-3 | 1.76×10⁵kg |
Roof | 1.88×10⁵kg |
Entire building (above ground) | 7.25×10⁵kg |
Seismic mass (for six-story model) | |
Story 1 | 1.40×10⁵kg |
Story 2-3 | 1.35×10⁵kg |
Story 4-5 | 1.27×10⁵kg |
Roof | 1.44×10⁵kg |
Entire building (above ground) | 8.08×10⁵kg |
For both of the two buildings, their CM are basically located at the centroid of the each story, also the geometric center. The floor mass distribution could be regarded as uniform and symmetric. As for the centre of stiffness, for 4-Story model, its CS was shifted in the longitudinal direction by 2.98 m, about 16 % of the plan dimension; for 6-Story model, its CS was respectively shifted in the longitudinal direction by 1.87 m and 2.38 m, about 10 % and 13 % of the plan dimension. Thus, these two frames are all symmetric about the -axis but asymmetric about -axis. The eccentricity between the CM and CS is chosen to be along the -axis, greater than or equal to 10 % of the plan dimension. The two models can be regarded as unidirectional eccentricity structures. The irregularity parameters of the two models are listed in Table 2.
Fig. 3Typical plan view of two asymmetric buildings
a) Typical floor plan (4-Story)
b) 1st-3rd floors plan (6-Story)
c) 4th-6th floors plan (6-Story)
Table 2Irregularity parameters for two models
Structural plan | Eccentricity (mm) | Eccentricity ratio (%) |
4-Story (floor 1-4) | 2980 | 16.6 |
6-Story (floor 1-3) | 1875 | 10.4 |
6-Story (floor 4-6) | 2380 | 13.2 |
The two models will undergo coupled -lateral and torsional responses due to the -direction ground motion, which is the focus of this paper. Once the structure is modeled on section properties, concrete content and the loads on it, default hinges are assigned to columns and beams [18, 19]. The Rayleigh damping matrix is defined to maintain the modal damping ratio equal to 5 %, as for the asymmetric frame. In various proposed NSPs, the target roof displacement is equal to the mean displacements of the NTHAs. All mean displacements are measured at the CM and, in all NSPs, various lateral load patterns are applied in the CM in per floor besides the proposed SPA lateral load is assigned in all beam-column nodes in building elevation. The characteristics, natural periods and modal participating mass ratio are provided in Table 3.
Table 3Modal properties of studied models
Model | 4-Story | 6-Story | ||||
Mode | 1 | 2 | 3 | 1 | 2 | 3 |
Period (s) | 0.603 | 0.553 | 0.485 | 0.831 | 0.782 | 0.724 |
Modal mass (%) | 31.7 | 30.0 | 29.4 | 39.9 | 36.8 | 14.7 |
4.2. Ground motion
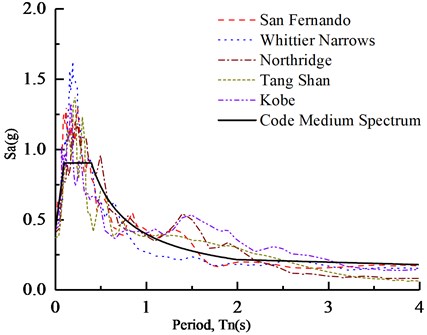
To investigate the feasibility of the SPA procedure authentically, seismic excitations used for NTHA are defined by a set of five ground motion. Details of five medium-to-strong ground motion records obtained from ground motion database [20] have been listed in Table 4. The 5 % damped pseudo-accelerations spectra for the selected earthquake records, and the code design spectrum were illustrated in Fig. 4. The incremental dynamic analyses (IDAs) of two models subjected to five earthquake excitations were carried out. A total of five NTHAs were conducted for each model. The peak accelerations of ground motions were scaled to 1.0 g to guarantee the structural deformations in the nonlinear region.
Table 4Summary of the ground motions
No. | Earthquake | Year | Recording station | Magnitude | PGA (g) |
1 | San Fernando | 1971 | Hollywood Stor | 6.6 | 0.225 |
2 | Whittier Narrows | 1987 | Eaton Canyon | 5.9 | 0.227 |
3 | Northridge | 1994 | 090 CDMG 24278 | 6.7 | 0.568 |
4 | Tang Shan | 1976 | Beijing Hotel | 7.8 | 0.057 |
5 | Kobe | 1995 | Shin-Osaka | 6.9 | 0.345 |
Fig. 4Scaled pseudo-acceleration response spectra for 5 % damping
5. Results and discussion
5.1. Comparative evaluation of the NSPs
In this paper, results obtained from the SPA procedure are initially compared with NSPs recommended by FEMA-356 [21] which are considered as conventional lateral load patterns. Applying several lateral load patterns commonly considered, including first-mode vibration distribution (Mode 1), uniform distribution, and inverted triangular distribution, as well as the proposed lateral load pattern. The pushover curves under three conventional lateral load patterns and the SPA procedure are shown in Fig. 5 respectively.
Fig. 5The pushover curves of a) 4-Story and 6-Story obtained from four different lateral load patterns
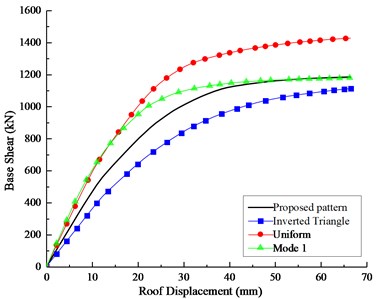
a)
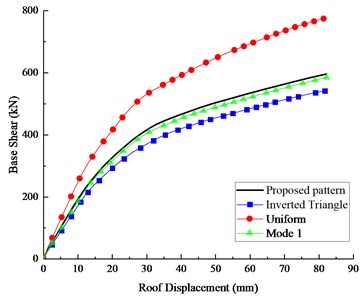
b)
Fig. 5(a) shows differences among four pushover curves, due to the torsion effect, only the proposed lateral pattern from the SPA procedure could achieve reasonable results in asymmetric-plan systems. Furthermore, as the upper and lower band of the pushover curves respectively, uniform distribution and triangular distribution properly verifies the rationality of the proposed lateral pattern. The same conclusion could be found in the related paper. Fig. 5(b) shows a good coincidence among of the capacity curves obtained from the SPA procedure and Mode1 distribution patterns. Generally, the proposed load pattern is a more appropriate pattern than the conventional lateral load patterns recommended by FEMA for asymmetric buildings.
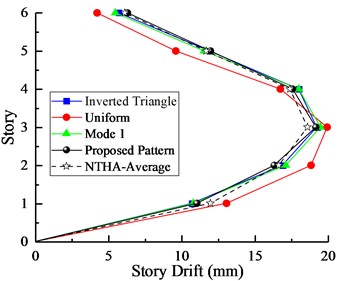
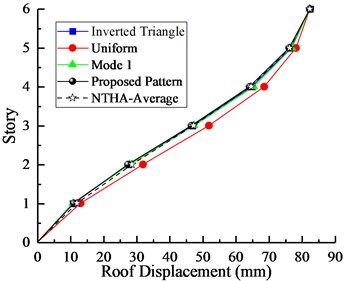
The interstory drift responses and roof displacements of the two studied models under several lateral load patterns are shown in Figs. 6-7, respectively.
Fig. 6Comparison of a) peak interstory drifts and b) roof displacements between NSPs and NTHA for 4-Story model
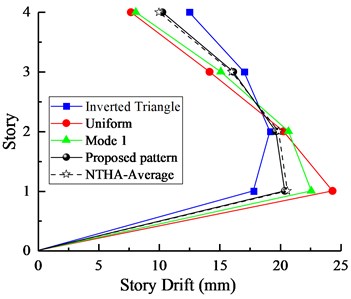
a)
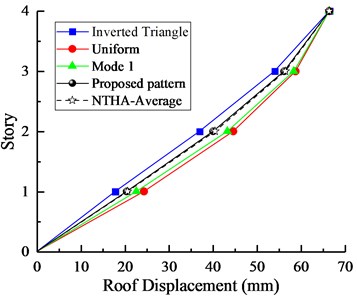
b)
As can be seen from Figs. 6-7, comparative results illustrate that both peak interstory drifts and roof displacements are generally well represented by the proposed lateral pattern that is closely analogous to the mean of nonlinear time history analyses (NTHA-Average). The three other patterns overestimated or underestimated the interstory drifts on each floor. It is clear from the findings that the proposed SPA procedure for evaluating the seismic responses of asymmetric-plan buildings is significantly better than those of conventional patterns.
Fig. 7Comparison of a) peak interstory drifts and b) roof displacements between NSPs and NTHA for 6-Story model
a)
b)
5.2. Comparison of the SPA method and NTHA
The pushover curves obtained from the SPA procedure with the proposed lateral load pattern are compared to the capacity curves obtained from the incremental dynamic analysis (IDA) as an exact solution. In the first phase, the IDAs of two studied cases subjected to five earthquakes are carried out. The results of this comparison for 4-Story and 6-Story frames are illustrated in Fig. 8.
As can be seen from IDA capacity curves in Fig. 8, the nearly identical results are obtained in the linearly elastic region under weak and medium ground motions. The stiffness of structure is gradually reduced in the nonlinear region for medium-to-strong motions. Furthermore, Fig. 8 shows a good coincidence among of the pushover curves and IDA curves in the linear region for both two structures. With the increasing of peak ground acceleration (PGA) value, the figure shows that energy depreciation of the structure is smaller than its real results obtained from IDAs. However, the overall development trend of pushover curve is also consistent with IDA curves, capacity curve obtained from the SPA procedure could illustrate the ductility of structure to some extent.
Fig. 8The capacity curves of a) 4-Story and b) 6-Story models for the proposed load pattern and IDAs
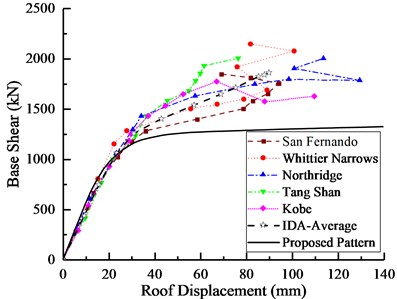
a)
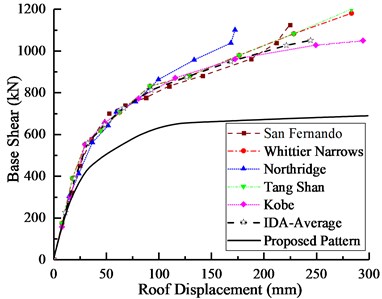
b)
In the second phase, peak responses of the NTHAs for five ground motions are recorded. The interstory drifts obtained from the pushover analysis are compared with those provided by the NTHAs. The mean of the seismic responses was used as the target demand to estimate the accuracy and suitability of the proposed SPA procedure. The interstory drifts and roof displacements of the two studied models subjected to various earthquakes are shown in Figs. 9-10, respectively.
Fig. 9Nonlinear time history analysis results for 4-story model: a) story drifts, b) roof displacements
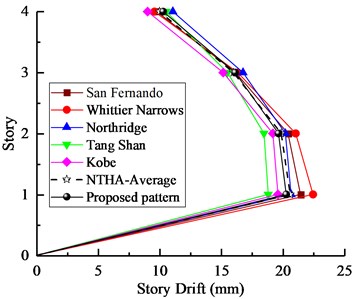
a)
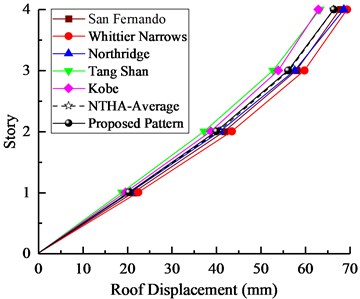
b)
Fig. 10Nonlinear time history analysis results for 6-story model: a) story drifts, b) roof displacements
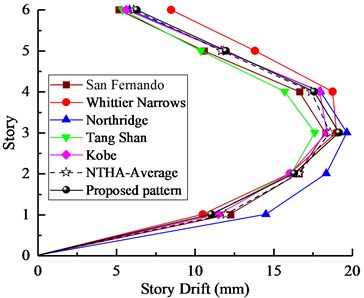
a)
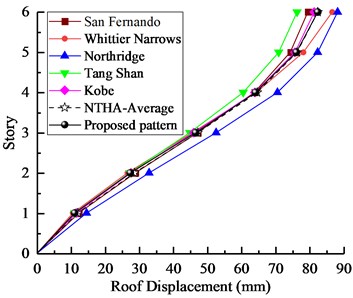
b)
Fig. 11Differences between different procedures compared with NTHA for 4-Story model
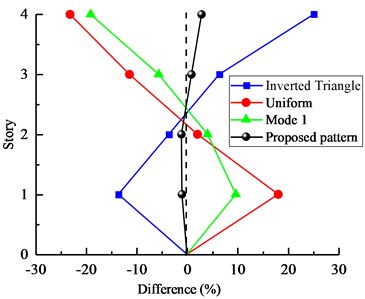
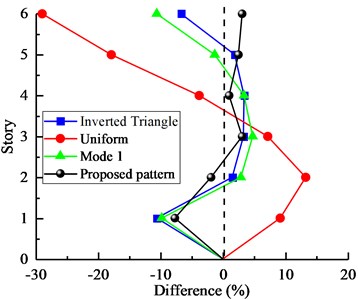
Fig. 12Differences between different procedures compared with NTHA for 6-Story model
It can be seen from the Figs. 9-10 that the results of two models obtained from the proposed SPA procedure were completely coincident with those from NTHA-Medium, especially for the lower stories. Furthermore, the developing trend of interstory drifts of two models well reflects different torsional effect at different stories. In general, the results show that the proposed load pattern can provide an appropriate accuracy to estimate seismic behavior of asymmetric-plan structures. The differences of the two models obtained from different pushover procedures are shown in Figs. 11-12, respectively.
In Fig. 11, for 4-Story model, the error rate of the SPA method was precisely controlled below 3 %, however, other three NSP methods show huge errors in estimating seismic demands of irregular building. In Fig. 12, for 6-Story model, obviously, Uniform load pattern shows the maximum errors of this procedure are –31 %, Inverted Triangle and Mode1 load patterns reflect relatively close differences. The proposed SPA method still shows approximately accurate results. In general, the accuracy of conventional NSPs is less than SPA procedure in predicting the drift responses in asymmetric-plan structures. And the proposed lateral load pattern agrees well the results of the NTHA.
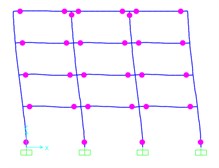
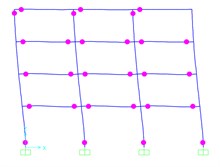
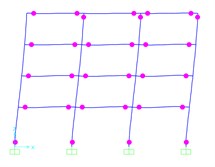
Fig. 13Distribution of plastic hinge rotations obtained from the SPA procedure and NTHAs in the fringe frame for 4-Story model (Δdemand = 66 mm)
a) San Fernando
b) Whittier narrows
c) Northridge
d) Tang Shan
e) Kobe
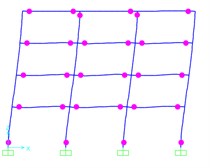
f) Proposed pattern
Fig. 14Distribution of plastic hinge rotations obtained from the SPA procedure and NTHAs in the fringe frame for 6-Story model (Δdemand = 82 mm)
a) San Fernando
b) Whittier narrows
c) Northridge
d) Tang Shan
e) Kobe
f) Proposed pattern
According to the nonlinear failure criterion, the contour response of peak plastic hinges rotation for 4- and 6-Story models at defined ultimate states are plotted in Figs. 13-14. Node rotation ability of plastic hinges, which is represented by , is less than 0.006 rad uniformly in Figs. 13-14.
As it is presented in Figs. 13-14, the errors in estimating the beams and columns hinge plastic rotation demands, are significantly less than the errors involved in determining the story drifts demands. In the 6-story model, the dispersion of the beam hinges at the top stories is more than other stories. However, the spatially distributed load patterns still perform much better than the pushover analysis with the first mode load pattern. The comparison of the results obtained from the proposed procedure shows that the SPA method leads to acceptable responses and can properly consider the lateral-torsion coupling effect as well as the nonlinear behaviors of the structural system.
6. Conclusions
A new lateral load pattern for pushover analysis has been presented to better estimate the seismic performance of asymmetric-plan structures in engineering practice. The proposed SPA procedure is based on the characteristics of the lateral load distribution for the asymmetric structural type and this method accounts for the torsion effect due to eccentricity. It starts with a linear dynamic analysis RSA to generate the spatial lateral forces. The interstory torsion angle and eccentricity ratio are used to calculate the coefficients of adjustment and distribution. For the high-rise building which is affected by higher mode vibrations, the formula of the SPA procedure has taken into account of the equivalent mode shape of the th floor.
The accuracy and efficiency of the SPA procedure have been verified against two studied buildings with different number of stories and shape of the floor plans subjected to the selected ground motion. The envelopes of peak seismic responses derived from the SPA procedure are compared with other NSPs and NTHAs. The main conclusions could be drawn as follows:
1) The results indicate that the SPA procedure can provide an appropriate accuracy to estimate seismic behavior of the structures. However, the capacity curve obtained from the SPA indicates a good agreement with those from the IDA. The SPA method broadens the scope of application in NSP, immediately, once given a rational load pattern, the pushover analysis could be applicable to any types of structures.
2) The results show that the effects of torsion on responses is revealed under unidirectional ground motions. Therefore, the proposed procedure that involves torsional torques is reliable with regard to this phenomenon. In addition, in comparison with well-known CMP, the SPA procedure provides a significant improvement through the prediction of plastic hinge rotations in the one-way asymmetric-plan buildings especially at flexible edges.
3) In general, several conventional lateral load patterns recommended by FEMA-356 are incapable of predicting the major inelastic response quantities of asymmetric-plan structures. The proposed SPA procedure has a good accuracy to assess seismic behavior of both low-rise and high-rise asymmetric-plan buildings. The simplicity of the proposed method is its most important feature in comparison to the other existing pushover procedures. Namely, expensive computational cost and complicated steps can be avoided during the SPA. Based on the proposed SPA method, this paper provides a simple but effective means of estimating inelastic behaviors without going through a computation-intensive NTHA.
References
-
Improvement of Nonlinear Static Seismic Analysis Procedures. Federal Emergency Management Agency, FEMA 440, Applied Technology Council (ATC-55 Project), 2005.
-
Chopra A. K., Goel R. K. A modal pushover analysis procedure to estimate seismic demands for asymmetric-plan buildings. Earthquake Engineering and Structural Dynamics, Vol. 33, Issue 8, 2004, p. 903-927.
-
Lin J. L., Tsai K. C. Seismic analysis of two-way asymmetric building systems under bi-directional seismic ground motions. Earthquake Engineering and Structural Dynamics, Vol. 37, Issue 2, 2008, p. 305-328.
-
Reyes J. C., Chopra A. K. Three-dimensional modal pushover analysis of buildings subjected to two components of ground motion, including its evaluation for tall buildings. Earthquake Engineering and Structural Dynamics, Vol. 40, Issue 7, 2011, p. 789-806.
-
Olivito R. S., Porzio S. A new multi-control-point pushover methodology for the seismic assessment of historic masonry buildings. Journal of Building Engineering, Vol. 8, 2019, p. 1025-1041.
-
Erduran E. Assessment of current nonlinear static procedures on the estimation of torsional effects in low-rise frame buildings. Engineering Structures, Vol. 30, 2008, p. 2548-2558.
-
Kosmopoulos A. J., Fardis M. N. Simple models for inelastic seismic analysis of asymmetric multistory RC buildings. Journal of Earthquake Engineering, Vol. 12, Issue 5, 2008, p. 704-727.
-
Shakeri K., Tarbali K., Mohebbi M. Pushover analysis of asymmetric-plan buildings based on distribution of the combined modal story shear and torsional moment. Earthquake Engineering and Engineering Vibration, Vol. 13, Issue 4, 2014, p. 707-716.
-
Tirca L., Chen L. The influence of lateral load patterns on the seismic design of zipper braced frames. Engineering Structures, Vol. 40, 2012, p. 536-555.
-
Manoukas G., Avramidis I. Evaluation of a multimode pushover procedure for asymmetric in plan buildings under biaxial seismic excitation. Bulletin of Earthquake Engineering, Vol. 24, Issue 6, 2015, p. 397-408.
-
Bhatt C., Bento R. A 3D pushover methodology for seismic assessment of plan asymmetric buildings. Earthquake Spectra, Vol. 30, Issue 2, 2014, p. 683-703.
-
Kreslin M., Fajfar P. Seismic evaluation of an existing complex RC building. Bulletin of Earthquake Engineering, Vol. 8, Issue 2, 2010, p. 363-385.
-
Kreslin M., Fajfar P. The extended N2 method taking into account higher mode effects in evaluation. Earthquake Engineering and Structural Dynamics, Vol. 40, Issue 14, 2011, p. 1571-1589.
-
Khoshnoudian F., Kiani M., Yang T. Y. A new pushover procedure for two-way asymmetric-plan tall buildings under bidirectional earthquake. Structural Design of Tall and Special Buildings, Vol. 23, Issue 14, 2014, p. 1097-1117.
-
Cimellaro G. P., Giovine T., Lopez-Garcia D. Bidirectional pushover analysis of irregular structures. Engineering Structures, Vol. 140, Issue 9, 2014, p. 59-72.
-
Rosenblueth E. A Bias for Aseismic Design. Ph.D. Thesis, University of Illinois, Urbana, 1951.
-
GB50011-2010, Chinese Standard Code for Seismic Design of Buildings. Building Industry Press of China, Beijing, 2016.
-
Pokhrel M., Bandelt M. J. Plastic hinge behavior and rotation capacity in reinforced ductile concrete flexural members. Engineering Structures, Vol. 200, 2019, p. 109699.
-
Eslami A., Ronagh H. R. Effect of elaborate plastic hinge definition on the pushover analysis of reinforced concrete buildings. The Structural Design of Tall and Special Buildings, Vol. 23, Issue 4, 2014, p. 254-271.
-
Strong Ground Motion Database. Pacific Earthquake Engineering Centre, PEER, 2018.
-
Prestandard and Commentary for the Seismic Rehabilitation of Buildings. Federal Emergency Management Agency, FEMA 356, 2000.
About this article

