Abstract
The current paper compares the seismic performance of buckling-restrained braced frames (BRBFs) and ordinary concentrically braced frames (CBFs) through nonlinear static and time history analysis. Two groups of BRBFs and CBFs including 5, 10 and 15 story frames are modeled and nonlinear pushover analysis is carried out. To further investigate the performance of frames, a selection of near-fault and far-field ground motion records are used for time history analysis. The results indicate the acceptable seismic performance and conformity of low-rise CBFs with BRB frames under far-field records. However, BRB frames present more satisfying results with regards to inter-story drifts, residual drift responses and energy dissipation in case of near-fault seismic excitations. Moreover, the implementation of BRBs provides better performance against the Basic Safety Earthquake 1 (BSE-1).
1. Introduction
Ground motions close to ruptured faults tend to impose severe demands to buildings in the near-fault regions. In these types of excitations, the horizontal component perpendicular to the fault has the most severe effect on the earthquake response, which makes its influence more than the horizontal one parallel to the fault and perpendicular to the earth surface. As a result, the near-fault earthquakes have long pulses and at least one peak velocity from the records that impose significant amount of earthquake energy to the structure in a short time. Previous researches have highlighted the fact that unlike far-field seismic excitations, near-fault ground motions lead to major changes in the structural vibration characteristics and cause extensive damages to structures, due to rupture mechanism, rupture direction and permanent earth deformation [1-3]. Therefore, investigating the nature of near-fault earthquakes in order to decrease the seismic vulnerability of structures is a crucial subject of study for structural engineers. A number of researches have been conducted in the field of generating artificial near-field ground motion similar to natural vibrations [4-6]. Researchers also investigated the different effects of the near-fault characteristics on the seismic demand of lateral load resisting systems and compared the results with the exact methods [7, 8]. Other groups have investigated the feasibility of modern lateral load resisting systems in reducing the vulnerability of structures.
Nowadays, the extensive implementation of energy dampers in structures to dissipate seismic energy is a common approach. The main benefit of using these systems in buildings can be high-energy absorption of earthquakes and reduction of damages in lateral load resisting systems. BRBs are being used as a well-known solution to many of the drawbacks of conventional braces such as differences between compressive and tensile capacity of the braces and low strength of these braces under cyclic loading. An ideal elasto-plastic behavior can be guaranteed by using a confinement method to prevent buckling of steel cores of the braces [9]. After the severe earthquakes of Northridge-1994 and Kobe-1995, BRBs became one of the main seismic load resisting systems which could satisfy the demands of the most seismic codes all over the world [10]. Performance evaluation of the steel frames with BRBs has been the subject of study by different researchers [11-14]. Sabelli et al. [15] studied a variety of low- and medium-rise steel frames to evaluate the seismic demand of BRB frames. López and Sabelli [16], and Fahnestock et al. [17], investigated the effects of analysis method, structural characteristics, structural systems configuration and seismic demands and design criteria for BRBFs and examined the feasibility of nonlinear dynamic analysis for evaluation of BRBFs. The results have been used for conducting experimental tests with full-scale frames to develop the provision codes of BRBFs [17]. Fahnestock et al. and Ghowsi and Sahoo [17, 18] have reported the appropriate seismic performance of BRBFs in satisfying the seismic demands, as well as model’s characteristics of strength and ductility. In addition, the effects of beam-column connections and buckling restrained brace configurations in the overall seismic response of medium-rise BRBFs have been studied. The results indicate a significant effect of modeling specifications and type of selection of braces on the seismic behavior of structures and reduction of seismic demands. Since BRBs are introduced to improve the performance of conventional CBFs, the evaluation of these two systems is necessary to gain a comprehensible understanding of BRBs as well as providing more technical and economic reasons for using this type of bracing.
This paper aims to evaluates the seismic performance of steel planar frames equipped with buckling restrained braces (BRBs) acting as passive dampers in comparison with concentrically braced frames (CBFs). Two groups of steel frames with BRBs and CBFs of different number of stories (5, 10, and 15 stories) are designed according the criteria of ASCE07 [19] and UBC97 [20]. Non-linear static pushover analysis (Capacity Spectrum Method) and non-linear response history analysis (NLRHA) using six different pairs of near-fault and far-field ground motion records are used in the assessment. A number of seismic parameters such as seismic demand of the structures, lateral displacement of stories, improvement of the lateral loading acting on the structure, providing the desired performance level in design codes and other seismic provisions have been studied. In addition, energy dissipation, displacement-based and forced-based seismic capacity of nonlinear dynamic analysis is investigated and recommendations for appropriate application BRBF in the studied models are presented.
2. Buckling restrained brace (BRB)
Researchers’ efforts to prevent buckling phenomena of compressive elements led to the introduction of buckling restrained braces. The early researches have been done in Japan in 1980, and the new system opened its way to United States in 2000 and its application has expanded rapidly ever since [17]. Moreover, a number of experimental researches had been made on BRBFs [22-26], [17] which indicate the ductility of braces as well as its stable hysteresis behavior and high plastic displacement capacity [27] (Fig. 1). To guarantee the stable hysteresis behavior, a steel core is being placed inside a steel casing in order to prevent compressive buckling (Fig. 2) [10]. The core contains a yielding segment which is surrounded by with elastic materials. It should be noted that the core is placed before filling the steel casing with mortar or other filler material. Before casting mortar, a slippery material or small air gap prevents the transmission of axial force to mortar and the steel casing and ensures that the whole axial load is supported by steel core. In general, BRBs are composed of five main components [10, 16] which can be seen in Fig. 3.
Fig. 1a) Mechanism of a BRB under axial force [16], b) comparison of the first hysteresis cycle of BRB with the typical bracing [28]
![a) Mechanism of a BRB under axial force [16], b) comparison of the first hysteresis cycle of BRB with the typical bracing [28]](https://static-01.extrica.com/articles/16578/16578-img1.jpg)
a)
![a) Mechanism of a BRB under axial force [16], b) comparison of the first hysteresis cycle of BRB with the typical bracing [28]](https://static-01.extrica.com/articles/16578/16578-img2.jpg)
b)
Fig. 2Typical configuration of the BRB [28]
![Typical configuration of the BRB [28]](https://static-01.extrica.com/articles/16578/16578-img3.jpg)
![Typical configuration of the BRB [28]](https://static-01.extrica.com/articles/16578/16578-img4.jpg)
Fig. 3Components of a typical BRB [16]
![Components of a typical BRB [16]](https://static-01.extrica.com/articles/16578/16578-img5.jpg)
3. Non-linear analysis
3.1. Nonlinear static pushover
Nonlinear static analysis is an applied method for evaluation of the seismic behavior of the structures. Despite its limitations, it is widely used in practical methods, because of its simplicity. In this analysis, a lateral load is applied on the structure with a specified load pattern and incremental lateral loading represents the seismic lateral inertial force. In this paper, the nonlinear pushover is used based on the Capacity Spectrum Method (CSM) available in ATC-40 [30].
As shown in Fig. 4, general process of the CSM method including of the derivation of the demand point from the capacity diagram of the structure and the demand spectra curve of the earthquake have been presented. Then, the elastic response (or design) spectrum converted from the pseudo acceleration “” versus the natural period “” format, to the A-D format (the Acceleration-Displacement Response Spectrum (ADRS)), where is the deformation spectrum ordinate, to obtain the demand diagram. By plotting the demand and capacity diagram together, the performance demand of the structure is determined from the interaction of two diagrams with trial-and-error steps [31-33].
Fig. 4Procedure of determination of demand (Performance) point in the capacity spectrum method (CSM) based on the acceleration-displacement response spectrum (ADRS) format [31]
![Procedure of determination of demand (Performance) point in the capacity spectrum method (CSM) based on the acceleration-displacement response spectrum (ADRS) format [31]](https://static-01.extrica.com/articles/16578/16578-img6.jpg)
3.2. Nonlinear dynamic analysis
The nonlinear time-history analysis is one of the comprehensive methods, which considers the effects of the properties of strong ground motion earthquakes and non-linear characteristics of structure. The general approach of dynamic analysis involves the systematic integration of the equations of motion, which is assumed to be independent of the superposition effects for force. In fact, this method shows the behavior of structure in time as systematic procedure. In this study, the constant acceleration method [34] is used for the nonlinear dynamic analysis. In this method, at the time interval to (), acceleration of system will be considered as constant. However, this constant acceleration can be the acceleration at or , or the average value of and in most case. Therefore, the equilibrium equation in general form is determined as follows Eq. (1):
By replacing the values obtained for mass, damping and stiffness for every step, in Eq. (1) the final equation is converted to Eq. (2):
By calculating the in each time step, displacement, velocity and acceleration at the end of the step () is obtained.
Since time steps have a direct effect on the accuracy of time history analysis, therefore, selection of appropriate time steps is important. By choosing a time interval less than one-tenth of the natural frequency of the structure, the accuracy of the results will be accurate enough. Also, time interval shall be selected such that it can show changes in loading properly. Thus, if changing of loading intensity at some moments is significant, in those moments, time interval should be selected too small to be actual representative of the loading in the calculations. Appropriate time steps in this procedure in order to achieve an exact solution must not be greater than 12, ( is the period of dominant mode of the structure). Also, time step selected must not be greater than the recorded acceleration time step [34]. In this study, time step is considered as 0.005 seconds.
4. Analytical models
4.1. Building models and frames
In this study, six steel frames including 5, 10, and 15-story CBFs and BRB frames with pinned connections are designed according to AISC building code 2010[20] and SEI/ASCE7-10 [21]. Buildings are located in a high seismic risk zone with the soil type C [21], which has the shear wave velocity between 360 to 760 m/sec2. Dead and live load was 570 and 200 kg/m2 respectively. Live load for the roof was considered150 kg /m2 for all models. Fig. 5 shows the plan and elevation view of the buildings.
The steel buckling-restrained braced buildings have been designed based on the load and resistance factor design (LRFD) in accordance with the provisions of AISC360 [35]. Acceptance criteria and performance levels of models are checked based on the provisions of AISC2010 [20], SEI/ASCE 7-10 [21], and ASCE41-13 [36] has been done.
Fig. 5Elevation view: a) 5, b) 10, c) 15-story models and d) plan view
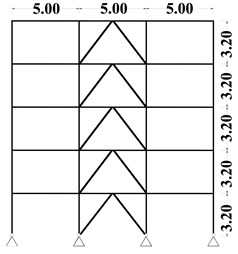
a) Elevation view – 5 story
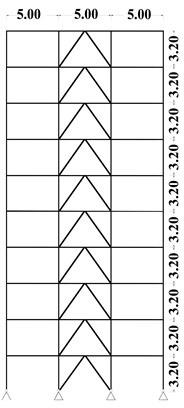
b) Elevation view – 10 story
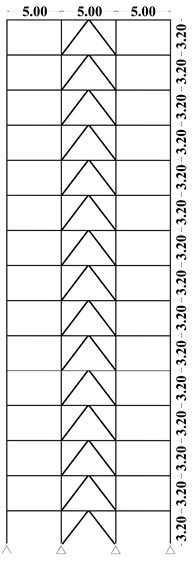
c) Elevation view – 15 story
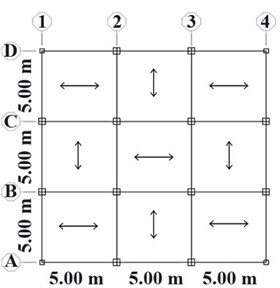
d) Plan view
4.2. Brace modeling of buildings
Load-deformation capacity curve of the ordinary braces is shown in Fig. 6 and Table 1. Based on the analytical and experimental results, the generalized load-deformation curve shown in Fig. 6, with parameters , , and as defined in Table 1, is being used for components of steel concentrically braces. The parameter in Fig. 6, is generalized component load and is total elastic and plastic displacement, in elastic and inelastic behavior of steel concentrically braces, respectively [36].
In Table 1, acceptance criteria and modeling parameters of double angle sections for concentrically braced frames in compression is obtained [34].
Table 1Modeling parameters and acceptance criteria of concentrically braces [34]
Modeling parameters | Acceptance criteria | |||||
Plastic deformation | Residual strength ratio | Plastic deformation | ||||
IO | LS | CP | Braces in compression (Using with linear interpolation between the values for slender and stocky braces) | |||
0.83 | 7.68 | 0.43 | 0.5 | 6.34 | 8.67 | |
9 | 12 | 0.6 | 0.5 | 9 | 12 | Braces in tension |
Fig. 6Generalized force-deformation relation for steel concentrically braces [34]
![Generalized force-deformation relation for steel concentrically braces [34]](https://static-01.extrica.com/articles/16578/16578-img11.jpg)
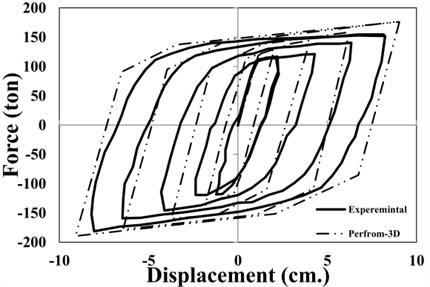
As for the BRBs, the modeling parameters and acceptance criteria are obtained using ASCE41-13 provisions [36] (Table 2). To consider the criteria for dynamic analysis, the tri-linear idealization model from studies of Sahoo and Chao [26] is used. Fig. 7 shows the verification analytical modeling and experimental data. As can be seen from the figure, the hysteresis loops of BRB show the suitable kinematic and isotropic hardening behavior. Based on the calibration of Sahoo and Chao’s models [26], the buckling-restrained braces were modeled using with tri-linear hysteretic behavior, consisting of degradation in stiffness and strength components (Fig. 8).
Table 2Modeling parameters and acceptance criteria buckling restrained braces [36]
Modeling parameters | Acceptance criteria | ||||
Plastic deformation | Residual strength ratio | Plastic deformation | |||
IO | LS | CP | |||
13.3 | 13.3 | 1.0 | 3.0 | 10 | 13.3 |
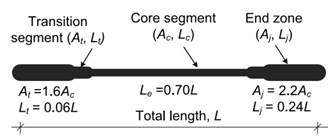
Fig. 7a) Components of BRB, b) verification of hysteresis model of BRBs in PERFORM-3D
a)
b)
The components Properties of BRBs were selected from studies of Sahoo and Chao [9] in PERFORM-3D [37]. As shown in Fig. 7(a), the elastic zones (transition) in the start and end of segments of BRBs were considered as 1.6 and 2.2 times of the sectional area of the BRBs’ core, respectively. Also, the length of elastic zone (transition in the start and end of segments of BRBs) have been considered as 0.06 and 0.24 times the total length of BRB [9]. The post-yield stiffness of BRBs in tension can be different from that in compression depending on the type of outer casing and confining material used for lateral support to brace core [38-40]. In this study, the post-yield stiffness of core segments in tension and compression was considered as 3 % of their initial stiffness [9]. Both isotropic and kinematic hardening characteristics were considered in the modeling of Force-Deformation response of BRBs [9]. Various hardening parameters were obtained by comparing the hysteretic response of a typical BRB from PERFORM-3D [37] with the component test results [38] as shown in Fig. 7(b).
The tri-linear hysteresis BRB model adopts well with component tests and used in Perform 3D [37]. Therefore, for modeling of inelastic BRB elements, the tri-linear Force-Deformation relationship is used. This model is consisting of the three main components including elastic, yielding and hardening region. Also, it is capable to consider strain hardening behavior, which involves both isotropic and kinematic hardening properties. Therefore, this model has been applied for modeling of BRBs in this study. Fig. 8 shows the general tri-linear force-displacement relationship in BRB modeling. In order to define the tri-linear model for a BRB model as shown in Fig. 8, it would be required the thirteen parameters. The measure of these parameters depend on interior steel core area, length between pin-to-pin connection, length of the interior steel core, modulus of elasticity and yield strength of steel. The parameters that related to the Strain-Stress relationship are based on the property of the BRB yielding core in the hysteresis model of BRBs (Fig. 7(b)) including of the yielding force (), force for the first loading cycle (); strength after full hardening (); the stiffness before yielding (); the post-yielding stiffness () [26]).
For modeling of Buckling Restrained Braces (BRBs), three types of buckling restrained brace with rectangular sections are used in different stories (Table 3). Acceptance criteria and modeling parameters of BRB have been selected based on the results of Sahoo and Chao [26] and ASCE41-13 [36].
Fig. 8Tri-linear idealization model for load-deformation capacity curve for buckling retrained braces (BRB) [26]
![Tri-linear idealization model for load-deformation capacity curve for buckling retrained braces (BRB) [26]](https://static-01.extrica.com/articles/16578/16578-img14.jpg)
Table 3Acceptance criteria and modeling parameters of buckling restrained brace used in the study [36]
Properties of load-deformation capacity curve | BRB5-story | BRB 10-story | BRB 15-story | |
Modeling parameters | [kg] | 38304 | 76608 | 114912 |
[kg/cm] | 70724 | 141449 | 212174 | |
[kg/cm] | 884.050 | 1768.113 | 2652.175 | |
An elastic-first zone [cm2] | 16 | 32 | 48 | |
An elastic-end zone [cm2] | 22 | 44 | 66 | |
L-core BRB [cm] | 284.2 | 284.2 | 284.2 | |
L-first zone [cm] | 24.36 | 24.36 | 24.36 | |
L-end zone [cm] | 97.44 | 97.44 | 97.44 | |
Acceptance criteria | IO | 1.119 | 1.119 | 1.119 |
LS | 3.732 | 3.732 | 3.732 | |
CP | 4.965 | 4.965 | 4.965 | |
Beams, columns, and connections in the bracing bay should be designed for the maximum force to be applied by the braces. This maximum force should be achieved in brace deformation corresponding to the relative displacement of the story design. To calculate buckling brace stiffness, the length of the yielding core has been considered, as 70 % of the total length of BRB, which is verified in many practical purposes [16].
5. Ground motions
For nonlinear time history dynamic analysis, six near-fault and far-field natural ground motions from Pacific Earthquake Engineering Research (PEER) Center including both horizontal components are used [37]. Pulses of ground motion are the main specification of near-fault records. Although several methods for identification and extraction of low frequency pulses in ground motions are introduced, the criteria provided by Mohraz [42] was selected, due to its ease of determining the near-fault earthquake is more considered. Table 4 summarizes the ground motion properties used in this study. The selected records are scaled to the BSE-1 hazard level according to FEMA356 [43].
Table 4Ground motion properties [41]
No. | Earthquake | Date | Station | Component | PGA (g) | Closest distance to fault rapture (km) | M |
1 | Tabas | 1978/09/16 | 9102 Dayhook | DAY-LN | 0.328 | 3 | 7.4 |
DAY-TR | 0.406 | ||||||
2 | Northridge | 1994/01/17 | 00000 LA Dam | LDM064 | 0.511 | 2.6 | 6.7 |
LDM334 | 0.349 | ||||||
3 | Landers | 1992/06/28 | 24 Lucerne | LCN275 | 0.721 | 1.1 | 7.3 |
LCN000 | 0.785 | ||||||
4 | San Fernando | 1971/02/09 | Palmdale262 Fire Station | PDL120 | 0.121 | 25.4 | 6.6 |
PDL210 | 0.151 | ||||||
5 | Loma Prieta | 1989/10/18 | 1652Anderson Dam | AND270 | 0.244 | 21.4 | 6.9 |
AND360 | 0.24 | ||||||
6 | Imperial Valley | 1979/10/15 | 6604 Cerro Prieto | H-CPE147 | 0.169 | 26.5 | 6.5 |
H-CPE237 | 0.157 |
6. Capacity curves and seismic performance evaluation of the structures
Figs. 9 and 10 show capacity curves of models under both uniform and triangular loading patterns. Concentrically Braces in CBF models present high initial stiffness, before instability and buckling under compressive forces. As a result, these frames show high shear capacity in linear region. However, as the braces enter the nonlinear behavior, their strength decrease considerably, especially in the case of triangular load pattern. The initial slope of the capacity curves in the BRBFs is considerably less than that of CBFs, due to the very high primary stiffness of CBF compared to BRBF. Another reason can be attributed to the relative slenderness of the BRB core and their seismic behavior from buckling to yielding mode. Accordingly, the capacity curves for BRBF present less base shear while present more sustainability for different loading patterns, in comparison with CBFs.
Considering performance level of Life Safety (LS) in BRBFs and CBFs, the Capacity Spectrum Method (CSM) [30] is used to compute the performance point of Life Safety. Demand spectra range used in this method is the spectrum related to the seismic hazard Level 1 based on FEMA356 [39]. The performance point in Life Safety (LS) is presented in Table 5. The results show that nonlinear static analysis based on seismic performance of Life Safety for BRBF models are more conservative than the CBFs.
Fig. 9Capacity curve for 5, 10 and 15 –story of CBFs under the uniform (UN) and triangular (TR) loading pattern
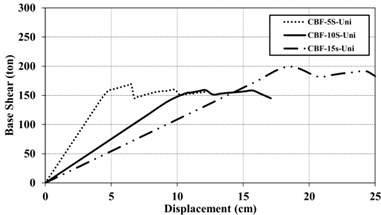
a) Uniform (UN) loading pattern
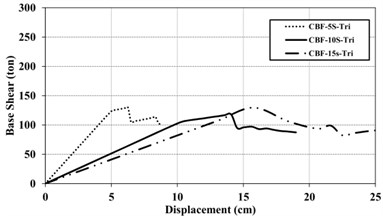
b) Triangular (TR) loading pattern
Fig. 10Capacity Curve for 5, 10 and 15 –story of BRBFs under the uniform (UN) and triangular (TR) loading pattern
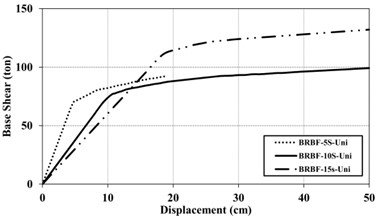
a) Uniform (UN) loading pattern
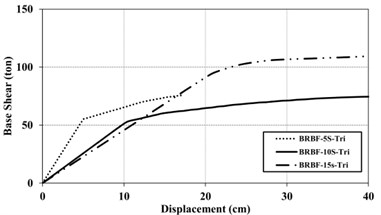
b) Triangular (TR) loading pattern
Table 5The performance point in the Life-Safety performance level (LS)
Model | Displacement (cm) | |
UN-Loading | TR-Loading | |
5-CBF | 4.63 | 3.32 |
5-BRBF | 9.49 | 9.81 |
10-CBF | 12.8 | 12.16 |
10-BRBF | 23.07 | 24.16 |
15-CBF | 20.64 | 21.12 |
15-BRBF | 30.91 | 32.35 |
7. Seismic displacement and load capacities based on nonlinear static analysis
7.1. Inter-story drifts in nonlinear static analysis
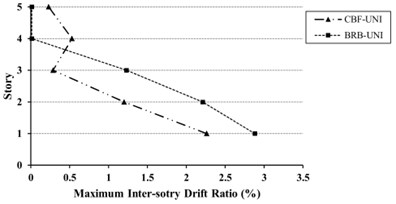
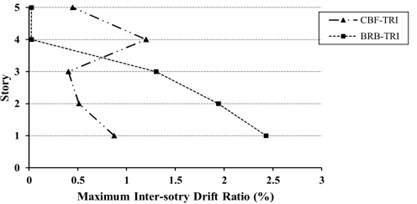
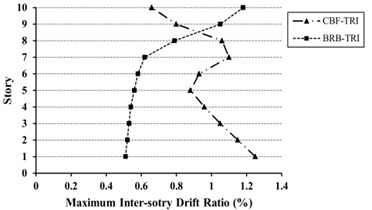
As shown in Figs. 11-13, for the mid- and high-rise models, inter-story drift ratio of CBFs are more than BRBFs except for top stories. The Maximum inter-story drift demand in BRBFs is shifted from lower to upper stories, whereas in CBFs shows an opposite trend. Also, the inter-story drifts in some stories are over than the values provided by FEMA 356 [39] as 1.0 % for the BSE-1 hazard level. With regard to Life Safety (LS) performance level, the drift value of 1.5 % is selected for BSE-1 hazard level.
7.2. Base shear corresponding to the target displacement
As shown in Fig. 14, the base shear in the target displacement for CBFs is more than BRBFs. For uniform loading pattern, the value of base shear in BRB frames of 5, 10 and 15-story is 2.06 %, 21.4 % and 31 % lower than the value of CBFs, respectively and for triangular loading pattern is 10.9 %, 16.7 % and 26 %. In fact, high levels of ductility and energy dissipation due to nonlinear behavior of the BRB reduces the seismic demands on the structure including its base shear.
Fig. 11Maximum inter-story drift ratio (%) for 5-story models under uniform (UN) and triangular (TR) loading
a) Uniform (UN)
b) Triangular (TR)
Fig. 12Maximum inter-story drift ratio (%) for 10-story models under uniform (UN) and triangular (TR) loading
a) Uniform (UN)
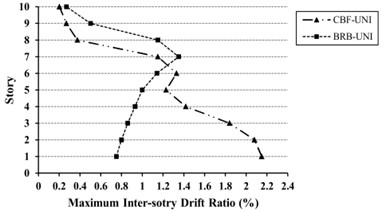
b) Triangular (TR)
Fig. 13Maximum inter-story drift ratio (%) for 15-story models under uniform (UN) and triangular (TR) loading
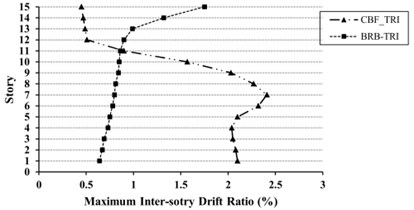
a) Uniform (UN)
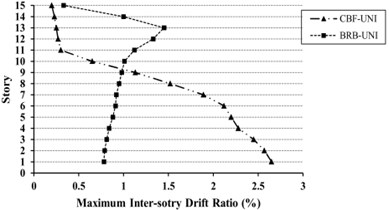
b) Triangular (TR)
Fig. 14Comparison of seismic base shear in Nonlinear static analysis between CBF and BRBF models under uniform (UN) and triangular (TR) loading pattern
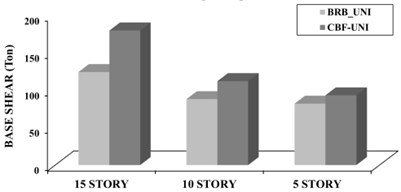
a) Uniform (UN)
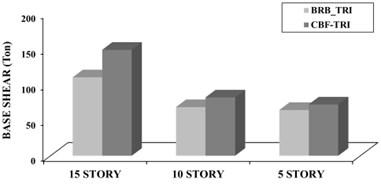
b) Triangular(TR)
7.3. Performance-based evaluation
The BRBFs have provided the acceptance criteria of Life Safety (LS) and Collapse Prevention (CP) performance levels under different loading patterns based on ASCE41-13 provisions [32]. However, CBFs in any of the models fail to satisfy these performance levels.
Fig. 15 shows the performance-based evaluation for Life Safety (LS) and Collapse Prevention (CP) levels in 10-story model under triangular loading patterns. The results have been presented based on the resistance criteria of BRBs. Therefore, the ratio of the seismic demand axial force to capacity have been mentioned on the specified elements.
The results show that the frame exhibits plastic hinge, which leads to instability and permanent deformation, at the seventh and tenth story of CBF models under triangular loading pattern.
Fig. 15Life Safety (LS) and Collapse Prevention (CP) performance-based evaluation for 10-Story BRBF and CBF models under triangular loading pattern (TR)
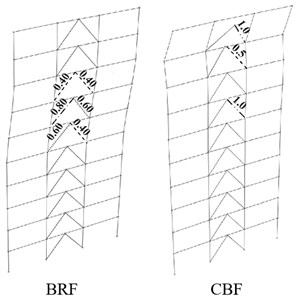
a) Life safety (LS)
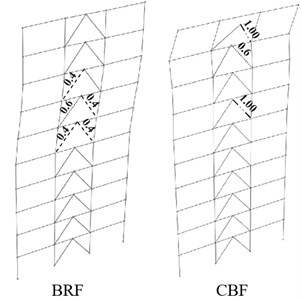
b) Collapse Prevention (CP)
8. Energy dissipation and seismic capacity of frames during time-history analysis
8.1. Energy dissipation
The amount of energy, which is dissipated by structure during an earthquake, determines the seismic behavior of structure. In a structure with appropriate nonlinear behavior, dissipation of energy occurs by viscous damping in the range of linear region and by the plastic properties of the members in the ranges of non-linear behavior. Fig. 16 shows the average of the energy dissipation in BRBF models under near-fault and far-field ground motions.
Fig. 16Mean of energy dissipation for BRBF models under near-fault ground motions and far-field ground motions
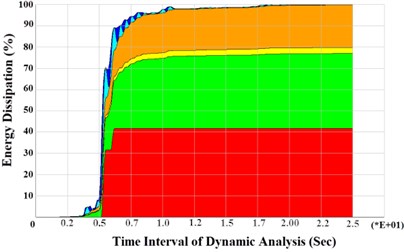
a) Near-fault ground motions
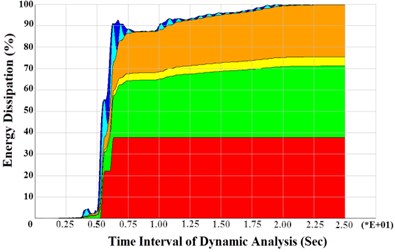
b) Far-field ground motions

The Studied BRBF models under near-fault records, show more ductility and high energy dissipation. Therefore, differences in the amount of the energy dissipation for near-fault ground motions are more than those of far-field. In addition, the mechanism of energy dissipation for all models under near and far-field records are more due to some attenuation within the nonlinear behavior of structures.
8.2. Residual drift response under near-fault and far-field records
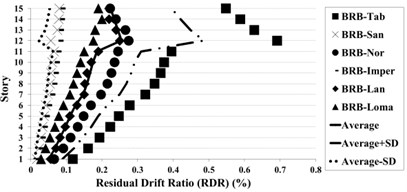
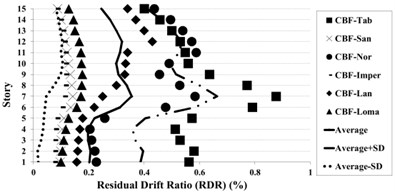
Residual Drift Ratio (RDR) estimates as the ratio of the inter-story displacement at various story levels in the last step of all ground motions. Figs. 17-19 show that near-fault ground motions have more effects on the upper stories. Therefore, RDR in near-fault excitations is greater than far-field. Thus, the Residual Drift Ratio at near-fault records in CBFs models, for most stories, especially in the first stories is more than BRBFs. Although the Residual Drift Ratio for BRBFs shifts from the lower to the upper stories, in the CBFs, this ratio changes from the lower to the upper stories.
Fig. 17Residual drift ratio (RDR) response of 5-story BRBF and CBF models under earthquakes
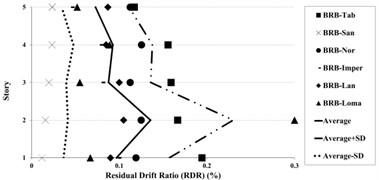
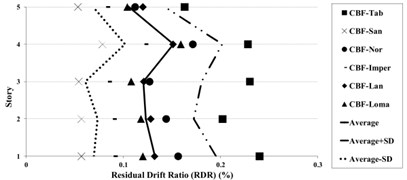
Fig. 18Residual drift ratio (RDR) response of 10-story BRBF and CBF models under earthquakes
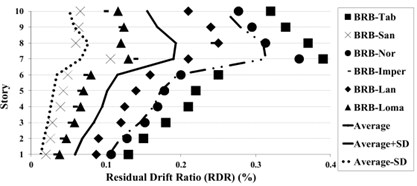
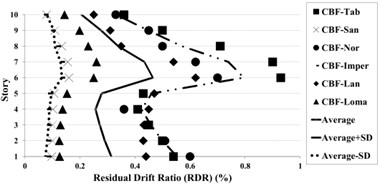
Fig. 19Residual drift ratio (RDR) response of 15-story BRBF and CBF models under earthquakes
The 5-story BRBFs under near-fault records show larger residual drift ratio response, compared to the far-field ground motions and the maximum value of mean residual drift ratio of 0.097 %.
The comparison of low-rise CBFs and BFBFs under near and far field ground motions indicate the small changes of RDR, whereas for mid-rise structures, the differences have been slightly increased.
The mean plus standard deviation value of RDR response of the low rise of BRBFs under earthquakes is about 0.15 %; whereas the corresponding values for the BRBFs varied in the range of 0.11-0.16 % and this result in CBF models is about 0.19 % which changed from 0.14 % to 0.20 %. In the mid-rise of BRBFs, the mean results for 10 and 15 stories have changed from 0.20 % to 0.27 % whereas in the mid-rise of CBFs, the average responses have value of 0.52 % and 0.48 % for 10 and 15 stories models, respectively.
The maximum residual drifts ratio for the low-rise buildings in BRBFs and CBFs is concentrated at the intermediate (2nd-4th) stories. For mid-rise BRBFs, the maximum RDR values have been obtained in the upper stories (7th-9th in the 10-story and 11th -13th in the 15-story frames) and in CBFs models, these values have been centralized at the intermediate stories.
8.3. Base shear under near-fault and far- field records
Maximum base shear values are shown in the Fig. 20, for 5-, 10-, and 15-story models, under near-fault and far-field records. It can be concluded that the values of base shear in the CBF models is greater than BRBFs in most stories, especially first ones, while in 5 story frames, the difference between the two systems was small, and in the far-field records for all models, the difference was negligible. The reduction of base shear in the BRRBFs tends to minimize the extra costs of foundation and diaphragm strengthening.
Fig. 20Comparison of the maximum of base shear in the 5, 10 and 15-story CBF and BRBF models
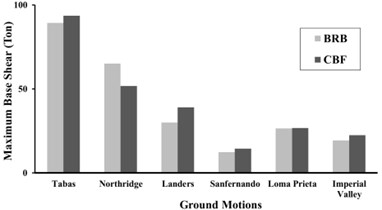
a) 5 story
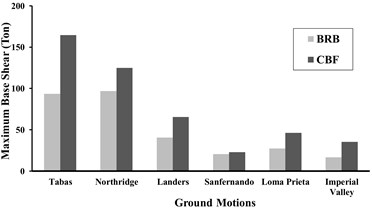
b) 10 story
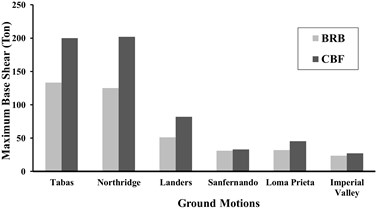
c) 15 story
9. Conclusions
Based on the results of nonlinear static and dynamic analysis for Concentrically Braced Frames (CBFs) and Buckling Restrained Braced Frame (BRBF), the following conclusions could be expressed:
1) Buckling Restrained Braced Frames (BRBFs) could provide acceptance criteria of members at Life Safety (LS) performance level for the Basic Safety Earthquake-1 (BSE-1), while some Concentrically Braced Frames fail to achieve this performance level. Also, the Collapse Prevention (CP) performance level in all models of Buckling Restrained Braced Frames (BRBFs) is satisfied for the selected earthquake ground motions.
2) The value of energy dissipation in the buckling restrained braced frames (BRBFs) as one of the passive energy dissipation devices according to the near-fault and far- field records and also the number of stories has changed. For example, the energy dissipation due to nonlinear behavior of the models in low-rise frames of CBF models are more corresponded with similar models BRB. However, because of the stiffness and strength of low-rise CBFs under near-fault and far-field records, the rate of energy dissipation in them is the same of that in BRBFs. By increasing the height of the frames, and the more effects of higher modes on the nonlinear behavior of frames, the rate of energy dissipation due to nonlinear behavior is increased, and the energy dissipation in BRBFs is more than that of CBFs and it is considerably increased with increasing height. The dissipation of strain energy is relatively low and negligible compared to other kinds of energy dissipations. Its ratio for BRBFs in compression with CBF models is notable that it represents the reversible behavior of BRBFs in linear behavior range and leads to decrease the seismic demand. Other types of energy dissipation relating to the viscous and modal damping in the different frames have devoted a major part of the energy dissipation. Further, explore the effects of different kinds of damping in the buckling restrained braced frames (BRBF) needs more investigations.
3) Since based on the obtained results, the inter-story drift values coming from nonlinear static analysis are higher than those of the nonlinear dynamic analysis; it seems that using the nonlinear static analysis for the studied BRBFs’ models will not be appropriate.
4) Force-deformation capacity curves indicate that although BRB frames present less elastic stiffness in linear region, they provide more ductility in nonlinear regions which makes them dissipate more energy in seismic excitation, especially in the case of near-fault ground motions.
5) Overall assessment of this study suggests that by comparing inertial forces on the structure, inter-story drift ratio and residual drift ratio of BRBFs and CBFs, it is suggested to use BRBs in mid and high-rise frames, instead of ordinary braces to grant the building with ductility, stiffness and energy dissipation capacity.
References
-
Mavroeidis G. P., Papageorgiou A. S. A mathematical representation of near-fault ground motions. Bulletin of the Seismological Society of America, Vol. 93, Issue 3, 2003, p. 1099-1131.
-
Iwan W. D. Drift spectrum: measure of demand for earthquake ground motions. Journal of Structural Engineering, Vol. 123, Issue 4, 1997, p. 397-404.
-
Malhotra P. K. Response of buildings to near-field pulse-like ground motion. Earthquake Engineering and Structural Dynamics, Vol. 28, Issue 11, 1999, p. 1309-1326.
-
Jalali R. S., Trifunac M. D., Ghodrati Amiri G., Zahedi M. Wave-passage effects on strength-reduction factors for design of structures near earthquake faults. Soil Dynamics and Earthquake Engineering, Vol. 27, Issue 8, 2007, p. 703-711.
-
Ghodrati Amiri G., Abdolahi Rad A., Aghajari S., Khanmohamadi Hazaveh N. Generation of near-field artificial ground motions compatible with median-predicted spectra using PSO-based neural network and wavelet analysis. Computer-Aided Civil and Infrastructure Engineering, Vol. 27, Issue 9, 2012, p. 711-730.
-
Hoseini Vaez S. R., Sharbatdar M. K., Ghodrati Amiri G., Naderpour H., Kheyroddin A. Dominant pulse simulation of near fault ground motions. Earthquake Engineering and Engineering Vibration, Vol. 12, Issue 2, 2013, p. 267-278.
-
Mortezaei A., Ronagh H. R., Kheyroddin A., Ghodrati Amiri G. Effectiveness of modified pushover analysis procedure for the estimation of seismic demands of buildings subjected to near-fault earthquakes having forward directivity. The Structural Design of Tall and Special Buildings, Vol. 20, Issue 6, 2011, p. 679-699.
-
Soleimani Amiri F., Ghodrati Amiri G., Razeghi H. Estimation of seismic demands of steel frames subjected to near-fault earthquakes having forward directivity and comparing with pushover analysis results. The Structural Design of Tall and Special Buildings, Vol. 22, Issue 13, 2013, p. 975-988.
-
Sahoo D. R., Chao S. H. Performance-based plastic design method for buckling-restrained braced frames. Engineering Structures, Vol. 32, Issue 9, 2010, p. 2950-2958.
-
Uang C. M., Nakashima M., Tsai K. C. Research and application of buckling-restrained braced frames. International Journal of Steel Structures, Vol. 4, Issue 4, 2004, p. 301-313.
-
Aiken I. D., Mahin S. A., Uriz P. Large-scale testing of buckling-restrained braced frames. Proceedings of Japan Passive Control Symposium, Tokyo Institute of Technology, Japan, 2002, p. 35-44.
-
Xie Q. State of the art of buckling-restrained braces in Asia. Journal of Constructional Steel Research, Vol. 61, Issue 6, 2005, p. 727-748.
-
Andrews B. M., Fahnestock L. A., Song J. Ductility capacity models for buckling-restrained braces. Journal of Constructional Steel Research, Vol. 65, Issue 8, 2009, p. 1712-1720.
-
Ma N., Wu B., Li H., Ou J., Yang W. Full scale tests of all-steel buckling restrained braces. Proceedings 14th World Conference on Earthquake Engineering, Beijing, China, 2008.
-
Sabelli R., Mahin S., Chang C. Seismic demands on steel braced frame buildings with buckling-restrained braces. Engineering Structures, Vol. 25, Issue 5, 2003, p. 655-666.
-
López W. A., Sabell R. Seismic Design of Buckling-Restrained Braced Frames. Structural Steel Educational Council, Steel Tips, California, Vol. 78, 2004.
-
Fahnestock L. A., Sause R., Ricles J. M. Seismic response and performance of buckling-restrained braced frames. Journal of Structural Engineering, Vol. 133, Issue 9, 2007, p. 1195-1204.
-
Ghowsi A. F., Sahoo D. R. Seismic performance of buckling-restrained braced frames with varying beam-column connections. International Journal of Steel Structures, Vol. 13, Issue 4, 2013, p. 607-621.
-
Minimum Design Loads for Buildings and Other Structures. Structural Engineering Institute, American Society of Civil Engineers (ASCE) Publications, Vol. 7, Issue 5, 2006.
-
Seismic Provisions for Structural Steel Buildings (ANSI/AISC 341-10). Seismic, A. I. S. C., 2010.
-
Minimum Design Loads for Buildings and other Structures, Structural Engineering Institute, American Society of Civil Engineers (ASCE) Publications, Vol. 7, Issue 10, 2011.
-
Watanabe A. Some damage control criteria for a steel building with added hysteresis damper. Proceedings of 11th World Conference on Earthquake Engineering, Pergamon, 1996.
-
Clark P., Aiken I., Kasai K., Ko E., Kimura I. Design procedures for buildings incorporating hysteretic damping devices. Proceedings of 68th Annual Convention, Structural Engineers Association of California, Sacramento, 1999, p. 355-370.
-
Inoue K., Sawaizumi S., Higashibata Y. Stiffening requirements for unbonded braces encased in concrete panels. Journal of Structural Engineering, Vol. 127, Issue 6, 2001, p. 712-719.
-
Black C., Makris N., Aiken I. Component testing, seismic evaluation and characterization of buckling-restrained braces. Journal of Structural Engineering, Vol. 130, Issue 6, 2004, p. 880-894.
-
Alemdar B., Huo Y., Pathak R. Comparison of dynamic characteristics and response analysis of building structures incorporating viscous fluid dampers and buckling restrained braces. Structures Congress, 2013, p. 2229-2240.
-
Deulkar W. N., Modhera C. D., Patil H. S. Buckling restrained braces for vibration control of building structure. International Journal of Research and Reviews in Applied Sciences, Vol. 4, Issue 4, 2010, p. 363-372.
-
Clark P. W., Aiken I. D., Kasai K., Kimura I. Large-scale testing of steel unbonded braces for energy dissipation. Proceedings of the Structural Congress, Philadelphia, 2000.
-
Tremblay R., Degrange G., Blouin J. Seismic rehabilitation of a four-story building with a stiffened bracing system. Proceedings of 8th Canadian Conference on Earthquake Engineering, Vancouver, Canada, 1999, p. 549-554.
-
Seismic Evaluation and Retrofit of Concrete Buildings. Report ATC-40, Applied Technology Council, Redwood City, 1996.
-
Chopra A. K., Goel R. K. Capacity-demand-diagram methods based on inelastic design spectrum. Earthquake Spectra, Vol. 15, Issue 4, 1999, p. 637-656.
-
Guyader A. C., Iwan W. D. Determining equivalent linear parameters for use in a capacity spectrum method of analysis. Journal of Structural Engineering, Vol. 132, Issue 1, 2006, p. 59-67.
-
Amiri G. G., Namiranian P. Evaluation of capacity spectrum method in estimating seismic demands of triple pendulum bearings under near-field ground motions. International Journal of Structural Stability and Dynamics, Vol. 1, Issue 2, 2014, p. 1350062.
-
Chopra A. K. Dynamics of Structures: Theory and Applications to Earthquake Engineering. Prentice Hall, Upper Saddle River, NJ, 1995.
-
Specification for Structural Steel Buildings (ANSI/AISC 360-10). American Institute of Steel Construction, AISC Committe, Chicago-Illinois, 2010.
-
Seismic Rehabilitation of Existing Buildings. American Society of Civil Engineers, ASCE Publications, Vol. 41, Issue 13, 2014.
-
PERFORM-3D: Nonlinear Analysis and Performance Assessment for 3D Structures. User Guide, Version 4, Computers and Structures Inc., Berkeley, C.A., USA, 2006.
-
Merritt S., Uang C. M., Benzoni G. Subassemblage Testing of Star Seismic Bucklingrestrained Braces. TR-2003/04. University of California at San Diego, La Jolla, C.A., 2003.
-
Fahnestock L. A., Ricles J. M., Sause R. Experimental evaluation of a large-scale buckling-restrained braced frame. Journal of Structural Engineering, Vol. 133, Issue 9, 2007, p. 1205-1214.
-
Tremblay R., Bolduc P., Neville R., DeVall R. Seismic testing and performance of buckling restrained bracing systems. Canadian Journal of Civil Engineering, Vol. 33, 2006, p. 183-198.
-
http://peer.berkeley.edu/smcat/
-
Mohraz B. Recent studies of earthquake ground motion and amplification. Proceedings of 10th World Conference on Earthquake Engineering, Vol. 11, 1992, p. 6695-704.
-
FEMA 356. Pre-Standard and Commentary for the Seismic Rehabilitation of Buildings. Federal Emergency Management Agency, Washington, D.C., 2000.
About this article

The authors gratefully appreciate Mr. Sajad Veismoradi and Mr. Ali Zare Hosseinzadeh from Iran University of Science and Technology for their constructive comments.
