Abstract
Earthquake accelerograms recorded in the near-fault regions have special characteristics including the long-period pulse in velocity records as well as high frequency content in acceleration records. In the present study, by using a wavelet analysis, the long period pulses exist in the velocity records of 28 near-fault ground motions, selected from the PEER NGA database, were first separated from the original records. Subsequently, an incremental non-linear dynamic analysis (IDA) was conducted to evaluate the non-elastic response of an example frame subjected to these original records and their extracted pulses to examine the efficiency of the extracted pulse of the records instead of the original accelerograms in dynamic analysis. The results of this study revealed that the efficiency of the extracted pulses to estimate the structure capacity depends on the structural performance levels. From the numerical analysis performed in the present study, it is found that if a given structure is designed for immediate occupancy (IO) performance level (low drift), the application of the extracted pulses overestimates the structure capacity, which is in the unsafe side. Nevertheless, if the structure is designed for collapse prevention (CP) performance level and experiences high level of non-elastic displacements, the extracted pulses provide a conservative estimation of the collapse capacity, which is in the safe side.
1. Introduction
The collapse prevention of the structures is one of the most important threshold levels to evaluate the performance of the structures under the seismic excitations. The incremental dynamic analysis (IDA) is an appropriate and precise method for probabilistic evaluation of the collapse of the structures. The IDA entails conducting non-linear analysis on the structural model under a set of earthquake records scaled in several intensity levels and imposed to the structure so that it undergoes from a linear elastic stage to non-linear complete collapse stage. Hence, using this method, the records should be scaled from a very low intensity measure (IM) to a very high one. This is computationally both time-consuming and costly. On the other hand, the reported records of the near-fault ground motions show that a large amount of energy of these records are expressed cumulatively and in the form of a pulse-type factor in the velocity record of these ground motions. Although numerous researchers have acknowledged the velocity record as an appropriate indicator to explain the nature of the near-fault records, they attempted to present several models for estimating this pulse-type part of the record and evaluating the relevant parameters to the structural responses under such records [1]. As a result, numerous mathematical models have been proposed to meet this goal [1, 2]. On the other hand, some scholars used non-stationary signal processing methods in order to extract the pulses of near-fault records. In 2007, Baker [3] utilized wavelet transform analysis to obtain the velocity pulses and identified the pulse-type records in NGA seismic database. The main objective of the study was to apply the concept of “the probability of pulse occurrence” in risk analysis studies.
Ghahari et al. (2010) [4] made use of consecutive average based on fast Fourier transform in order to divide 91 records identified as pulse ones by Baker and used two factors including pulse type record having low frequency and background record along with high frequency. In 2012, another approach was presented based on mixing the concepts related to absorbed energy by the structure in the time of earthquake and wavelet analysis in order to calculate the velocity pulse period [5].
The main objective of the present study is to investigate that, in view of estimating the seismic performance of the structures as well as reducing the computational time in incremental dynamic analysis, whether the extracted pulses from the near-fault ground motions well represent the original records or not?
2. Wavelet analysis to extract the pulse-type part of the near-fault records
Fourier transforms were used to analyze the earthquake waves in the past. This method has several shortcomings including lack of its ability in non-periodic functions since it merely utilizes the sinusoidal functions to form the signal under the study; furthermore, when a signal experiences non-continuous or sudden jumps (non-stationary signals), it is unable to discriminate its complete details. Moreover, the only parameter under the study is the signal frequency and it provides no information regarding the status of the signal under the study. In fact, these transforms cannot be used for a particular part of the signal since the sinusoidal functions, used in these transforms, have unlimited performance domain and it is unable to provide an appropriate estimation of a limited signal (Fig. 1).
Fig. 1Analysis of a signal in Fourier transforms

a) Signal

b) Constituent sinusoides of different frequencies
Hence, Fourier transforms are not considered as the appropriate tools to process the non-stationary waves. When the scholars determined that the Fourier transforms were not capable of meeting the requirements related to the frequency analysis, the idea of using a kind of transform capable of presenting more precise details came to the fore and wavelet transform (WT) was created. The wavelet transform has been recently used as an efficient tool to process the non-stationary signals, e.g. ground motions. Gaupilland et al. [6] were the first researchers who analyzed the seismic data used in oil extraction projects using wavelet. Following them, other scholars have developed this method. Haigh et al. [7] used this method to analyze the waves resulting from the vibrations. In 2007, Baker [3] utilized wavelet transform analysis to obtain the velocity records and identified the pulse-like ground motion in the next generation attenuation (NGA) project.
Unlike Fourier transform in which a wave is analyzed on the sinusoidal functions and its harmonics, in the wavelet transform, a wave is depicted on a set of functions which are called the mother wave. The term “mother” is used since all the transformed and scaled versions are obtained on a preliminary function which is called the mother wavelet. In other words, the mother wavelet is a prototype function for creating other waves. Fig. 2 displays the analysis of a signal in wavelet transforms.
The general form of the continuous wavelet transform (CWT) is as follows:
in which stands for the input signal, represents the mother function; and and are the parameters for shifting and scaling, respectively.
Fig. 2Analysis of a signal in wavelet transforms

a) Signal

b) Constituent wavelet of different scales and positions
2.1. Wavelet transform characteristics
In wavelet transform, wavelets are regular functions and are only defined in positive frequencies. In wavelet transform, the functions having the following two characteristics can be used as the mother function:
1) The mother function amplitude must decay rapidly to zero in the limit . This feature ensures the localization aspect of wavelet analysis. It means that the wavelet has insignificant effect at time , where is a critical time lag.
2) The wavelet must have zero mean. This condition, known as the admissibility condition, ensures the invertibility of the wavelet transform.
The mother function has various types which are chosen according to the given signal. In other words, to perform a wavelet analysis, a wavelet function having the highest degree of similarity with the given signal is used since this provides more appropriate approximation. According to the previously conducted studies by Baker [3], Daubechies wavelet is the most similar one to the near-fault ground motion directivity pulses. Fig. 3 displays a few sample functions of the mother wavelet functions.
Fig. 3A few mother wavelet functions
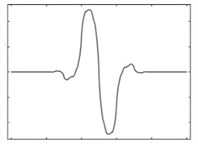
a) Bio 1.3 wavelet
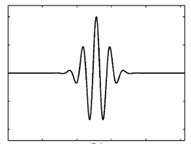
b) Morlat wavelet
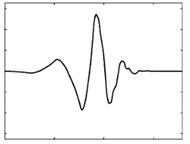
c) Daubechies wavelet of order 4
Given the above definitions for the Eq. (1) which is expressed in the form of a dot product, it might be implied that wavelet transform is indeed measuring the similarity between the original signal and the mother functions (wavelets), i.e. analyzing the similarity of the frequency content of both. In other words, the wavelet transform coefficients indicate the degree of similarity between the original signal and the mother wavelet in the given scale. To carry out such task, if the scaled wavelet is similar to the given signal, those coefficients of continuous wavelet transform (CWT) calculated in this scale would have rather high values.
The wavelet transform is used as a signal processing tool and is one of the toolboxes of MATLAB software. The wavelet transform for which the mathematical calculations were presented above has ready-made algorithm in MATLAB program used in the present study [8].
Fig. 4 displays the time series of the accelerogram and the corresponding wavelet transform coefficients for Tabas earthquake in the Tabas station. These are the coefficient plots generated by the graphical tools. To depict the results of wavelet transform analysis, a plot is made on which the -axis represents position along the signal (time), the -axis represents the scale parameter and the color at each - point represents the magnitude of the wavelet coefficient (Fig. 4(b)).
As shown in the below figure, the wavelet coefficients had the highest values at 10 and 15 seconds compared to the other times; hence, it can be concluded that the time between 10 and 15 seconds was the most dangerous time in the Tabas earthquake and the highest value of seismic energy is related to this time interval.
Fig. 4Graphical diagram of the wavelet coefficient for the Tabas earthquake accelerogram
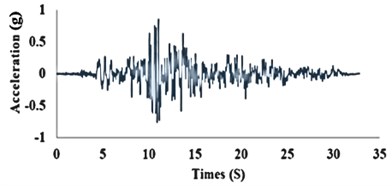
a) Time history acceleration record of Tabas
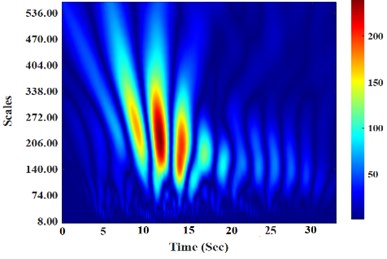
b) The continuous wavelet transform (CWT) plot
2.2. Extraction of velocity pulses
In 2007, the wavelet transform analysis method was used by Baker [3]. Using Baker’s method, the largest pulse velocity can be extracted for each ground motion through wavelet decomposition described briefly in the previous sections. However, in addition to the size of the extracted pulse relative to the original record, as a criterion to identify the degree which the ground motion under the study is near-fault, two other limitations were also considered by Baker for the purpose of identifying more precisely:
1. The pulses resulted from the directivity effect of the fault failure located at the beginning of the record.
2. The value of peak ground velocity (PGV) of the original record is more than a specific value (say, 30 cm/s).
Fig. 5Decomposition method of the near-fault ground motion in order to extract the velocity pulse (Tabas earthquake record)
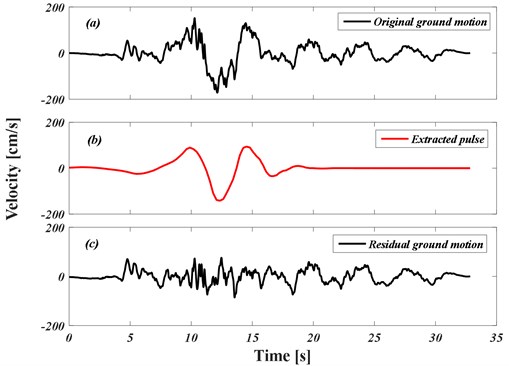
The Daubechies wavelet of order 4 (db4), displayed in Fig. 3(c), was used as the mother wavelet in Baker’s method since it covered a large number of records of velocity pulses and it was believed that it was more appropriate than the other wavelet functions [3]. To extract the pulse type part of the accelerogram, first, the continuous wavelet transform is to be performed for the velocity time history and the largest absolute value of the wavelet coefficient should be identified. It is noteworthy that a wavelet coefficient is equal to the associated wavelet energy; hence, the selected pulse is one of the wavelets with the largest energy. This wavelet is subtracted from the original ground motion and the continuous wavelet transform is used repeatedly for the residual ground motion. Since the location and period of the pulse were already identified, the only wavelets with the same location and period are considered in the neighbor times (within half of the original wavelet signal width) and the largest coefficients are identified. Mostly, just one or two coefficients suffice to describe the pulse; however, the total of ten coefficients are extracted in the period and location identification window in Baker’s algorithm to ensure that the pulse is precisely presented [9]. The original velocity record and its extracted pulse for Tabas earthquake are presented in Figs. 5(a) and 5(b) using the above algorithm. The residual velocity of the ground motion after abstracting the pulse is also presented in Fig. 5(c).
Moreover, the Fourier spectral amplitude of this record and its pulse are presented in Fig. 6.
Fig. 6Fourier amplitude spectrum of the original record and the extracted pulse for Tabas record
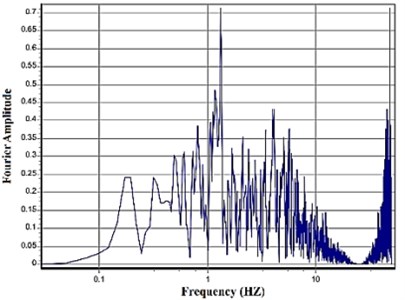
a) Original record
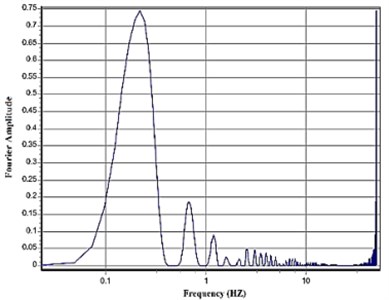
b) Extracted pulse
Fig. 7Acceleration, velocity, and displacement time histories of the Tabas ground motion, and their associated extracted pulses
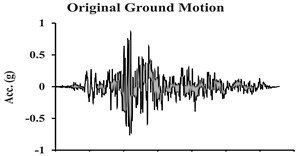
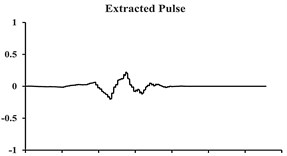
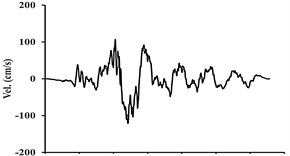
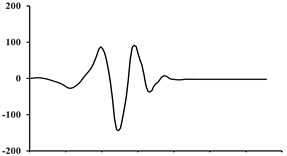
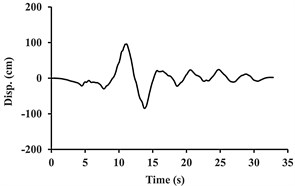
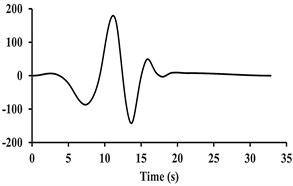
As it can be observed, the main pulse is concentrated in the low-frequency pulse amplitude. According to the obtained results, as Fig. 6 displays, the extracted pulse record which may include pulses resulting from the failure diffusion directivity is considered as the low-frequency part of each near-fault velocity record and is separated from the original ground motion through a wavelet analysis. The difference between the extracted pulse and the original ground motion is the residual ground motion.
Fig. 7 shows an example of acceleration, velocity and displacement records along with their extracted pulses (related to the Tabas earthquake). In this figure, the extracted pulse can explicitly depict the pulses being present in the velocity and displacement records; while the high-frequency ground motion existing in the original accelerogram were ignored. As it was previously mentioned, the wavelet mother functions used to extract the pulse are defined in such a way that they have an average value of zero, and thus there will be no harmful effects in the record.
Using the wavelet analysis method explained above, regardless of the fact whether a significant directivity pulse exits or not, a pulse can be extracted from any given ground motion; therefore, for pulses extracted from the near-fault ground motions, another criteria must be defined [9]. However, for ground motions without pulse part, any extracted pulse is a minor part of the original ground motion while the residual ground motion is quite similar to the original motion.
3. Efficiency of the extracted pulses to estimate the dynamic behavior of structures
In this section, the results from Section 2 were investigated more deeply regarding the idea of the application of extracted pulse-like part of the acceleration records instead of the original records in dynamic analyses. To assess the capability of the extracted pulses in predicting the dynamic behavior of the structures, a 10-story steel special moment resisting frame was modeled. For this example frame, the modeling procedure and the obtained results are provided in the following sections.
3.1. Seismic design and modeling of example 10-story steel special moment resisting frame
For the numerical example, a 10 story high-rise residential steel building as shown in Fig. 8, having special moment resisting frame (SMRF) in both directions located in Tehran, Iran is chosen. The building has the same floor plan in all the stories and height of each story is 3.0 m having the total building height of 30.0 m. As shown in Fig. 8, the perimeter frames of the building are designed as the SMRF system to resist the lateral loads, while the interior frames are designed to carry the gravity loads.
Fig. 810-story structural steel building selected for numerical study
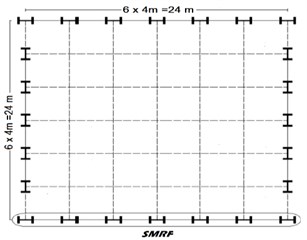
a) Plan view
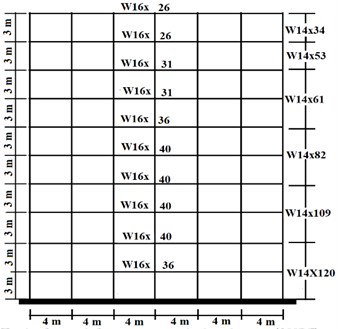
b) Typical special moment resisting frame (SMRF)
This structure is located in a region having very high level of seismic risk and on the type D soil condition based on ASCE/SEI 7-10 guideline categorization [10]. The structure is designed according to Load and Resistance Factor Design (LRFD) based on ASCE/SEI 7-10 and ANSI/AISC 360-10 [11].
The allowable story drift in this case is given to be equal to 0.02 [10]. The modal response spectrum analysis procedure including second order P-∆ effects was applied to analyze the structure. Due to the structural symmetry of the building plan, the structure was modeled in the form of a two-dimensional SMRF and similar cross-sections were defined for the beams and columns of all frames. The columns are considered fixed at the base. All the beams are designed as W16 sections. Typically, W14 sections are used for all steel columns in the SMRFs. Table 1 presents the final cross-sections used in designing the SMRFs along with the seismic effective weight of the stories.
Table 1Selected cross-sections and seismic effective weight in the special moment frames
Story | Beams | Columns | Seismic effective weight (KN) |
10 | W16X26 | W14X34 | 824 |
9 | W16X26 | W14X53 | 844 |
8 | W16X31 | W14X61 | 844 |
7 | W16X31 | W14X61 | 844 |
6 | W16X36 | W14X82 | 844 |
5 | W16X40 | W14X82 | 844 |
4 | W16X40 | W14X109 | 844 |
3 | W16X40 | W14X109 | 844 |
2 | W16X40 | W14X120 | 844 |
1 | W16X40 | W14X120 | 844 |
As Table 1 displays, various types of W14 sections were used for the columns of this structure. The underlying reason for selection of W14 sections was their high plastic rotation capacity.
An eigenvalue analysis was performed to determine the modal periods and the mode shapes of the structure. The first five modal periods were: 1.49, 0.53, 0.31, 0.21, and 0.15 s.
3.2. Numerical modeling for IDA analysis
To perform IDA, the frame is modeled in OpenSees software [12] which is able to perform nonlinear dynamic analysis. To model the building frame, its beams and columns were modeled using a fiber element; and the non-linear behavior of the structure was modeled based on the Modified Ibarra-Medina-Krawinkler (2005), (IMK) approach [13]. This model encompasses the relevant structural strength and stiffness deterioration behaviors, which are applied to evaluate collapse phenomenon of the structure. The mass parameter was precisely defined and imposed in the form of the concentrated mass in the joints. Based on Zareian and Medina’s studies [14], to impose the Rayleigh-type damping in the analyses, the damping ratio of 5 % of the critical value was taken into account for the first and fifth modes (i.e., five modes were required to reach a cumulative mass of 95 % of the total mass).
3.3. Ground motion selection
To evaluate a seismic performance of a structure, its behavior is to be determined under the effect of earthquake records. To fulfill this objective, the selected records should meet the following requirements [15]:
a) Requirements of Section 16.1.3 of the ASCE/SEI 7-10 (2010) guideline [10].
b) Records should represent the high ground motions related to the maximum considered earthquake (MCE).
Moreover, the number of selected records should be statistically sufficient such that the results of the structural collapse evaluation provide a reliable description of the median and collapse capacity. It is noteworthy that if the selected set of records covers all the uncertainties, a more precise estimation of the structural behavior can be expected. Since the current study aimed to examine the capability of the extracted pulses from the near-fault records in evaluating the steel structural collapse mechanism, in addition to the abovementioned requirements, these records should contain pulse-type form the required in near-fault events. For these reasons, the records reported in the NGA seismic database introduced as the pulse-type near-fault records category in the FEMA P-695 (2009) guideline [15], Appendix, was used in the present study. In this category, 14 pairs of earthquake records (a total of 28 components) were introduced whose distance of the recording stations were less than 10 kilometers from the fault rupture; moreover, all the records meet the pulse-type near-fault records requirements. List of these records are provided in Appendix.
It should be noted that the variation range of the records maximum PGA was between 0.22 g to 0.87 g having an average of 0.53 g. After selecting the records, all their pulses are extracted using the wavelet transform. Afterwards, to examine the capability of the extracted pulses for evaluating the structure performance, all the selected original records and their extracted pulses were applied on the structure and the IDA analysis was conducted.
3.4. Deterioration states and criterions of the structural collapse
In modern performance based earthquake engineering, selection of the limit states for various performance levels of the structures is considered as a very significant issue. The collapse states can be categorized from different viewpoints. These states are divided into local, median level and/or general subcategories for which some indicators can be defined. For the local collapse states, non-cumulative indicators in terms of displacement, cumulative indicators in terms of energy, and / or mixed indicators (a combination of both groups of indicators) can be used. For instance, Shinozoka’s ductility ratio [16], Dimova’s stories drift [17], and Ang and Park’s collapse indicators by Karim and Yamazaki [18] can be mentioned. Among these introduced indicators, the stories drift or the maximum inter-story displacement ratio are related to the non-cumulative local indicators which have been used by numerous scholars [19]. Since it can establish a better relationship with the collapse level of the structures due to its physical meaning, it was used as the collapse indicator in the current study.
Realistic and comprehensive definition of the limit states and thereby identifying the performance levels are the most important steps in seismic performance evaluation of the structures. Precise quantitative definition for qualitatively defining damage levels are based on experimental observations at the level of elements, engineering judgment and previous earthquake experiences. In the case of collapse in a steel structure, it can be stated that step-by-step extension of the damage in the structural elements (or forming plastic hinges) resulting from various sources, e.g. flange and/or web local buckling, lateral-torsional buckling, brittle failure in connections, etc., are the reasons leading to deterioration in the structural stiffness and forming mechanism which finally cause the structure to collapse. On the other hand, due to the intrinsic uncertainty being present in the seismic excitation input as well as uncertainty of the structural characteristics of the elements, it is possible that various failure modes occur in the structures before their collapse. As a result, it is necessary to define the baselines for various performance levels on the IDA curve in order to determine different damage thresholds in terms of the type of the structural collapse.
The current study used the limit states suggested in the FEMA-350 guideline [20]. In the FEMA-350, two main performance levels are defined for the slight and extensive structural damages including Immediate Occupancy (IO) and Collapse Prevention (CP), respectively. Accordingly, in the SMRFs, IO performance level corresponds to the 2 % maximum story drift, and CP performance level corresponds to drift values in which one of the following states occurs:
a) Numerical divergence of the analysis algorithm: The term “divergence” is used when the analysis conducted on the model in a certain step cannot find the structural response. Here, the structure uses all its capacities (the existing indeterminate degrees to resist against the external loading). In this case, due to formation of several plastic hinges and losing the structural stiffness of the members, by a slight increase in the load, either calculation of displacement response of the structure is impossible; or (in the case of existing hardening after yielding in the members) if possible, by decreasing the size of loading steps, very large structural displacements is obtained. In the case that the numerical divergence results from finishing the structural capacity for resisting against the external loading, the collapse of structure and its global instability can be assured by sufficient certainty. For instance, in the current study, the stories maximum drift considerably is increased in the sixth step of Hunt & Fill algorithm, as explained in Section 3.5.1, for the 10-story frame under the effect of El-Centro station record, which is shown as infinity () on row 6 in Table 2 indicating the structural instability.
b) The occurrence of a slope equal to 20 % of the primary elastic slope in IDA diagram: The IDA diagram is comparable to the base shear diagram against the building roof displacement obtained from the static pushover analysis in view of both conceptually and quantitatively. The incremental lateral loading which in pushover analysis is considered as the base shear, in the IDA analysis is replaced with the intensity measure (IM). In both diagrams, reduction of the structural stiffness makes the displacement-base shear diagram and/or demand-intensity measure diagram become horizontal which represents the consumption of the structure lateral loading capacity and its approach to the collapsing stage. As a result, by defining a certain limit for reduction of the diagram slope (determining a minimum value for the slope), it is possible to define a criterion for the structural collapse. In boundary condition criterion based on the seismic intensity (IM), occurring the limit , when is the Collapse Intensity measure, it can be considered as a rule for collapse. The slope of the IDA curve is an indicator of the structural capacity reaction. The FEMA guideline has defined a limit point for the collapse preventing (CP) performance level at which the slope of IDA curve reaches 20 % of the primary elastic slope.
c) Exceedance of the maximum story drift ratio from a threshold level of 10 %: It is frequently observed that determining the structural collapse based on the minimum slope and / or numerical divergence is at odd by the real observations and engineering experiences in view of the value created in the structure. In other words, the structural collapse is delayed till higher value of the expected . This is due to overlooking the effective displacement mechanisms which have important impacts on controlling the structural behavior. To overcome this problem, it is recommended to control the structural collapse through simultaneously applying two criteria: including the minimum slope and the maximum story drift ratio [21]. The current study followed this recommendation to determine the structural collapse; moreover, 0.1 criterion was also simultaneously controlled along with the slope criterion.
3.5. IDA analysis
Incremental dynamic analysis (IDA) method has recently received significant attention to evaluate the collapse level of the structures [22]. Nowadays, this method is proposed in the FEMA P-695 (2009) [15] guideline for evaluating the collapse level of the structures. Although the IDA concept seems to be simple, this analytical method needs to pay significant attention to obtain accurate results. Moreover, the analyst expects to have a continuous IDA curve which covers all ranges from linear elastic to non-linear plastic stage and complete collapse of the structure considering the desired intensity measure. However, taking the fact into account that conducting such a non-linear analysis is time- and money- consuming, the IDA analysis curve is to be drawn for a limited and optimal number of the intensity measure (IM) of the earthquake. In the present study, the records were scaled up from a small-scale factor to a large scale factor corresponding to the collapse level of the structure based on the well-known pattern to calculate the structural collapse using a systematic procedure which first was introduced by Vamvatsikos and Cornell [22].
3.5.1. “Hunt and fill” algorithm to scale ground motions
The seismic intensity measure (IM) values are to be selected precisely through an appropriate algorithm in incremental dynamic analysis procedure. An algorithm can be considered to be appropriate when taking two points into account. The first point is to minimize the analysis cost through optimizing the number of points for which the analysis is to be conducted. In fact, in the primary linear regions, the minimum number of points is required for analysis; while in non-linear area which the collapse is more probable, more points need to be analyzed in order to achieve adequate precision. The second more important point is the selection of the consecutive IMs for each earthquake record being adequate for its collapse level. It is mainly significant because it is observed from the structural behavior that there are considerable differences between the IM values corresponding to the collapse level in various earthquakes. Simple algorithms, e.g. incremental values algorithm having fixed step, meet none of the aforementioned requirements. As a result, more complete and comprehensive algorithms should be used (e.g. “Hunt & fill” algorithm) [22]. The general procedure of the “Hunt & fill” algorithm for the given 10-story frame and under the effect of one of the selected records of Table A1 is presented in Table 2 (El-Centro station record).
Table 2Results of “Hunt & fill” algorithm for the example 10-story SMRF structure subjected to the effect of El-Centro ground motion
NO | Calculations | (, 5 %) (g) | |
1 | – | 0.05 | 0.26 % |
2 | 0.05+0.1+1*0.05 | 0.2 | 0.98 % |
3 | 0.20+ 0.1+2*0.05 | 0.4 | 3.10 % |
4 | 0.40+ 0.1+3*0.05 | 0.65 | 5.35 % |
5 | 0.65+ 0.1+4*0.05 | 0.95 | 7.63 % |
6 | 0.95+ 0.1+5*0.05 | 1.3 | Identify |
7 | 0.95+(1.3-0.95)/3 | 1.0667 | 12.35 % Collapse |
8 | 0.95+(1.0667-0.95)/3 | 0.988 | 8.20 % |
9 | 0.988+(1.0667-0.988)/3 | 1.0148 | 8.58 % |
10 | 1.0148+(1.0667-1.0148)/3 | 1.032 | 9.44 % (CP) |
11 | (0.95+0.65)/2 | 0.8 | 5.69 % |
12 | (0.65+0.40)/2 | 0.525 | 3.05 % |
This algorithm, as its name speaks for itself, consists of two parts: Hunt and fill. In the beginning, the structure is kept in the linear area through choosing small values of the intensity measure (5 % was selected in the current study). Subsequently, in the Hunt stage, the collapse IM is obtained having a minimum number of the points. In this stage, the incremental length of IM grows up in a mutational manner and continues by the end of the collapse (point 1 in Table 2). As Table 2 shows, a rapid increase of IM and only through six repetitions, the structure reaches the collapse stage (point 7). Afterwards, having calculated the IM corresponding to the global collapse of the structure having adequate precision (points 8-10), the algorithm can become inversed and additional analyses can be conducted where the intervals of the analysis points are longer and can be due to revival phenomenon of the structure; moreover, collapse occurs in smaller scales which the analyst has not detected (points 11 and 12).
3.5.2. Results of IDA analysis
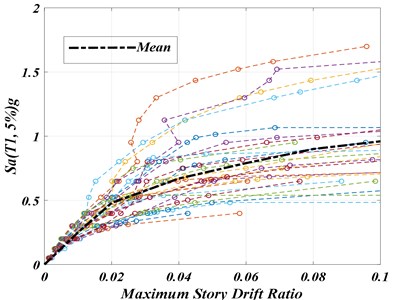
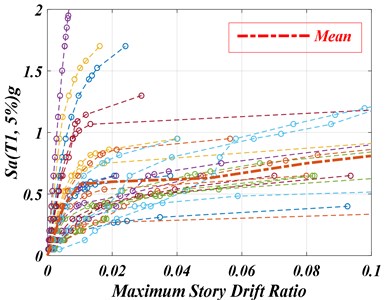
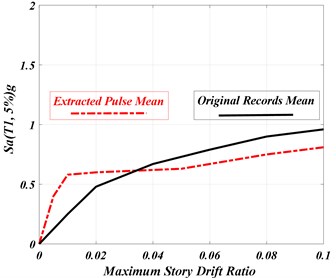
Fig. 9 compares the results of IDA analysis of the example 10-story SMRF subjected to the original El-Centro-Array #7 ground motion (1979) and its extracted pulse; furthermore, Fig. 10 illustrates the results of IDA analysis of the same frame under the effect of 28 components of the near-fault records and their extracted pulses. In addition, Fig. 11 compares the mean results of IDA analysis of the same frame under the effect of 28 components of the near-fault records and their extracted pulses.
In the present study, the accelerogram spectral response in the period of first vibrational mode of the example SMRF with 5 % damping, (, 5 %), was used as the intensity measure (IM) and the maximum story drift ratio is considered as the seismic demand of the structure. These results were obtained from more than 600 non-linear dynamic analyses of the example SMRF by changing the scale factor of the records from 0.05 g till collapse occurrence of the structure. As it was previously mentioned, these calculations are very boring and time-consuming and several days of continuous calculations are allocated to obtain the results by using fast and advanced personal computer systems. In the nonlinear incremental dynamic analysis (IDA), if the extracted pulses are being used instead of the original records, then the time length of the record (time duration of the analysis) is very short and limited in comparison with that of the original records. Therefore, if the results of the analyses are nearly identical under these two sets of records, then the original records can be replaced by their extracted pulses to increase the speed of analysis and save time in estimating the seismic capacity of the structures. The present study tries to address this issue.
Fig. 9IDA curves for the 10-story example SMRF subjected to original El-Centro ground motion and its extracted pulse
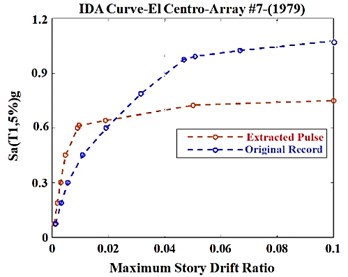
Fig. 10IDA curves for the 10-story example SMRF subjected to 28 components of the original near-fault ground motions and their extracted pulses
a) Original record
b) Extracted pulse
Examining the outputs of IDA analysis (Figs. 9 and 11) showed that in small displacements, in which the probability of entering to the non-linear area is low, the curves related to the extracted pulses were significantly different from those of the original records. In this situation, slope difference at the beginning of the IDA curves results from the contribution of the higher vibrational modes in dynamic behavior of the structure and thereof its collapse under the effect of the original records; while there is no such a behavior under extracted pulses. However, in large displacements in which the structure enters the non-linear stage and the stiffness decreases (CP level), the extracted pulses show less collapse capacity of the structure. In fact, using the extracted pulses instead of the original records to evaluate the structural collapse seems to be conservative and this is unlike the IO level which corresponds to the small displacements.
Fig. 11Comparison of the results of IDA mean curves
3.5.3. Seismic fragility
The output of IDA procedure is the collapse fragility curve. To provide the fragility curve of the structure, it is required to calculate the collapse capacity of the structure under the effect of each ground motion. The term “collapse capacity” refers to the intensity of the ground motions (e.g. spectral acceleration at the period of first vibrational mode of the structure) in which the structural system approaches the collapse level. Collapse capacity depends not only on the structural system characteristics but also on the characteristics of the entire waveform of the ground motion (the acceleration time history). In fact, the waveform is variable indicating the corresponding spectral acceleration, against which the structure can resists without collapse, is also uncertain. This variability is known as aleatory variability. In addition, the collapse capacity also depends on the design conservatism level, structural construction details, and the other structural characteristics resulting from the designer’s cognitive decisions. These uncertainties are known as epistemic uncertainties.
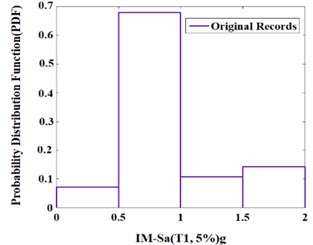
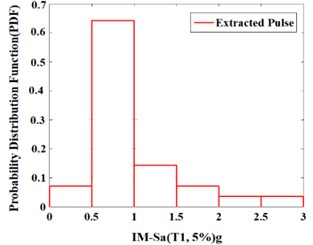
Fig. 12Probability distribution function (PDF) of the example 10-story SMRF for the near-fault records and their extracted pulses
a) Original record
b) Extracted pulse
If such uncertainties are overlooked, the collapse capacity equals to the hazard-based for which the structure was designed. The term “seismic fragility” refers to the collapse probability related to at the first period of the structure. This approach indicates that when the structure is designed based on the design earthquake (DE) ground motions and uncertainties are overlooked, it is expected that the structure might collapse having the probability of 10 % within 50 years. It is obvious that design of a structure for the uniform hazard of the ground motions having uncertainties in the collapse capacity does not lead to uniform collapse probability of the structure [23].
Fig. 12 represents the probability density function (PDF) of the collapse for the example SMRF which merely illustrates the record-to-record variability. These curves (which are represented discretely) are evaluated without considering the uncertainties; moreover, they can be used when the largest value is considered as the collapse capacity of the structure under the effect of corresponding ground motion. In fact, the results of the IDA analysis are the fundamental procedure of evaluating the collapse capacity of the structure.
3.5.4. Collapse fragility curve
As Fig. 10 displays, there is a record to record uncertainty in the collapse capacity of the structures. There are random nature of the earthquakes and numerous uncertainties in evaluating the seismic performance of the structures leading to the fact that estimating the performance of the structures is only possible through the probabilistic methods [24]. To determine the existing uncertainty in estimated seismic response of the structure through a probabilistic method, a probability distribution of an engineering demand parameter (EDP) should be chosen. Recent studies have shown that the log-normal distribution function best fits with the characteristics of the empirically evaluated distribution of the maximum inter-story drifts. In 2002, this distribution function was proposed by Cornell et al. [25].
In the present study, the collapse fragility curve was calculated by assuming a log-normal distribution for the collapse capacity. Fig. 13 illustrates the comparison of the cumulative distribution function (CDF) or the fragility curve of the example 10-story SMRF subjected to the effect of near-fault earthquakes and their extracted pulses, given in Table A1, at performance levels of Immediate Occupancy (IO) and Collapse Prevention (CP) based on FEMA-350 guideline.
Scrutinizing Fig. 13 shows that the fragility curves of the structure can be divided into two categories. In the first part, the region is related to the low periods in which the structural responses are mostly influenced by the high existing frequency fluctuations in the accelerograms and the pulses have no effects on the response. Hence, imposing the pulse instead of the original record leads to a conservative estimation of the structural dynamic capacity. However, in the second part, relatively long region, the extracted pulses might play a significant role in the structural seismic responses; moreover, this figure show that the estimated capacity pattern by the extracted pulses may be different with that of the original accelerograms and this is unlike with what occurs in reality and seems to be even unreliable in this part.
Fig. 13Comparison of the results of cumulative distribution function (CDF) for the example 10-story SMRF subjected to the effect of near-fault earthquakes and their extracted pulses considered in
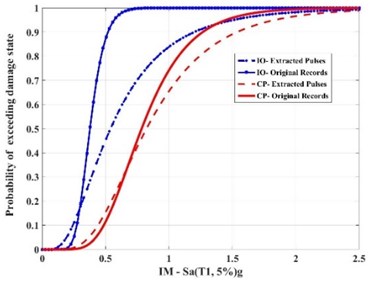
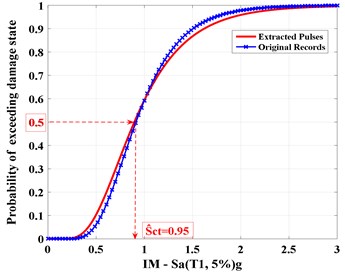
Fig. 14 displays the cumulative distribution function (CDF) of the given structure collapse as a function of the earthquake intensity.
The collapse capacity median value () corresponds to the seismic intensity under which the probability of structural collapse is 50 %. As the diagram illustrates, by processing the median fragility curves, the median value of the structural collapse capacity is determined under the influence of original records and the extracted pulses is nearly 0.95 and no significant difference is found between these two sets, i.e. the original records and extracted pulses. It is clear that the original records can be confidently replaced by the extracted pulses to evaluate the collapse of the steel structures.
Although drawing a general conclusion for all the special steel frame structures requires examining a larger number of structures having more stories, the results of the present study are related to a two-dimensional model of the structural system for the example 10-story SMRF which have similar ground motions characteristics to the characteristics used in the present study.
Fig. 14Comparison of the collapse fragility curves for the near-fault earthquakes and their extracted pulses
4. Discussion
The main objective of this research is to study the capability of extracted pulses as the representative of the near-fault original ground motion records to evaluate the seismic collapse performance of the special steel moment frames. If confirmed, use of the extracted pulses instead of the original records, increases the speed and saves time when estimating the seismic capacity of the structures. In Fig. 15, ratio of the extracted pulse- IM to original record-IM resulted from the IDA in the prediction of collapse capacity by the use of extracted pulse instead of the original ground motion record is plotted. In this figure, vertical axis shows the ratio of the mean accelerogram spectral response () of the extracted pulse to that of the original record obtained from the IDA outputs.
This figure shows that in small displacement, the maximum difference between the IM predicted by the original record and the extracted pulse is nearly 150 %, and this means that at this stage, the use of the extracted pulse instead of the original record can be unreliable. However, in high drift ratios and at the onset of the instability of the structure and taking the structural softening into account, the use of extracted pulses instead of the original records results in a conservative estimation of the structural dynamic capacity.
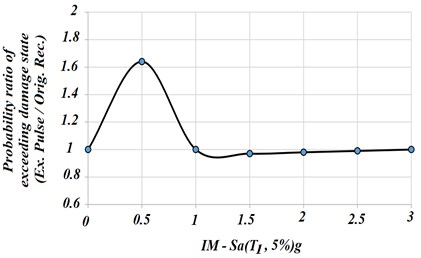
Fig. 16 shows the probability ratio of exceeding damage state of the structure subjected to the extracted pulse and the original records. It can be observed that in the beginning of the figure where the IM is less than 1g that is related to the low periods in which the structural responses are mostly influenced by the high existing frequency fluctuations in the accelerograms; the pulses have no effects on the responses. Hence, imposing the pulse instead of the original record leads to a conservative estimation of the structural dynamic capacity. However, when the curve continues, in the IM more than 1g, the estimated collapse capacity by the extracted pulses may be less from that of the original accelerograms and this is unlike with what occurs in reality. However, this difference is expected because the maximum error is less than 5 % within reasonable limits, and considering the saving time and computational effort, the original near-fault ground motion records can efficiently be substituted by the extracted pulses for design verification and performance assessment of the structures.
Fig. 15Ratio of the extracted pulse-IM to the original record-IM
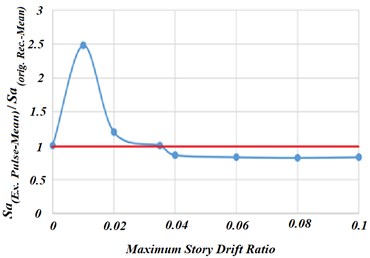
Fig. 16Probability ratio of exceeding damage state resulted from the extracted pulse and the original record
5. Conclusions
The accelerograms recorded in near-fault regions had wide frequency content due to the short distance from the wave emission source. Moreover, in some special geometrical conditions, i.e. when the seismic waves move to a given site, if the fault fracture velocity is close to the seismic wave propagation velocity, then high-period pulses are observed in velocity record at the site. The current study used a wavelet analysis and extracted the existing pulses in 28 velocity records in near-fault regions. Subtracting the extracted pulses from the original records resulted to wide-frequency content records which are due to the close location to the fault.
From the incremental non-linear dynamic analysis of the example building structure subjected to 28 components of selected near-fault original records and their extracted pulses, it is found that:
1) The extracted pulses are efficient to predict the non-linear response of the steel special moment frames subjected to near-fault ground motions containing forward rupture directivity pulses in their velocity record. Non-linear dynamic analysis of the structures having large number of degrees of freedom can be computationally demanding and time consuming. It is believed that substituting the original record with the extracted pulse can be effective to save computational effort and time for regular frame structures.
2) The results of IDA of the structures under the influence of the original records and their extended pulses showed that in low relative displacements, the capacity pattern estimated by the extracted pulses may differ compared to that of estimated by the original records. This is unlike what occurs in reality seeming to be unreliable; however, in high drift ratios and at the onset of the instability of the structure and taking the structural softening into account, the use of extracted pulses instead of the original records results in a conservative estimation of the structural dynamic capacity.
3) Using the median value of collapse () demonstrates that the extracted pulses can be used more certainly in order to evaluate collapse of the structure. In the present study, the median value of collapse resulted from the extracted pulses has lower degree of error compared to that of the original records. Nevertheless, it is required to examine higher number of structures with more stories in order to obtain more precise results.
4) By noting to the results presented in the 1 and 2 above, it can be stated that the application of the extracted pulses to estimate the structure capacity depends on the performance level of the structure. If the performance level of the structure is immediate occupancy (IO, low drift), then the application of the extracted pulses leads to overestimation of the structure capacity, and this is on the unsafe side; while if the structure is at the collapse prevention (CP) threshold and experiences high levels of non-elastic displacements, the extracted pulses lead to a conservative estimation of the collapse capacity.
References
-
Mavroeidis G. P., Papageorgiou A. S. A mathematical representation of near-fault ground motions. Bulletin of the Seismological Society of America, Vol. 93, Issue 3, 2003, p. 1099-1131.
-
Alavi B., Krawinkler H. Effects of Near-Fault Ground Motions on Frame Structures. Blume Earthquake Engineering Center Stanford, 2001.
-
Baker J. W. Quantitative classification of near-fault ground motions using wavelet analysis. Bulletin of the Seismological Society of America, Vol. 97, Issue 5, 2007, p. 1486-1501.
-
Ghahari S. F., Jahankhah H., Ghannad M. A. Study on elastic response of structures to near-fault ground motions through record decomposition. Soil Dynamics and Earthquake Engineering, Vol. 30, Issue 7, 2010, p. 536-546.
-
Mollaioli F., Bosi A. Wavelet analysis for the characterization of forward-directivity pulse-like ground motions on energy basis. Meccanica, Vol. 47, Issue 1, 2012, p. 203-219.
-
Goupillaud P., Grossmann A., Morlet J. Cycle-octave and related transforms in seismic signal analysis. Geoexploration, Vol. 23, Issue 1, 1984, p. 85-102.
-
Haigh S., et al. Applications of wavelet analysis to the investigation of the dynamic behaviour of geotechnical structures. Soil Dynamics and Earthquake Engineering, Vol. 22, Issue 9, 2002, p. 995-1005.
-
Misite M., et al. Wavelet Toolbox: Computation, Visualization, and Programming. User’s Guide, 2002.
-
Kardoutsou V., Taflampas I., Psycharis I. A new method for the classification of ground motions as pulse-like or non pulse-like. Proceedings of 2nd European Conference on Earthquake Engineering and Seismology, Istanbul, Turkey. 2014.
-
Minimum Design Loads for Buildings and Other Structures. American Society of Civil Engineers, ASCE 7-10, Reston, VA, USA, 2010.
-
Specification for Structural Steel Buildings. An American National Standard, ANSI/AISC 360-10, American Institute of Steel Construction, Chicago, Illinois, USA, 2010.
-
Open System for Earthquake Engineering Simulation. OpenSees, V.2.5.0, Pacific Earthquake Engineering Research Center, Berkeley, CA, USA, 2016.
-
Ibarra L. F., Medina R. A., Krawinkler H. Hysteretic models that incorporate strength and stiffness deterioration. Earthquake Engineering and Structural Dynamics, Vol. 34, Issue 12, 2005, p. 1489-1511.
-
Zareian F., Medina R. A. A practical method for proper modeling of structural damping in inelastic plane structural systems. Computers and Structures, Vol. 88, Issue 1, 2010, p. 45-53.
-
Quantification of Building Seismic Performance Factors. Federal Emergency Management Agency, 2009.
-
Shinozuka M., et al. Statistical analysis of fragility curves. Journal of Engineering Mechanics, Vol. 126, Issue 12, 2000, p. 1224-1231.
-
Dimova S. L., Hirata K. Simplified seismic fragility analysis of structures with two types of friction devices. Earthquake Engineering and Structural Dynamics, Vol. 29, Issue 8, 2000, p. 1153-1175.
-
Karim K. R., Yamazaki F. A simplified method of constructing fragility curves for highway bridges. Earthquake Engineering and Structural Dynamics, Vol. 32, Issue 10, 2003, p. 1603-1626.
-
Porter K. A., Kiremidjian A. S., Legrue J. S. Assembly-based vulnerability of buildings and its use in performance evaluation. Earthquake Spectra, Vol. 17, Issue 2, 2001, p. 291-312.
-
Recommended Seismic Design Criteria for New Steel Moment Frame Buildings. Report No, FEMA-350, Washington, DC, 2000.
-
Vamvatsikos D., Cornell C. A. Incremental dynamic analysis. Earthquake Engineering and Structural Dynamics, Vol. 31, Issue 3, 2002, p. 491-514.
-
Vamvatsikos D., Cornell C. A. Applied incremental dynamic analysis. Earthquake Spectra, Vol. 20, Issue 2, 2004, p. 523-553.
-
Luco N., et al. Risk-targeted versus current seismic design maps for the conterminous United States. SEAOC Convention -Proceedings, 2007.
-
Vetr M. G., Nouri A. R., Kalantari A. Seismic evaluation of rocking structures through performance assessment and fragility analysis. Earthquake Engineering and Engineering Vibration, Vol. 15, Issue 1, 2016, p. 115-127.
-
Paté‐Cornell E., Finding and fixing systems weaknesses: probabilistic methods and applications of engineering risk analysis. Risk Analysis, Vol. 22, Issue 2, 2002, p. 319-334.
