Abstract
199 earthquake records with reliable information are selected from the PEER and NIED firstly, and the Seismo Signal software is applied to correct the baseline of original earthquake records. Then the basic characteristics and strength parameters under near-fault/far-field long-period ground motions and common ground motions are compared. Moreover, the influence on basic strength parameters affected by earthquake magnitude, rupture distance (or epicenter distance) and site condition under near-fault/far-field long-period ground motions is analyzed one by one. Study results are obtained as follows: Near-fault earthquake has high amplitude intensity and short strong-shock duration, and its energy release process is concentrated in a short time. A Far-field earthquake has a small peak of acceleration, velocity, displacement and long strong-shock duration, and its energy release process is mild. The strength parameter index under long-period ground motions is beyond 0.2, and its frequency distribution is concentrated within the low-frequency band (0.1-1.0 Hz) while the frequency distribution of common ground motions is concentrated within a relatively high-frequency band (1.0-2.3 Hz); The strength parameter indexes , , , and under near-fault earthquake are greater than those under far-field earthquake. For a near-fault earthquake, the parameter index PGA decreases, and the strong-shock duration increases with the earthquake magnitude from 6.6 to 7.3, while the parameter index PGA, PGV decreases and PGV/PGA, strong-shock duration increase with the increases of rupture distance. Site-soil condition is the key factor affecting the basic strength parameter index under far-field earthquake, and the PGA, PGV parameter indexes increase under far-field earthquake with the site soil condition from class C to D and E. It is suggested to be related to the effect of filtering out high-frequency components and amplifying low-frequency components in soft site-soil.
1. Introduction
The enlargement of the database of recorded ground motions from recent earthquakes (e.g., Northridge earthquake 1994, Chi-Chi earthquake 1999, Wenchuan earthquake 2008, Great East Japan earthquake 2011, Kumamoto earthquake 2016) has shown that, there are obvious long-period components in the ground motions [1-5]. At the same time, long-period structures increase continuously with the development of economy. The seismic performances of long-period structures (for example, bridges [6], tunnels [7], dams [8], and high-rise buildings [9]) have been extensively investigated, and the seismic damage of long-period structures would undoubtedly be tested by long-period ground motions in the future.
Two types of ground motions in the existing records are considered as special long-period ground motions, besides one is near-fault pulse-like ground motion, and the other is far-field harmonic ground motion [10]. Near-fault ground motion, referring to a particular distance from the fault rupture surface (i.e. rupture distance) within 20 km, includes an obvious rupture-directivity effect and fling-step effect strongly dependent on the mechanism of fault-rupture. Near-fault ground motion has relatively high amplitude intensity, and its peak of vertical and horizontal acceleration is generally large. Near-fault ground movement often shows strong destructive capacity on a structure, as a result of its obvious pulse-like characteristic and even large permanent ground displacement. Far-field ground motion, which refers to a particular distance from site soil to source (i.e. epicentral distance) beyond 200 km, and its spectral characteristic depends on the site condition of observation station and the selection of site soil in the propagation of seismic wave. Far-field ground motion has a relatively long duration and small peak of acceleration, and it contains a relatively high proportion of low-frequency components in the spectral characteristic. The resonant effect on long-period structures acted by long-period ground motions, including near-fault pulse-like ground motions and far-field harmonic ground motions, has attracted wide attention from seismology and engineering scholars. The identification methods [11], modeling techniques [12-15] and characterizations of long-period ground motions [16], as well as their effects on engineering structures [17], are currently active research topics.
At present, the assessment method of long-period ground motions according to the selection principle of seismic wave and the one of dealing and correction of the original earthquake records, is a necessary step before studying the basic characteristics and estimating the strength parameters of earthquake records. At the same time, the ground movement is soil vibration caused by released seismic waves near the Earth's surface, and it is a complex phenomenon affected by source mechanism, earthquake magnitude, epicentral distance, spreading media, spreading path and site condition and so on. Some scholars have introduced similar factors into the study of long-period ground motions, but they are not comprehensive, and most of them only focus on one type of long-period ground motions. The relationship between the basic characteristics and earthquake parameters (earthquake magnitude, epicenter distance) under near-fault pulse-like ground motions is analyzed [18, 19]. However, in addition to the earthquake magnitude and epicenter distance, the site condition [20] can also influence the strength parameters. Therefore, the studies on influencing factors of earthquake records may provide valuable insights for better understanding of the characteristics of long-period ground motions.
In this paper, 199 earthquake records with reliable information are selected firstly, the Seismo Signal software is used to deal with and correct these original earthquake records. Then the basic characteristics and strength parameters of earthquake records under long-period ground motions and common ground motions are analyzed and compared. Moreover, the influence on strength parameters affected by earthquake magnitude, rupture distance (or epicenter distance) and site condition under near-fault (or far-field) long-period ground motions is analyzed one by one.
2. Selection and processing of long-period earthquake records
2.1. Selection of long-period earthquake records
Based on the characteristic of long-period ground motions and on the selection principle of seismic waves [21-23], the earthquake records, whose spectral components concentrate within 0.1-1.0 Hz are considered to be long-period ground motions according to the frequency distribution of the Fourier amplitude spectrum. 89 near-fault pulse-like ground motion records and 100 far-field harmonic ground motion records are selected from the Pacific Earthquake Engineering Research Center (PEER) and National Research Institute for Earth Science and Disaster Resilience (NIED). In order to study the characteristic of long-period ground motions deeply, 10 common ground motion records are selected for a comparative analysis with long-period ground motions. The US NEHRP classification criteria are adopted to calculate the site condition of selected ground motion records, and all the earthquake records are classified as a different site class on the basis of specification clauses. Table 1, Table 2, and Table 3 show the basic information of near-fault ground motion records, far-field ground motion records and common ground motion records, respectively.
Table 1Basic information of near-fault pulse-like ground motion records
Station/ component | Rupture distance | Site class | Station/ component | Rupture distance | Site class | Station/ component | Rupture distance | Site class | |||
1085_SCE018 | 6.6 | 5.2 | C | 953_MUL009 | 6.6 | 17.1 | D | TCU116-NS | 7.3 | 12.38 | C |
1085_SCE288 | 6.6 | 5.2 | C | 953_MUL279 | 6.6 | 17.1 | D | CHY035-EW | 7.3 | 12.65 | C |
1084_SCS052 | 6.6 | 5.3 | D | 1016_NYA090 | 6.6 | 18.5 | C | CHY035-NS | 7.3 | 12.65 | C |
1084_SCS142 | 6.6 | 5.3 | D | 1016_NYA180 | 6.6 | 18.5 | C | TCU104-EW | 7.3 | 12.87 | C |
1086_SYL090 | 6.6 | 5.3 | C | 1012_LA0000 | 6.6 | 19.1 | C | TCU104-NS | 7.3 | 12.87 | C |
1086_SYL360 | 6.6 | 5.3 | C | 1012_LA0090 | 6.6 | 19.1 | C | TCU109-EW | 7.3 | 13.06 | C |
1045_WPI046 | 6.6 | 5.5 | D | TCU068-EW | 7.3 | 0.32 | C | TCU109-NS | 7.3 | 13.06 | C |
1045_WPI316 | 6.6 | 5.5 | D | TCU068-NS | 7.3 | 0.32 | C | TCU128-EW | 7.3 | 13.13 | C |
1013_LDM064 | 6.6 | 5.9 | C | TCU065-EW | 7.3 | 0.57 | D | TCU128-NS | 7.3 | 13.13 | C |
1013_LDM334 | 6.6 | 5.9 | C | TCU065-NS | 7.3 | 0.57 | D | TCU074-EW | 7.3 | 13.46 | C |
1044_NWH090 | 6.6 | 5.9 | D | TCU052-EW | 7.3 | 0.66 | C | TCU074-NS | 7.3 | 13.46 | C |
1044_NWH360 | 6.6 | 5.9 | D | TCU052-NS | 7.3 | 0.66 | C | TCU048-EW | 7.3 | 13.53 | C |
1063_RRS228 | 6.6 | 6.5 | D | TCU102-EW | 7.3 | 1.49 | C | TCU048-NS | 7.3 | 13.53 | C |
1063_RRS318 | 6.6 | 6.5 | D | TCU102-NS | 7.3 | 1.49 | C | CHY034-EW | 7.3 | 14.82 | C |
1050_PAC175 | 6.6 | 7 | A | CHY080-EW | 7.3 | 2.69 | C | CHY034-NS | 7.3 | 14.82 | C |
1050_PAC265 | 6.6 | 7 | A | CHY080-NS | 7.3 | 2.69 | C | TCU123-EW | 7.3 | 14.91 | D |
1052_PKC090 | 6.6 | 7.3 | C | TCU103-EW | 7.3 | 6.08 | C | TCU123-NS | 7.3 | 14.91 | D |
1052_PKC360 | 6.6 | 7.3 | C | TCU087-NS | 7.3 | 6.98 | C | TCU107-EW | 7.3 | 15.99 | C |
949_ARL090 | 6.6 | 8.7 | D | TCU120-EW | 7.3 | 7.4 | C | TCU107-NS | 7.3 | 15.99 | C |
949_ARL360 | 6.6 | 8.7 | D | TCU136-EW | 7.3 | 8.27 | C | TCU064-EW | 7.3 | 16.59 | C |
1082_RO3000 | 6.6 | 10.1 | D | TCU136-NS | 7.3 | 8.27 | C | TCU064-NS | 7.3 | 16.59 | C |
1082_RO3090 | 6.6 | 10.1 | D | CHY006-EW | 7.3 | 9.76 | C | CHY104-EW | 7.3 | 18.02 | D |
960_LOS000 | 6.6 | 12.4 | D | CHY006-NS | 7.3 | 9.76 | C | CHY104-NS | 7.3 | 18.02 | D |
960_LOS270 | 6.6 | 12.4 | D | TCU138-NS | 7.3 | 9.78 | C | CHY025-EW | 7.3 | 19.07 | D |
1083_GLE170 | 6.6 | 13.3 | C | TCU063-EW | 7.3 | 9.78 | C | CHY025-NS | 7.3 | 19.07 | D |
1083_GLE260 | 6.6 | 13.3 | C | TCU063-NS | 7.3 | 9.78 | C | TCU036-EW | 7.3 | 19.83 | C |
1080_KAT000 | 6.6 | 13.4 | C | CHY029-EW | 7.3 | 10.96 | C | TCU036-NS | 7.3 | 19.83 | C |
1080_KAT090 | 6.6 | 13.4 | C | CHY029-NS | 7.3 | 10.96 | C | TCU039-EW | 7.3 | 19.89 | C |
1087_TAR090 | 6.6 | 15.6 | D | TCU100-NS | 7.3 | 11.37 | C | TCU039-NS | 7.3 | 19.89 | C |
1087_TAR360 | 6.6 | 15.6 | D | TCU116-EW | 7.3 | 12.38 | C |
2.2. Processing of long-period earthquake records
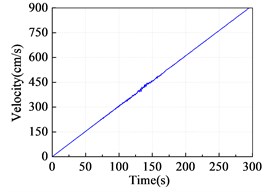
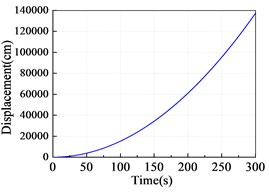
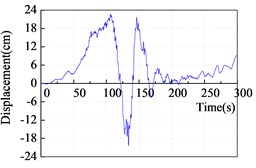
Earthquake records obtained from seismic stations contain both ground vibration information purely caused by earthquake, and much complex interference such as background noise and instrumental errors, and the long-period components of these interferences drift the baseline of time-history curve under earthquake records. This phenomenon of baseline drifting does not usually have a significant effect on the acceleration time-history itself (typically not beyond 3 % of the acceleration peak). However, during a calculation of a velocity and displacement time-history, the baseline drifting would gradually accumulate with the numerical integration of acceleration, and it eventually results in great distortion of velocity and displacement time-history. In order to remove the effect of non-seismic factors, it is necessary to correct the baseline of time-history under earthquake records before they are used for a study.
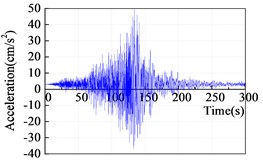
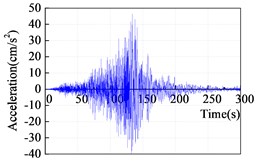
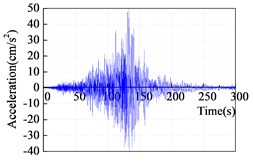
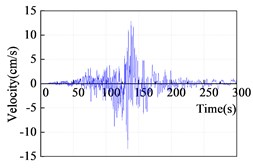
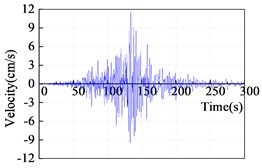
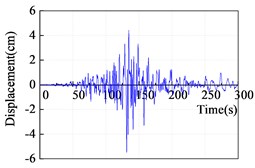
When the Seismo Signal software is applied to correct the baseline of original earthquake records, the polynomial Linear type is used to adjust the baseline, and the high-pass filtering Butterworth type is used to correct the existed baseline drifting, and the low-frequency components of earthquake records are considered as much as possible to be retained in the filtering correction process. Taking as an example of a far-field harmonic ground motion record of YMN010-NS, Fig. 1(a) shows a time-history of original ground motion, Fig. 1(b) shows a time-history after the baseline adjustment, and Fig. 1(c) shows a time-history after the high-pass filtering.
Table 2Basic information of far-field harmonic ground motion records
Station/ component | Epicenter distance | Site class | Station/ component | Epicenter distance | Site class | Station/ component | Epicenter distance | Site class | |||
EHMH07-EW2 | 7.0 | 203 | D | NGN024-EW | 7.0 | 721 | D | YMT002-EW | 9.0 | 236 | D |
EHMH07-NS2 | 7.0 | 203 | D | NGN024-NS | 7.0 | 721 | D | YMT002-NS | 9.0 | 236 | D |
EHM016-EW | 7.0 | 213 | D | IUBH03-EW | 8.0 | 206 | E | YMTH12-EW2 | 9.0 | 256 | C |
EHM016-NS | 7.0 | 213 | D | IUBH03-NS | 8.0 | 206 | E | YMTH12-NS2 | 9.0 | 256 | C |
SMNH09-EW2 | 7.0 | 233 | C | HKD130-EW | 8.0 | 241 | C | FKSH03-EW2 | 9.0 | 279 | D |
SMNH09-NS2 | 7.0 | 233 | C | HKD130-NS | 8.0 | 241 | C | FKSH03-NS2 | 9.0 | 279 | D |
EHMH04-EW2 | 7.0 | 249 | D | ABSH04-EW2 | 8.0 | 280 | C | NIG009-EW | 9.0 | 310 | E |
EHMH04-NS2 | 7.0 | 249 | D | ABSH04-NS2 | 8.0 | 280 | C | NIG009-NS | 9.0 | 310 | E |
HRS004-EW | 7.0 | 260 | C | HKD151-EW | 8.0 | 318 | D | AOMH10-EW2 | 9.0 | 336 | D |
HRS004-NS | 7.0 | 260 | C | HKD151-NS | 8.0 | 318 | D | AOMH10-NS2 | 9.0 | 336 | D |
KOCH13-EW2 | 7.0 | 285 | C | AOM018-EW | 8.0 | 343 | C | AOM019-EW | 9.0 | 366 | E |
KOCH13-NS2 | 7.0 | 285 | C | AOM018-NS | 8.0 | 343 | C | AOM019-NS | 9.0 | 366 | E |
OKYH06-EW2 | 7.0 | 333 | C | HKD025-EW | 8.0 | 374 | D | CHBH20-EW2 | 9.0 | 416 | A |
OKYH06-NS2 | 7.0 | 333 | C | HKD025-NS | 8.0 | 374 | D | CHBH20-NS2 | 9.0 | 416 | A |
TKS005-EW | 7.0 | 360 | D | AKT013-EW | 8.0 | 399 | C | NIGH17-EW2 | 9.0 | 443 | C |
TKS005-NS | 7.0 | 360 | D | AKT013-NS | 8.0 | 399 | C | NIGH17-NS2 | 9.0 | 443 | C |
TTR006-EW | 7.0 | 404 | D | AKT018-EW | 8.0 | 437 | D | YMN010-EW | 9.0 | 472 | C |
TTR006-NS | 7.0 | 404 | D | AKT018-NS | 8.0 | 437 | D | YMN010-NS | 9.0 | 472 | C |
OSK010-EW | 7.0 | 454 | D | YMT001-EW | 8.0 | 482 | E | YMNH13-EW2 | 9.0 | 500 | B |
OSK010-NS | 7.0 | 454 | D | YMT001-NS | 8.0 | 482 | E | YMNH13-NS2 | 9.0 | 500 | B |
NAR007-EW | 7.0 | 490 | C | YMTH14-EW2 | 8.0 | 513 | D | HKD102-EW | 9.0 | 531 | D |
NAR007-NS | 7.0 | 490 | C | YMTH14-NS2 | 8.0 | 513 | D | HKD102-NS | 9.0 | 531 | D |
KYTH04-EW2 | 7.0 | 523 | B | YMT015-EW | 8.0 | 548 | E | SZOH53-EW2 | 9.0 | 562 | B |
KYTH04-NS2 | 7.0 | 523 | B | YMT015-NS | 8.0 | 548 | E | SZOH53-NS2 | 9.0 | 562 | B |
MIEH03-EW2 | 7.0 | 557 | C | FKS020-EW | 8.0 | 580 | E | AIC005-EW | 9.0 | 599 | D |
MIEH03-NS2 | 7.0 | 557 | C | FKS020-NS | 8.0 | 580 | E | AIC005-NS | 9.0 | 599 | D |
MIEH07-EW2 | 7.0 | 587 | C | FKSH21-EW2 | 8.0 | 640 | C | AIC003-EW | 9.0 | 636 | E |
MIEH07-NS2 | 7.0 | 587 | C | FKSH21-NS2 | 8.0 | 640 | C | AIC003-NS | 9.0 | 636 | E |
AIC001-EW | 7.0 | 620 | E | NIGH11-EW2 | 8.0 | 687 | C | HKD030-EW | 9.0 | 676 | D |
AIC001-NS | 7.0 | 620 | E | NIGH11-NS2 | 8.0 | 687 | C | HKD030-NS | 9.0 | 676 | D |
AIC015-EW | 7.0 | 654 | D | NGNH28-EW2 | 8.0 | 763 | B | ABSH01-EW2 | 9.0 | 714 | B |
AIC015-NS | 7.0 | 654 | D | NGNH28-NS2 | 8.0 | 763 | B | ABSH01-NS2 | 9.0 | 714 | B |
GIFH24-EW2 | 7.0 | 683 | B | MYG005-EW | 9.0 | 208 | D | ||||
GIFH24-NS2 | 7.0 | 683 | B | MYG005-NS | 9.0 | 208 | D |
Table 3Basic information of common ground motion records
Station/ component | Rupture distance | Site class | Station/ component | Rupture distance | Site class | Station / component | Rupture distance | Site class | |||
ELC000 | 5.0 | 34.98 | D | OKA000 | 6.9 | 86.94 | C | TAF021 | 7.36 | 38.89 | C |
ELC090 | 5.0 | 34.98 | D | OKA090 | 6.9 | 86.94 | C | TAF111 | 7.36 | 38.89 | C |
ELC180 | 6.59 | 6.09 | D | TAB-L1 | 7.35 | 2.05 | B | ||||
ELC270 | 6.59 | 6.09 | D | TAB-T1 | 7.35 | 2.05 | B |
3. Basic property and strength parameter of long-period earthquake records
3.1. Basic property of long-period earthquake records
3.1.1. Amplitude of earthquake records
The amplitude of earthquake records generally refers to the peak of acceleration, velocity and displacement time history of ground motions (i.e. PGA, PGV and PGD). In order to take into account the interaction between peaks of acceleration, velocity and displacement with various frequency components, some scholars have proposed other parameter indexes such as the peak-ratio of velocity to acceleration (i.e. PGV/PGA), and 0.2 (value of PGV/PGA) is considered as the basis to distinguish long-period ground motions from common ground motions [24].
Fig. 1Baseline correction of YMN010-NS: a) original ground motion record; b) after baseline adjustment; c) after high-pass filter
a)
b)
c)
The peak and peak-ratio of 89 near-fault, 100 far-field and 10 common ground motion records are calculated respectively, including the peak of acceleration (PGA), peak of velocity (PGV), peak of displacement (PGD), peak-ratio of velocity to acceleration (PGV/PGA), peak-ratio of displacement to acceleration (PGD/PGA), peak-ratio of displacement to velocity (PGD/PGV). In addition, the PGA-ratio of vertical component to horizontal component is calculated for three types of ground motions to characterize their various effects on the vertical acceleration.
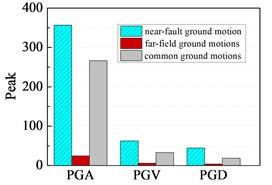
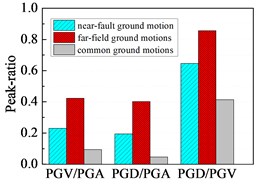
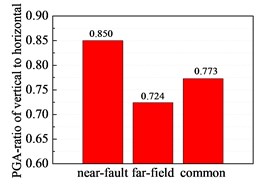
Fig. 2 shows the peak and peak-ratio of earthquake records under three kinds of ground motions. With reference to Fig. 2(a), the following conclusions can be drawn: Near-fault ground motion has relatively high amplitude intensity, and the PGA, PGV and PGD are 1.34, 1.91 and 2.44 times of those under common ground motions, respectively. The amplitude intensity under far-field ground motion is gradually attenuated due to the increase of epicentral distance, and the PGA, PGV and PGD only reach 10 %, 18 % and 20 % of those under common ground motions. It can be seen that the effect of surface wave excitation and field soil amplification on far-field ground motions cannot be ignored. The peak of near-fault ground motions is much larger than that of far-field ground motions, and the PGA, PGV under near-fault ground motions are 14.7 and 10.5 times of those under far-field ground motions, respectively. This is a further proof that the near-fault ground motion usually has relatively high intensity, while the peak of acceleration, velocity and displacement under far-field ground motion are relatively small. With reference to Fig. 2(b), the following conclusions can be drawn: The peak-ratio of PGV/PGA, PGD/PGA and PGD/PGV under two types of long-period ground motions are higher than those under common ground motions, and even many scholars have used PGV/PGA > 0.2 as an index to identify long-period pulse-like ground motions. From the statistical result of Fig. 2(b), it can be seen that the pulse characteristics of near-fault pulse-like and far-field harmonic ground motions are indeed obvious. The peak-ratios of PGV/PGA, PGD/PGA and PGD/PGV under far-field ground motions are greater than those under near-fault ground motions, while the peaks of PGA, PGV and PGD under far-field ground motions are much smaller than those under near-fault ground motion. Therefore, in order to comprehensively evaluate the movement characteristics during earthquake excitation, the single index of ground acceleration, velocity and displacement peak is not only to be considered, but also the interaction between the ground acceleration, velocity and displacement peak is required to be taken into account. With reference to Fig. 2(c), the following conclusions can be drawn: The PGA-ratio of vertical component to horizontal component under near-fault ground motions is significantly greater than that under common ground motions, while the PGA-ratio of a vertical component to horizontal component under far-field ground motions is slightly less than that under common ground motions. This significant difference indicates that the effect of vertical acceleration under near-fault ground motions is more obvious than that under far field ground motions, so its vertical seismic effect on the structure would be greater under near-fault ground motions. Therefore, when the seismic damage mechanism on flexible structures, long-cantilever structures and large-span structures under long-period ground motions is analyzed, its vertical acceleration component under near-fault long-period ground motions cannot be neglected.
Fig. 2Peak and peak-ratio of earthquake records: a) peak; b) peak-ratio; c) PGA-ratio of vertical component to horizontal component of earthquake records
a)
b)
c)
3.1.2. Spectral characteristic of earthquake records
Some cases of structural seismic damage have been analyzed in recent years, and it is clear that the spectral characteristic of earthquake records has a significant impact on the structural response. If the predominant frequency of earthquake records is concentrated within the low-frequency band, it would cause a huge reaction on the long-period structures. On the other hand, if the seismic predominant frequency is concentrated within the high-frequency band, it is more harmful to rigid structures. Therefore, the spectral characteristic is one of the most important elements to describe the characteristics of earthquake records.
Fourier amplitude spectrum reflects the energy distribution of earthquake records in the frequency domain, and it shows the energy carried by harmonic vibration at various frequency components. The Fourier amplitude spectrum, expressing what kind of frequency components contained by earthquake records, clearly shows the ground motion corresponding to the amplitude content at a various frequency component. It also exhibits the corresponding amplitude value at each frequency component and the maximum amplitude value at a specific frequency component. Power spectral density amplitude, being defined as the mean square value of Fourier amplitude spectrum underground motions , is a physical quantity to describe the stochastic process characteristic in the frequency domain [25]. It also reflects the energy distribution of earthquake records on the frequency axis.
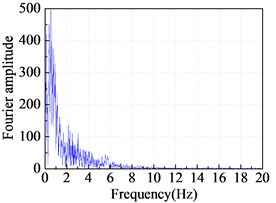
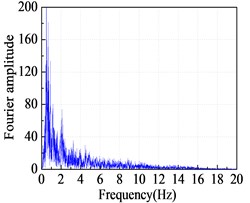
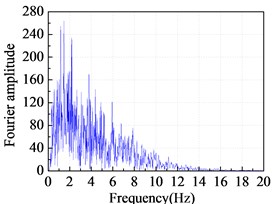
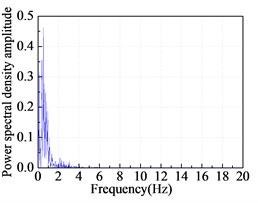
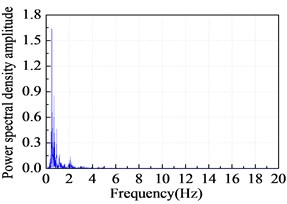
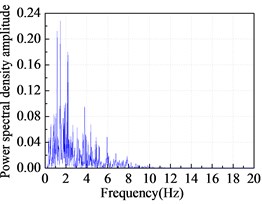
Taking as examples a near-fault pulse-like ground motion of TCU052-NS, far-field harmonic ground motion of YMN010-NS and common ground motion of ELC180, Fig. 3 shows the Fourier amplitude spectrum, and Fig. 4 shows the Power spectral density amplitude of earthquake records. With reference to Fig. 3, the following conclusions can be drawn: The low-frequency components of TCU052-NS and YMN010-NS are abundant, and the energy distribution of TCU052-NS is mainly concentrated within 0.12-0.84 Hz, while the energy distribution of YMN010-NS is mainly concentrated within 0.34-0.95Hz. It shows that the frequency distribution of long-period ground motions is concentrated within the relatively low-frequency band. The energy distribution of ELC180 is mainly concentrated within 1.06-2.31 Hz, it shows that the frequency distribution of common ground motions is concentrated within the relatively high-frequency band. With reference to a comparative analysis of Fig. 3 and Fig. 4, the following conclusions can be drawn: There is no essential difference between the Power spectral density amplitude and Fourier amplitude spectrum, and both of them are the energy distribution performance of earthquake records in the frequency domain. Power spectral density amplitude and Fourier amplitude spectrum are the physical quantity of earthquake records themselves, and they have no interrelation with the response on a structure under earthquake excitation.
Fig. 3Fourier amplitude spectrum: a) TCU052-NS; b) YMN010-NS; c) ELC180
a)
b)
c)
Fig. 4Power spectral density amplitude: a) TCU052-NS; b) YMN010-NS; c) ELC180
a)
b)
c)
3.1.3. Duration of earthquake records
Complete duration of earthquake records usually includes three segments of start, strong and end duration. In the research of earthquake engineering, the start and end duration segments with small amplitude are usually ignored, while a part of so-called strong-shock duration is mainly studied. Strong-shock duration plays an important role in a structural response and mainly performs in the energy dissipation and accumulation of a nonlinear structural system. The longer strong-shock duration of earthquake records is bound to require higher cumulative energy consumption of the structural system. In this paper, strong-shock duration is defined from the viewpoint of energy, and strong-shock duration of 90 % record duration is calculated as follows:
where is the acceleration time-history of earthquake records; is the total duration of earthquake records; is a function whose value is 0-1; 0.95. 0.05, 0.95.
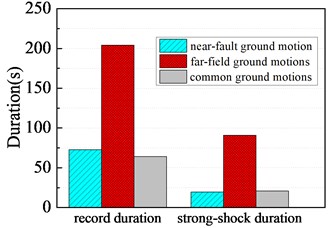
The strong-shock duration corresponding to the record duration of earthquake records is calculated based on the above Eqs. (1) and (2). Fig. 5 shows the record duration and strong-shock duration under three types of ground motions. With reference to Fig. 5, the following conclusions can be drawn: The record duration and strong-shock duration under far-field ground motions are significantly greater than those under common ground motions, while the record duration and strong-shock duration under near-fault ground motions are almost the same as those under common ground motions. Combined with the above conclusion, the strong-shock duration under near-fault ground motions is relatively short, and the acceleration time-history under near-fault ground motions reaches a very high value in a short time, and then it decreases rapidly. While the strong-shock duration under far-field ground motions is relatively flat, and the acceleration time-history under far-field ground motions rises and falls more slowly. It suggests that the energy release process under near-fault ground motions is relatively concentrated in a short time while the energy release process under far-field ground motions is relatively mild.
Fig. 5Record duration and strong-shock duration
3.2. Strength parameter of long-period earthquake records
3.2.1. Strength parameter index
In this paper, five typical strength parameters are selected for a further study on characteristics of long-period ground motions. Index is the strength parameter of earthquake records related to the total hysteretic energy dissipation per unit mass on the structure. Index is the strength parameter of earthquake records expressed by energy density. Index is the strength parameter of earthquake records measured by the average total input energy per unit mass on the structure in the time domain. Index is the strength parameter of earthquake records describing the relationship between the earthquake intensity and structure damage. Index is the strength parameter of earthquake records integrating the absolute value of acceleration time-history. The specific calculation formula of each strength parameter index of earthquake records can be found in the literature [26-30].
3.2.2. Strength parameter characteristic
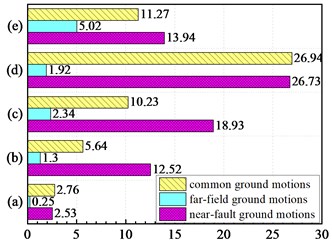
Fig. 6 shows the strength parameter indexes , , , and under three types of ground motions. With reference to Fig. 6, the following conclusions can be drawn: The strength parameter indexes and under near-fault ground motions are almost the same as those under common ground motions, and the strength parameter indexes , and under near-fault ground motions are greater than those under common ground motions. While the strength parameter indexes , , , and under far-field ground motions are less than those under common ground motions, and even the strength parameter indexes and under far-field ground motions are far less than those under common ground motions. The strength parameter indexes , , , and under near-fault ground motions are greater than those under far-field ground motions, and the strength parameter indexes and reach 13.9 and 2.8 times of those under far-field ground motions.
Fig. 6Strength parameters of ground motions: a) IA (m/s); b) Eρ (×103 cm2/s); c) P (×103 cm2/s3); d) IC (×102); e) CAV (×102 cm/s)
4. Influencing factors of strength parameter under near-fault ground motions
4.1. Strength parameter affected by earthquake magnitude under near-fault ground motions
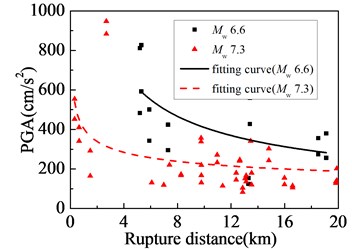
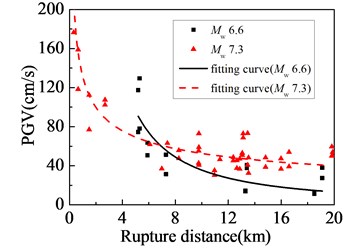
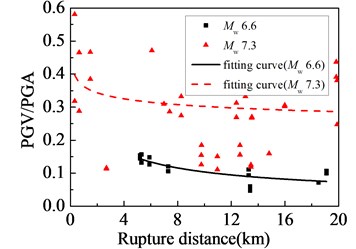
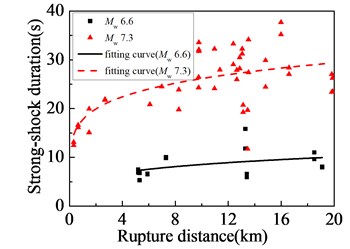
Earthquake magnitude is the main producing cause of long-period components of ground motions. Near-fault pulse-like ground motions with velocity pulses are formed in a near fault, while far-field harmonic ground motions mainly in low-frequency components are formed in a far field. In order to study the effect on characteristics affected by the earthquake magnitude under near-fault ground motions, taking earthquake records in site class C under near-fault ground motions as an example, the selected earthquake records are classified as 6.6 and 7.3.
Fig. 7(a), (b), (c) and (d) show the effect on PGA, PGV, PGV/PGA indexes and strong-shock duration affected by earthquake magnitude under near-fault ground motions, respectively. With reference to Fig. 7, the following conclusions can be drawn: For near-fault ground motions, the peak of ground acceleration (PGA) decreases with the earthquake magnitude from 6.6 to 7.3, and it is concluded that this change is related to the increase of strong-shock duration under strong earthquake. The change trend of ground velocity peak PGV is not obvious with the increase of earthquake magnitude. When the earthquake magnitude of near-fault ground motions is 6.6, the peak-ratio (PGV/PGA) is less than 0.2. While the earthquake magnitude of near-fault ground motions increases to 7.3, the peak-ratio of PGV/PGA is beyond 0.2. Combined with the theory that the PGV/PGA peak-ratio under long-period ground motions is generally beyond 0.2, it shows that the long-period components under near-fault ground motions are more obvious with the increase of earthquake magnitude. The strong-shock duration under near-fault ground motions increases to about 30s from 8s with the earthquake magnitude from 6.6 to 7.3, and it shows that the strong-shock duration under near-fault ground motions demonstrates an increasing trend with the increase of the earthquake magnitude.
4.2. Strength parameter affected by rupture distance under near-fault ground motions
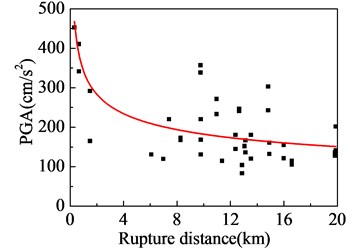
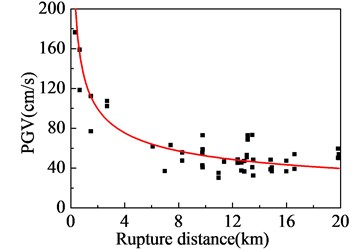
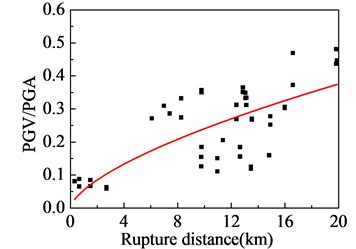
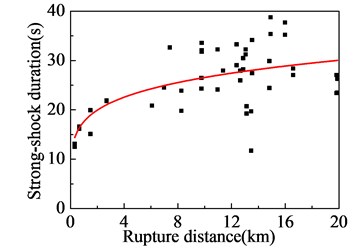
In this paper, near-fault pulse-like ground motions are referred to the ground motions where the rupture distance is less than 20 km. In order to study the effect on characteristics affected by the rupture distance under near-fault ground motions, taking earthquake records in 7.3 and site class C under near-fault ground motions as an example, the influencing rule of PGA, PGV, PGV/PGA indexes and strong-shock duration with the change of rupture distance is analyzed, respectively.
Fig. 7Near-fault ground motions affected by earthquake magnitude: a) PGA; b) PGV; c) PGV/PGA; d) strong-shock duration
a)
b)
c)
d)
Fig. 8Near-fault ground motions affected by rupture distance: a) PGA; b) PGV; c) PGV/PGA; d) strong-shock duration
a)
b)
c)
d)
Fig. 8(a), (b), (c) and (d) show the effect on PGA, PGV, PGV/PGA indexes and strong-shock duration affected by the rupture distance under near-fault ground motions, respectively. With reference to Fig. 8, the following conclusions can be drawn: For near-fault ground motions, the peak of ground acceleration (PGA) and peak of ground velocity (PGV) decrease, while the peak-ratio of PGV/PGA increases with the increase of rupture distance. It also indirectly reflects the slower attenuation of PGV with the increase of rupture distance. The strong-shock duration under near-fault ground motions demonstrates an increasing trend with the increase of the rupture distance.
4.3. Strength parameter affected by site class under near-fault ground motions
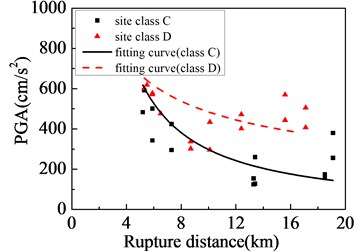
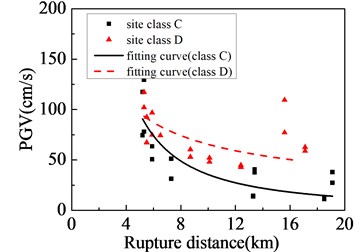
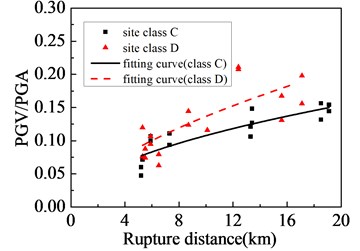
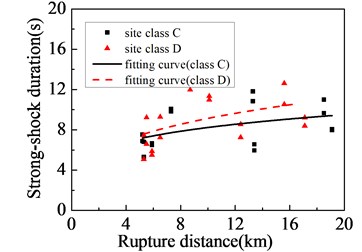
The characteristic of earthquake records is strongly dependent on the rupture process of seismic fault under near-fault ground motions since it is very close to the fault while the influence on characteristic affected by a site condition under near-fault ground motions is relatively small. In order to study the effect on characteristic affected by site class under near-fault ground motions, taking earthquake records in 6.6 under near-fault ground motions as an example, the selected earthquake records are classified as site classes C and D.
Fig. 9Near-fault ground motions affected by site class: a) PGA; b) PGV; c) PGV/PGA; d) strong-shock duration
a)
b)
c)
d)
Fig. 9(a), (b), (c) and (d) show the effect on PGA, PGV, PGV/PGA indexes and strong-shock duration affected by the site class under near-fault ground motions, respectively. With reference to Fig. 9, the following conclusions can be drawn: In the same rupture distance under near-fault ground motions, the peak of ground acceleration (PGA), peak of ground velocity (PGV), peak-ratio of PGV/PGA and strong-shock duration increase with the site soil from class C to D (that is, the site soil from hard bedrock to soft soil). Increased amplitude of strength parameter is different in the site soil with hard bedrock or soft soil under near-fault ground motions. Among them, the peak of ground acceleration (PGA) is obviously increased, while the increased amplitude of strong-shock duration is the smallest. The reason is that the source mechanism and fault type under near-fault ground motions are complicated due to its smaller distance from a fault fracture surface. So it is difficult to strictly determine the influencing rule on strength parameter affected by site soil condition under near-fault ground motion.
5. Influencing factors of strength parameter under far-field ground motions
5.1. Strength parameter affected by earthquake magnitude under far-field ground motions
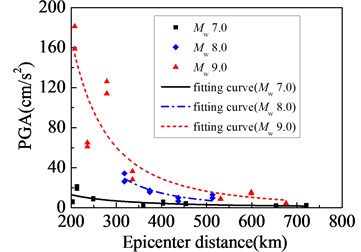
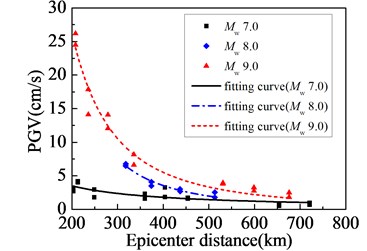
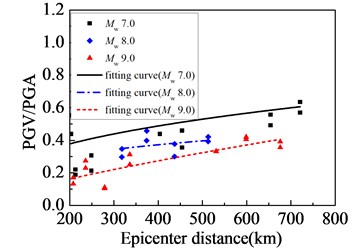
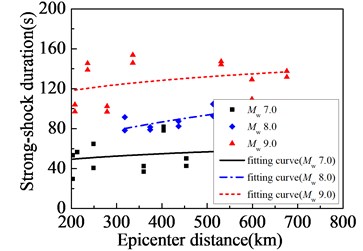
In order to study the effect on characteristics affected by the earthquake magnitude under far-field ground motions, taking earthquake records in the site class D under far-field ground motions as an example, the selected earthquake records are classified as 7.0, 8.0 and 9.0.
Fig. 10(a), (b), (c) and (d) show the effect on PGA, PGV, PGV/PGA indexes and strong-shock duration affected by the earthquake magnitude under far-field ground motions, respectively. With reference to Fig. 10, the following conclusions can be drawn: For far-field ground motions, the peak of ground acceleration (PGA) and the peak of ground velocity (PGV) increase with the increase of earthquake magnitude. When the earthquake magnitudes under far-field ground motions are 7.0, 8.0 and 9.0, the peak-ratio of PGV/PGA is beyond 0.2, and the peak-ratio of PGV/PGA tends to decrease with the increase of earthquake magnitude. When the earthquake magnitude under far-field ground motions increases to 8.0 and 9.0 from 7.0, the strong-shock duration increases to about 80 s and 120 s from 40 s. And this is sufficient to explain the fact that earthquake magnitude is the key factor affecting the strong-shock duration under far-field ground motions.
Fig. 10Far-field ground motions affected by earthquake magnitude: a) PGA; b) PGV; c) PGV/PGA; d) strong-shock duration
a)
b)
c)
d)
5.2. Strength parameter affected by epicenter distance under far-field ground motions
In this paper, far-field harmonic ground motions are referred as to the ground motions where the epicentral distance is beyond 200 km. In order to study the effect on characteristics affected by the epicentral distance under far-field ground motions, taking earthquake records in 7.0 and site class D under far-field ground motions as an example, the influencing rule of PGA, PGV, PGV/PGA indexes and strong-shock duration with the change of epicentral distance is analyzed, respectively.
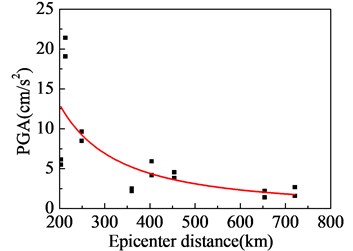
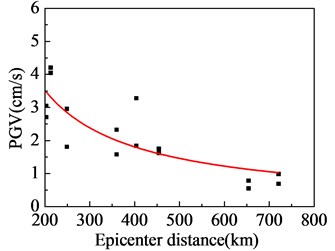
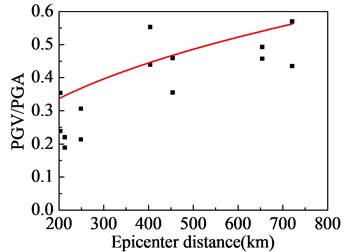
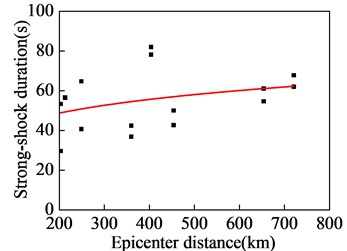
Fig. 11(a), (b), (c) and (d) show the effect on PGA, PGV, PGV/PGA indexes and strong-shock duration affected by the epicentral distance under far-field ground motions, respectively. With reference to Fig. 11, the following conclusions can be drawn: For far-field ground motions, the peak of ground acceleration (PGA) and peak of ground velocity (PGV) decrease, while the peak-ratio of PGV/PGA gradually increase with the increase of epicenter distance. It shows that the descending slope of the peak of ground acceleration (PGA) is larger than PGV. The strong-shock duration under far-field ground motions also shows an increasing trend with the increase of epicenter distance.
Fig. 11Far-field ground motions affected by epicenter distance: a) PGA; b) PGV; c) PGV/PGA; d) strong-shock duration
a)
b)
c)
d)
5.3. Strength parameter affected by site class under far-field ground motions
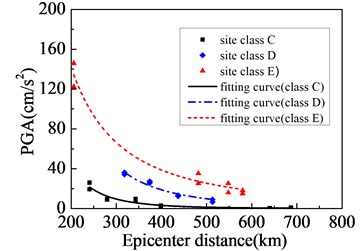
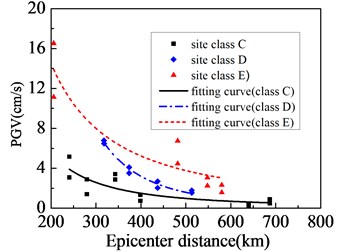
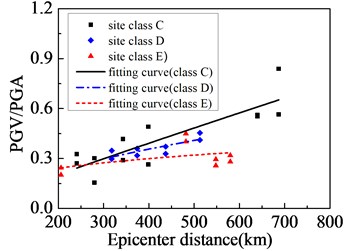
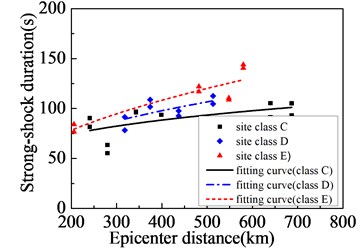
The peak of acceleration (PGA) on a soft-soil site is larger than that on a bedrock site under far-field harmonic ground motions, and it is mainly related to the filter effect (i.e. low-frequency amplification and high-frequency attenuation) of the soft-soil site. So, the site condition is suggested to be taken as the main factor influencing the characteristic of earthquake records under far-field ground motions. In order to study the effect on characteristics affected by site class under far-field ground motions, taking earthquake records in 8.0 under far-field ground motions as an example, the selected earthquake records are classified as the site classes C, D and E.
Fig. 12(a), (b), (c) and (d) show the effect on PGA, PGV, PGV/PGA indexes and strong-shock duration affected by the site class under far-field ground motions, respectively. With reference to Fig. 12, the following conclusions can be drawn:
(1) In the same epicenter distance under far-field ground motions, the peak of ground acceleration (PGA) and peak of ground velocity (PGV) increase with the site soil condition from class C to D and E (that is, the site soil from hard bedrock to soft soil). And it is suggested to be related to the effect of filtering out high-frequency components and amplifying low-frequency components in soft site soil. (2) When the site condition under far-field ground motions is in classes C, D and E, the peak-ratio of PGV/PGA is beyond 0.2, and the peak-ratio of PGV/PGA tends to increase with the increase of epicenter distance. As it can be seen from Fig. 12(c), the slope of PGV/PGA is different in various site conditions under far-field ground motions, and the softer the site soil condition is, the more slowly the peak-ratio PGV/PGA increases with the increase of epicenter distance. (3) In the same epicenter distance under far-field ground motions, the strong-shock duration increases with the site soil condition from class C to D and E (that is, the site soil from hard bedrock to soft soil). As it can be seen from Fig. 12(d), the slope of strong-shock duration is different in a various site condition under far-field ground motions, and the softer the site soil condition is, the faster the strong-shock duration increases with the increase of epicenter distance. And it is suggested to be related to the amplification effect of soft site soil. (4) When the epicentral distance under far-field ground motions is less than 250 km and beyond 650 km, the changing trend of PGA, PGV, PGV/PGA strength parameter indexes and strong-shock duration are not obvious with the change of site soil condition. This is because the strength parameter indexes of earthquake records are related either to the site soil condition of station or to the complex medium characteristic from a seismic source to the engineering site, the propagation path of seismic wave and so on.
Fig. 12Far-field ground motions affected by site class: a) PGA; b) PGV; c) PGV/PGA; d) strong-shock duration
a)
b)
c)
d)
6. Conclusions
In this paper, 189 long-period ground motion records and 10 common ground motion records with reliable information are selected from the PEER and NIED firstly. The US NEHRP classification criteria are adopted to calculate and classify the site condition of earthquake records, and the Seismo Signal software is applied to correct the baseline of original earthquake records. Then the basic characteristic and strength parameter of earthquake records under long-period ground motions and common ground motions are compared and analyzed. Moreover, the influences on basic strength parameters affected by the earthquake magnitude, rupture distance/epicenter distance and site condition under near-fault/far-field long-period ground motions are analyzed one by one. The study results are obtained as follows:
1) Near-fault ground motion has high amplitude intensity and short strong-shock duration, and its energy release process is concentrated in a short time. Far-field ground motion has a small peak of acceleration, velocity and displacement and long strong-shock duration, and its energy release process is mild. The strength parameter index under two types of long-period ground motions is beyond 0.2, and its frequency distribution is concentrated within the low-frequency band (0.1-1.0 Hz) while the indexes under common ground motions are less than 0.2, and their frequency distribution is concentrated within a relatively high-frequency band (1.0-2.3 Hz). The effect on vertical acceleration under near-fault ground motions is more obvious than that under far field ground motions, so its vertical seismic effect on the structure would be greater under near-fault ground motions.
2) The strength parameter indexes , , , and under near-fault ground motions are greater than those under far-field ground motions. Among them, the indexes and under near-fault ground motions are almost the same as those under common ground motions, and the indexes , and under near-fault ground motions are greater than those under common ground motions. While the indexes , , , and under far-field ground motions are less than those under common ground motions, and even the indexes and under far-field ground motions are far less than those under common ground motions.
3) For near-fault ground motions, the strength parameter index (PGA) decreases and the strong-shock duration increases with the earthquake magnitude from 6.6 to 7.3, while the PGA, PGV indexes decrease, and the PGV/PGA index, strong-shock duration increase with the increase of rupture distance. In the same rupture distance under near-fault ground motions, the PGA, PGV, PGV/PGA indexes and strong-shock duration increase with the site soil from class C to D. Yet increased amplitude of strength parameter indexes is different with the site soil from hard bedrock to soft soil under near-fault ground motions.
4) For far-field ground motions, the PGA, PGV strength parameter indexes increase, PGV/PGA decreases and strong-shock duration increases to about 80 s and 120 s from 40 s with the earthquake magnitude from 7.0 to 8.0 and 9.0. While the PGA, PGV indexes decrease, and the PGV/PGA index, strong-shock duration increases with the increase of epicenter distance. The index PGA, PGV under far-field ground motions increase with the site soil from class C to D and E, and it is suggested to be related to the effect of filtering out high-frequency components and amplifying low-frequency components in soft site soil. The PGV/PGA index and strong-shock duration increase with the increase of epicenter distance, and the PGV/PGA peak-ratio is beyond 0.2 whether it is located in the site of class C, D or E. The changing trend of PGA, PGV, PGV/PGA strength parameter indexes and strong-shock duration is not obvious with the change of site soil condition when the epicentral distance is less than 250 km and beyond 650 km under far-field ground motions.
References
-
Yang D., Pan J., Li G. Non-structure-specific intensity measure parameters and characteristic period of near-fault ground motions. Earthquake Engineering and Structural Dynamics, Vol. 38, Issue 11, 2010, p. 1257-1280.
-
Chun Feng L.-I., Yang Z., Zhao J. B., et al. Long-period ground motion characteristic of the 1999 Jiji (Chi-Chi), Taiwan, mainshock and aftershocks. Earthquake Science, Vol. 19, Issue 4, 2006, p. 448-460.
-
Yang W. L., Zhu S. C., Hong H. C., et al. Characteristics of Far-Field Ground Motion of Wenchuan Earthquake and the Effect on Long-Periodic Structures. Journal of Disaster Prevention and Mitigation Engineering, Vol. 29, Issue 4, 2009, p. 473-478.
-
Takewaki I., Fujita K., Yoshitomi S. Uncertainties in long-period ground motion and its impact on building structural design: Case study of the 2011 Tohoku (Japan) earthquake. Engineering Structures, Vol. 49, Issue 2, 2013, p. 119-134.
-
Furumura T. Destructive near-fault strong ground motion from the 2016 Kumamoto prefecture, Japan, M7.3 earthquake. Landslides, Vol. 13, Issue 6, 2016, p. 1519-1524.
-
Ucak A., Mavroeidis G. P., Tsopelas P. Behavior of a seismically isolated bridge crossing a fault rupture zone. Soil Dynamics and Earthquake Engineering, Vol. 27, 2014, p. 164-178.
-
Zhao W. S., Chen W. Z. Effect of near-fault ground motions with long-period pulses on the tunnel. Journal of Vibroengineering, Vol. 17, Issue 2, 2015, p. 841-858.
-
Zhang S., Wang G. Effects of near-fault and far-fault ground motions on nonlinear dynamic response and seismic damage of concrete gravity dams. Soil Dynamics and Earthquake Engineering, Vol. 53, Issue 5, 2013, p. 217-229.
-
Takewaki I., Murakami S., Fujita K., et al. The 2011 off the Pacific coast of Tohoku earthquake and response of high-rise buildings under long-period ground motions. Soil Dynamics and Earthquake Engineering, Vol. 31, Issue 11, 2011, p. 1511-1528.
-
Xu Longjun, Hu Jinjun, Xie Lili On characteristics of ground motion parameters for special long-period ground motion. Journal of Earthquake Engineering and Engineering Vibration, Vol. 6, Issue 6, 2008, p. 20-27.
-
Shahi S. K., Baker J. W. An empirically calibrated framework for including the effects of near-fault directivity in probabilistic seismic hazard analysis. Bulletin of the Seismological Society of America, Vol. 101, Issue 2, 2011, p. 742-755.
-
Tahghighi H. Earthquake fault-induced surface rupture-A hybrid strong ground motion simulation technique and discussion for structural design. Earthquake Engineering and Structural Dynamics, Vol. 40, Issue 14, 2011, p. 1591-1608.
-
Vaez S. R. Hoseini, et al. Dominant pulse simulation of near fault ground motions. Earthquake Engineering and Engineering Vibration, Vol. 12, Issue 2, 2013, p. 267-278.
-
Mukhopadhyay S., Gupta V. K. Directivity pulses in near-fault ground motions – I. Identification, extraction and modeling. Soil Dynamics and Earthquake Engineering, Vol. 50, Issue 6, 2013, p. 1-15.
-
Wenkai H. U. Response characteristic analysis of soil site with deep deposit under different bedrock seismic waves. Structural Engineers, Vol. 26, Issue 5, 2010, p. 85-90.
-
Boore D. M. Long-period ground motions from digital acceleration recordings: a new era in engineering seismology. Directions in Strong Motion Instrumentation, Vol. 58, 2005, p. 41-54.
-
Ariga T., Kanno Y., Takewaki I. Resonant behaviour of base‐isolated high‐rise buildings under long-period ground motions. Structural Design of Tall and Special Buildings, Vol. 15, Issue 3, 2010, p. 325-338.
-
Milana G., Rovelli A., De Sortis A., et al. The Role of Long-Period Ground Motions on Magnitude and Damage of Volcanic Earthquakes on Mt. Etna, Italy. Bulletin of the Seismological Society of America, Vol. 98, Issue 6, 2008, p. 2724-2738.
-
Joyner W. B., Boore D. M. Peak horizontal acceleration and velocity from strong motion records including records from the 1979 Imperial Valley, California, earthquake. Bulletin of the Seismological Society of America, Vol. 71, Issue 6, 1981, p. 2011-2038.
-
Rodriguez Marek A., Bray J. D. Seismic site response for near-fault forward directivity ground motions. Journal of Geotechnical and Geoenvironmental Engineering, Vol. 132, Issue 12, 2006, p. 1611-1620.
-
Tso W. K., Zhu T. J., Heidebrecht A. C. Engineering implication of ground motion A/V ratio. Soil Dynamics and Earthquake Engineering, Vol. 11, Issue 3, 1992, p. 133-144.
-
Fajfar P., Vidic T. Consistent inelastic design spectra: hysteretic and input energy. Earthquake Engineering and Structural Dynamics, Vol. 23, Issue 5, 1994, p. 523-537.
-
Loh C. H., Wan S., Liao W. I. Effects of hysteretic model on seismic demands consideration of near-fault ground motions. The Structural Design of Tall Buildings, Vol. 11, Issue 3, 2002, p. 155-169.
-
Akkar S., Bommer J. J. Empirical prediction equations for peak ground velocity derived from strong-motion records from Europe and the Middle East. Bulletin of the Seismological Society of America, Vol. 97, Issue 2, 2007, p. 511-530.
-
Kaul M. K. Stochastic characterization of earthquakes through their response spectrum. Earthquake Engineering and Structural Dynamics, Vol. 6, Issue 5, 1978, p. 497-507.
-
Arias A. Measure of Earthquake Intensity. Massachusetts Institute of Technology, Cambridge, Univiversity of Chile, Santiago de Chile, 1970.
-
Liao W. I., Loh C. H., Wan S. Earthquake responses of RC moment frames subjected to near-fault ground motions. The Structural Design of Tall Buildings, Vol. 10, Issue 3, 2001, p. 219-229.
-
Housner G. W. Measures of severity of earthquake ground shaking. Proceedings, US National Conference on Earthquake Engineering, 1975.
-
Park Y. J., Ang A. H. S., Wen Y. K. Seismic damage analysis of reinforced concrete buildings. Journal of Structural Engineering, Vol. 111, Issue 4, 1985, p. 740-757.
-
Kramer S. L. Geotechnical Earthquake Engineering. Prentice-Hall, U.S, 1996.
Cited by
About this article
The present work was supported by the National Natural Science Foundation of China (No. 51478381) and the Innovation Team in Xi’an University of Architecture and Technology, China. These supports are greatly appreciated.
