Abstract
Probabilistic seismic hazard analysis is an important scientific basis for building seismic fortification. Unlike most seismic hazard analyses starting from the perspective of magnitude, this paper presents a seismic hazard analysis method based on the monthly maximum peak ground acceleration (PGA) distribution. In this paper, cities of Chongqing, Chengdu, and Kunming in southwest China are taken as examples where historical earthquake events from 1920 to 2020 with surface wave magnitude (Ms) greater than or equal to 3 and epicentral distances within 400 km are selected for analysis. PGA data are back-calculated from Ms data recorded in the earthquake catalog using the attenuation relation of seismic parameters. By considering the monthly maximum PGA values of the three cities as statistical samples, regression analysis is performed to obtain the monthly maximum PGA distribution and the frequency-PGA relation respectively. Based on the Poisson model and the parameters obtained from the regression analysis, then seismic hazard analysis is conducted to derive year exceedance probability vs. PGA curves and recurrence interval vs. PGA curves. Finally, earthquake events with the epicentral distance within 200 km, 300 km, and 400 km are respectively analyzed to discuss the influence of the epicentral distance on results of seismic hazard analysis.
1. Introduction
Probabilistic seismic hazard analysis (PSHA) is the foundation of seismic fortification in civil engineering. In China, PSHA is usually conducted by combining seismic magnitude and intensity data to analyze the temporal and spatial characteristics of earthquakes [1-3], and to obtain Seismic Intensity Zoning Map for engineering seismic fortification calculations. Usually ground motion parameters and peak ground acceleration (PGA) are necessary. Different from the method based on magnitude data, when the PGA distribution and frequency are determined, the annual exceedance probability and recurrence interval corresponding to any PGA can be calculated based on Poisson model [4], [5]. It is worth discussing whether there are any differences between the results based on perspective of PGA and magnitude when conducting seismic hazard analysis.
2. Methodology
Probabilistic seismic hazard analysis in this paper is based on monthly maximum PGA. PGA data are back-calculated from data recorded in the earthquake catalog using the attenuation relation of seismic parameters. PGA distribution and the frequency-PGA relation are conducted respectively by regression analysis. Based on the Poisson model and the parameters obtained from the regression analysis, year exceedance probability vs. PGA curves and recurrence interval vs. PGA curves are derived. The technical route is shown in the Fig. 1.
2.1. Historical earthquake events
The data of historical earthquake events are recorded in historical earthquake catalog as surface wave magnitude () of 3 cities in southwest China, i.e., Chongqing, Chengdu, and Kunming. Historical earthquake events from 1920 to 2020 with greater than or equal to 3 and epicentral distances within 400 km are selected for analysis. The temporal and spatial distribution of earthquake events are shown in Fig. 2 and 3 respectively.
Fig. 1Technical route of probabilistic seismic hazard analysis based on PGA
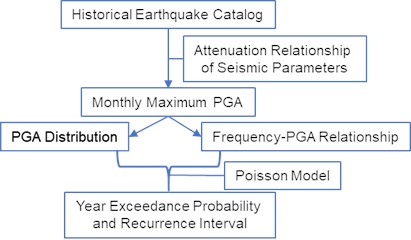
Fig. 2Temporal distribution of earthquake events from 1920 to 2020
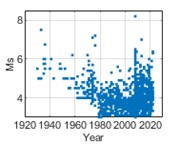
a) Chongqing
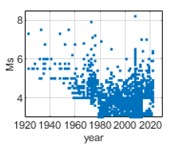
b) Chengdu
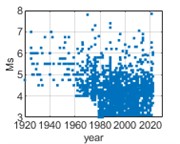
c) Kunming
Fig. 3Spatial distribution of earthquake events with epicentral distances within 400 km
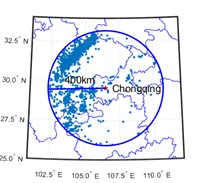
a) Chongqing
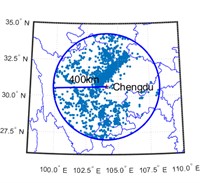
b) Chengdu
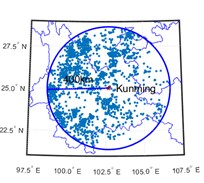
c) Kunming
2.2. Attenuation relation of seismic parameters
PGA data can be back-calculated from data recorded in the earthquake catalog using the attenuation relation of seismic parameters. Generally, it is believed that the relations between seismic motion parameters and magnitude satisfies following function [5]:
where, denotes regression parameter, denotes random error, denotes epicentral distance, denotes magnitude of earthquakes. In this paper, PGA data is calculated based on the attenuation relation proposed by Tatsuo [6]:
where, , , , , denotes regression parameters. The empirical formula proposed by Wason [7] can be used for conversion between and :
2.3. Monthly maximum PGA distribution
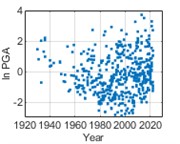
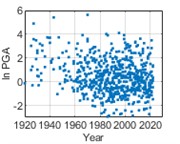
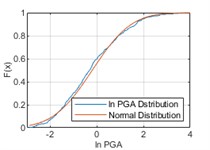
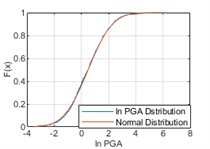
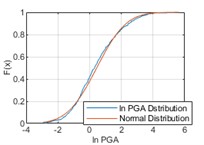
In order to fit the better model of PGA distribution, logarithmic calculation for PGA ( PGA) is taken. PGA distribution is studied using an equal time step method with a time step of 1 month, i.e., monthly maximum PGA values are statistically analyzed. The temporal distribution of the monthly maximum PGA values of historical earthquake events from 1920 to 2020 is shown in Fig. 4. In Fig. 5, it can be considered that ln PGAs at the three cities satisfy with normal distributions respectively.
Fig. 4Temporal distribution of monthly maximum ln PGAs
a) Chongqing

b) Chengdu
c) Kunming
Fig. 5Comparisons between ln PGA distribution and normal distribution
a) Chongqing
b) Chengdu
c) Kunming
Then, the Kolmogorov Smirnov test (K-S test) on the fitting results is performed. The K-S test can be used to test whether a set of random numbers with an unknown distribution comes from a specific continuous distribution function , and KS-statistic is:
where, denotes the th quantile data in the sample, and denotes the sample size [8]. Under the condition of a significant level 0.05, all the sample data of three cities satisfy with normal distribution.
2.4. Frequency-PGA relation
Generally, there is an empirical formula [9] for the relation between the number of earthquakes () and the magnitude ():
Similarly, it can be seen that the relation between and PGA satisfies a linear relation in Fig. 6, namely:
where, , denote regression parameters. And the rationality of the regression results of -PGA relations can be tested by coefficient of determination (), which reflects the percentage of the fluctuation of the dependent variable that can be described by the independent variable [10]:
where, SSR and SSE denote sum of squares for regression and sum of squares for error, respectively. The fitting results for all three cities have 0 1 and are close to 1, demonstrating good regression results.
Fig. 6ln(lnN)-PGA relations
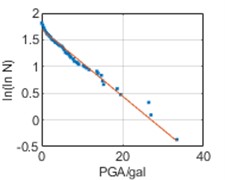
a) Chongqing
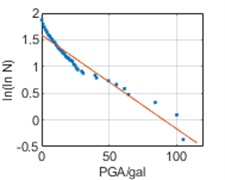
b) Chengdu
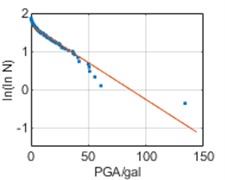
c) Kunming
After getting in regression, the frequency () within time can be obtained:
where, can be or , respectively denote the calculated result of corresponding to PGA = 0 or PGA = . denotes the mean value in PGA Normal Distribution, which is also the mode of PGA.
2.5. Poisson model
It is generally believed that the probability of earthquakes occurring within time () satisfies the Poisson model [2]:
where, denotes average frequency within . And average frequency () of PGA can be calculated from Eq. (11):
where and can be calculated from the results of PGA distributions and frequency-PGA relation, respectively. Probability of seismic event PGA occurring within , that is, the exceedance probability for each given PGA (), can be calculated from Eq. (12):
And recurrence interval () can be calculated from Eq. (13) [3]:
2.6. Year exceedance probability and recurrence interval
The parameters calculated from regression are shown in Table 1. The annual exceedance probability v.s. PGA curves and recurrence interval v.s. PGA curves of the three cities can be obtained by these parameters and Eqs. (12) and (13). The PGA corresponding to the annual exceedance probability Pr of 0.0021 (i.e. 475 y of recurrence interval ) of Chongqing, Chengdu and Kunming are 48.08 gal, 103.0 gal and 116.0 gal respectively.
Compared with the values of SIZM (in Table 2), the calculation results of Chongqing and Chengdu are close to those of the Seismic Zoning Map, while the calculation results of Kunming are relatively small. This may be due to the too large epicentral distance threshold selected, leading to the excessive consideration of the proportion of small earthquakes in the surrounding area. The influence of the epicentral distance threshold will be discussed in the following text. Meanwhile, the results calculated using are slightly greater than the results calculated by , and the results calculated using are closer to the results of SIZM of China.
Table 1Parameters calculated from regression
City | PGA | Month frequency | Year frequency | |||
Mean | Standard deviation | |||||
Chongqing | –0.3942 | 1.3901 | 0.1637 | 0.1330 | 1.9644 | 1.5960 |
Chengdu | 0.4999 | 1.4038 | 0.1112 | 0.0967 | 1.3344 | 1.1604 |
Kunming | 0.4470 | 1.4612 | 0.1338 | 0.1161 | 1.6052 | 1.3928 |
Table 2PGAs corresponding to recurrence intervals compared with values of SIZM
City | 475 y of T | 475 y of T of SIZM | 1200 y of T | 1200 y of T of SIZM |
Chongqing | 48.08 gal | 50 gal | 69.09 gal | 95 gal |
Chengdu | 103.0 gal | 100 gal | 151.5 gal | 190 gal |
Kunming | 116.0 gal | 200 gal | 170.9 gal | 380 gal |
3. Discussion
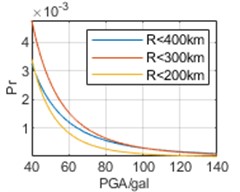
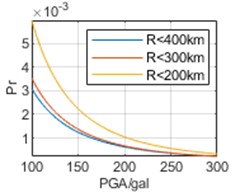
To analyze the impact of selection of epicentral distance thresholds on regression results, earthquake data are respectively analyzed within 400 km, 300 km, and 200 km of the three cities. The parameters obtained through regression and the calculated are shown in Table 3 and Fig. 7, respectively.
In Fig. 7, it can be seen that the selection of epicentral distance thresholds has different impacts on regression results in the interval of our concern of different cities. For Chongqing, the impact of epicentral distance thresholds is not significant, and the results obtained from the three epicentral distance thresholds are relatively close. For Chengdu, the impact of different epicentral distance thresholds is more significant. And the smaller epicenter distance threshold selected, the smaller the overall corresponding to each PGA. For Kunming, the impact of different epicentral distance thresholds is most significant. Contrary to the calculated results of Chengdu, the smaller the epicenter distance threshold selected, the higher the overall . Especially, the results based on epicentral distance 200 km are much greater than the other two results. Meanwhile, whether it is the calculation results of or , there is no significant difference in the above characteristics, and overall, the calculation results of are still slightly larger than the calculation results of .
Table 3Parameters based on different epicentral distance thresholds
City | PGA | Month frequency | Year frequency | |||
Mean | Standard deviation | |||||
Chongqing, 400 | –0.3942 | 1.3901 | 0.1637 | 0.1330 | 1.9644 | 1.5960 |
Chengdu, 400 | 0.4999 | 1.4038 | 0.1112 | 0.0967 | 1.3344 | 1.1604 |
Kunming, 400 | 0.4470 | 1.4612 | 0.1338 | 0.1161 | 1.6052 | 1.3928 |
Chongqing, 300 | 0.4253 | 1.1725 | 0.1475 | 0.0922 | 1.7694 | 1.1061 |
Chengdu, 300 | 0.8076 | 1.2870 | 0.0944 | 0.0795 | 1.1334 | 0.9538 |
Kunming, 300 | 0.8020 | 1.3725 | 0.1285 | 0.1054 | 1.5415 | 1.2646 |
Chongqing, 200 | 1.0534 | 0.9494 | 0.1029 | 0.0480 | 1.2350 | 0.5759 |
Chengdu, 200 | 1.3526 | 1.1250 | 0.0723 | 0.0555 | 0.8682 | 0.6659 |
Kunming, 200 | 1.5918 | 1.2180 | 0.1118 | 0.0746 | 1.3414 | 0.8947 |
Fig. 7Annual exceedance probability based on different epicentral distance thresholds
a) Chongqing,
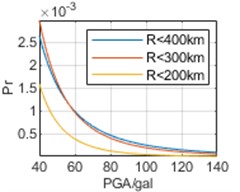
b) Chongqing,
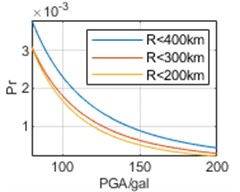
c) Chengdu,
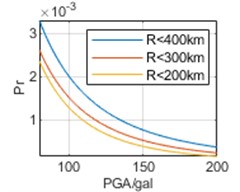
d) Chengdu,
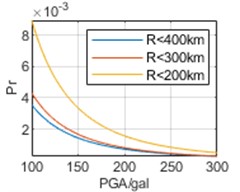
e) Kunming,
f) Kunming,
4. Conclusions
In this paper, seismic hazard analysis is presented based on monthly maximum PGA distribution in three cities (Chongqing, Chengdu, and Kunming) in southwest China. By statistical analysis, (PGAs) of three cities are found to satisfy a normal distribution and -PGA relation satisfy a linear distribution. Based on the parameters obtained from ln PGA distributions and -PGA relations in three cities, annual exceedance probability v.s. PGA and recurrence interval v.s. PGA are derived, respectively. The PGA corresponding to the annual exceedance probability of 0.0021 (i.e. 475 years of recurrence interval) of Chongqing, Chengdu and Kunming are 48.08 gal, 103.0 gal and 116.0 gal respectively. Impacts of selection of different epicentral distance thresholds are found different on different cities, in which it is not significant in Chongqing but most significant in Kunming.
References
-
Xiong Xiong et al., “History, present situation and challenge of probabilistic,” Geodesy and Geodynamic, Vol. 4, pp. 331–338, 2023.
-
Pan Yue-Yi, Yu Yan-Xiang, and Xiao Liang, “Statistical tests of seismic intensity ratings in China,” Chinese Journal of Geophysics, Vol. 60, No. 2, pp. 593–603, 2017, https://doi.org/10.6038/cjg20170214
-
Y.-X. Hu, S.-C. Liu, and W. Dong, Earthquake Engineering. CRC Press, 1996, https://doi.org/10.1201/9781482271645
-
C. A. Cornell, “Engineering seismic risk analysis,” Bulletin of the Seismological Society of America, Vol. 58, No. 5, pp. 1583–1606, Oct. 1968, https://doi.org/10.1785/bssa0580051583
-
J.-P. Wang, S.-C. Chang, Y.-M. Wu, and Y. Xu, “PGA distributions and seismic hazard evaluations in three cities in Taiwan,” Natural Hazards, Vol. 64, No. 2, pp. 1373–1390, Nov. 2012, https://doi.org/10.1007/s11069-012-0298-y
-
S. L. Kramer, Geotechnical Earthquake Engineering. New Jersey: Prentice Hall, 1996.
-
T. Kanno, “A new attenuation relation for strong ground motion in japan based on recorded data,” Bulletin of the Seismological Society of America, Vol. 96, No. 3, pp. 879–897, Jun. 2006, https://doi.org/10.1785/0120050138
-
R. Das, H. R. Wason, and M. L. Sharma, “Global regression relations for conversion of surface wave and body wave magnitudes to moment magnitude,” Natural Hazards, Vol. 59, No. 2, pp. 801–810, Nov. 2011, https://doi.org/10.1007/s11069-011-9796-6
-
Gibbons et al., Non-parametric Statistical Influence. Boca Raton: CRC Press, 2003.
-
B. Gutenberg and C. F. Richter, “Frequency of earthquakes in California,” Bulletin of the Seismological Society of America, Vol. 34, No. 4, pp. 185–188, Oct. 1944, https://doi.org/10.1785/bssa0340040185
-
Yin Ping and Xitao Fan, “Estimating R 2 Shrinkage in Multiple Regression: A Comparison of Different Analytical Methods.,” The Journal of Experimental Education, Vol. 69, pp. 203–224, 2001.
About this article

The authors have not disclosed any funding.
The datasets generated during and/or analyzed during the current study are available from the corresponding author on reasonable request.
The authors declare that they have no conflict of interest.
