Abstract
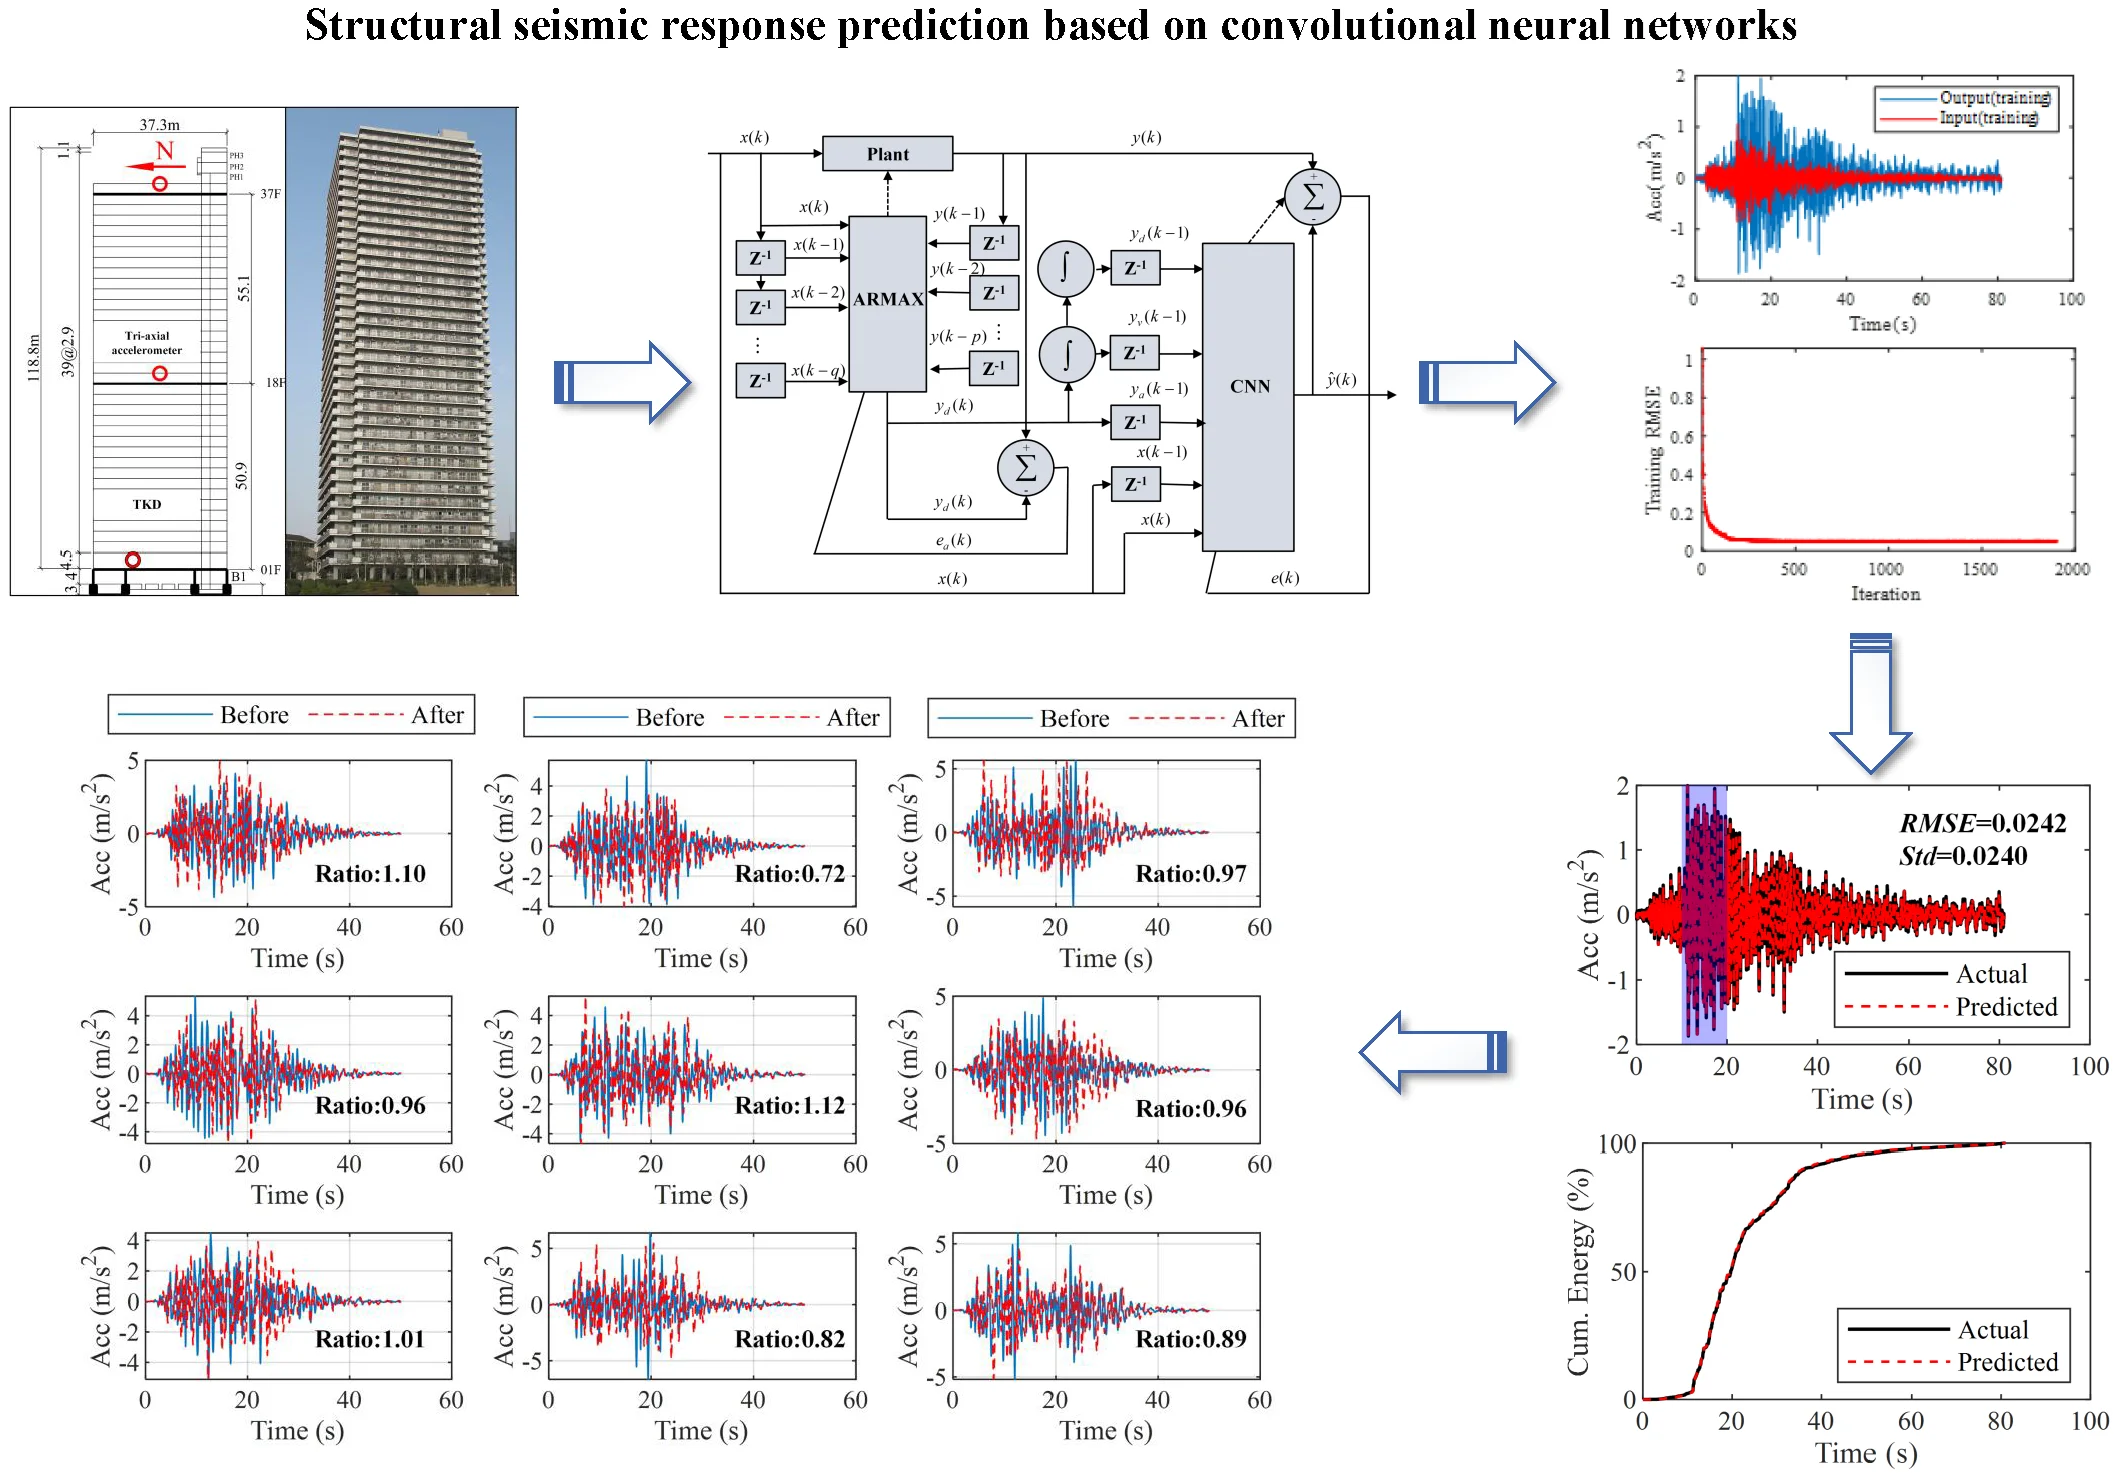
The seismic response of buildings is crucial for structural performance analysis. For structures with complete design data, the seismic response can be predicted using finite element analysis. However, for structures lacking necessary information, building finite element models and predicting their seismic response can be challenging. Compared to finite element analysis, convolutional neural networks (CNNs) can establish a neural network mapping relationship between the structure and the seismic response to predict the structural response without design data. In this paper, a structural response prediction model based on CNNs is established, aiming to analyze the effect of natural frequency reduction on the structural response after the Tohoku earthquake. The successful prediction of the structural acceleration and displacement response provides a new analytical method for predicting the seismic response of buildings lacking design data.
Highlights
- A structural response prediction model was established using convolutional neural networks and deep learning methods.
- The prediction effect of this model is relatively good, and the acceleration response, probability distribution, and cumulative energy are all in good agreement with the actual results.
- The decrease in the natural frequency of the site after the Tohoku Earthquake resulted in a slight decrease in the acceleration response of the structure under seismic action and a significant increase in the displacement response.
- The seismic response prediction method based on CNN provides a new analysis method for predicting the structural response of buildings that lack design data information.
1. Introduction
The structural response to earthquakes is a crucial factor seismic performance analysis. After the Tohoku earthquake, the natural frequency of buildings decreased significantly due to soil nonlinearity [1]. Although numerical simulation can be used for structural seismic response analysis, it requires building complex finite element models based on relevant design drawings. Besides, the analysis process demands strict theoretical support and involves solving problems such as boundary condition processing and selection of seismic input. Consequently, predicting the seismic response of some structures lacking necessary design data can be challenging. In recent years, artificial intelligence and deep learning have developed rapidly, with convolutional neural networks (CNNs) being one of the most popular deep learning algorithms used in image classification, object detection, and text recognition [2]. The academic and engineering communities are increasingly applying CNNs to the field of civil engineering, such as structural modal identification, structural health monitoring, and seismic response prediction [3]-[5]. Compared to finite element analysis, CNNs can establish a neural network mapping relationship between the structure and the seismic response to predict the structural response without design data. This approach provides a promising solution for predicting the seismic response of structures without necessary design data. In this paper, CNNs will be used to establish a structural response prediction model, analyze the structural response, and study the impact of the decrease in natural frequency on the structural response after Tohoku earthquake on March 11, 2011. The acceleration and displacement responses of the structure before and after the earthquake was successfully predicted and compared by using the model, and the predicted results meet expectations, providing a new method for predicting the structural response of buildings lacking of design data information.
2. Construction and training of CNN
The construction of CNN models mainly includes two parts: hyper-parameters and grid structure. The hyper-parameters of CNN mainly include the depth of the network, the characteristics of convolutional and pooling layers, as well as the number of neurons and activation functions in fully connected layers. The method of changing the network depth is to change the hierarchy firstly, and then increase the number of convolutional layers in each hierarchy under the same hierarchical structure to further change the network depth [6].
Fig. 1Flowchart of the method
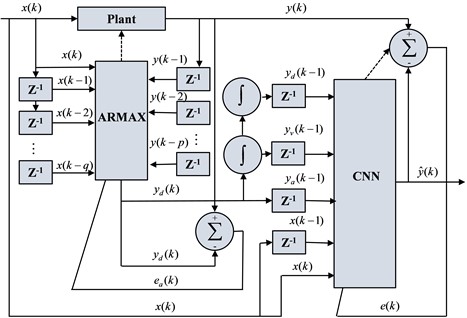
Fig. 2Diagram of target building
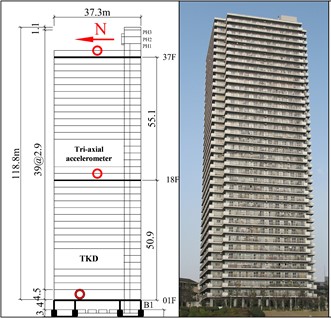
The TKD building was selected as the target building, which is located at Tsukuda, Chuo-ku, Tokyo. It is constructed as a reinforced concrete building founded on relatively soft top soil layers, and the accelerometers are located on the 1st, 18th, and 37th floors (shown in Fig. 2). The north-south component of recorded data from the accelerometers located on the 1st floor is used as neural network input and the same component of recorded data from the accelerometers on the 37th floor is used as the output of the neural network. A two-stage method is used to predict the acceleration response of the structure. Firstly, in this paper, the structural response prediction model with single input and single output is developed using the Autoregressive Moving Average with Exogenous Inputs (ARMAX [7]) model with the corresponding strong earthquake records as inputs and the acceleration response of the structure's roof as outputs. ARMAX is an autoregressive moving average model with additional inputs and its model structure is shown below:
where and denote the output and input of the system at that moment in time, respectively, is called the autoregressive coefficient, is called the sliding average coefficient, and is the measurement noise. Theand are estimated using the Least Square Method.
After building the model using ARMAX, a convolutional neural network is then used to predict the response of the structure. First, based on the numerical integration of the predicted acceleration using the ARMAX model, the predicted velocity and displacement are obtained. Then, the , , , and their n delayed values, i.e., their values of previous time points are combined to build the input of the CNN model (Fig. 1). In this paper, the delay number is set to range from 50 to 300.
The north-south acceleration component of the 1st floor recorded before the March 11, 2011 Tohoku earthquake is used as the input of the test set, and the same acceleration component of the 37th floor is used as the output of the test set. One of the input and output of the training set is shown in Fig. 3. The training is carried out by iterative solving, and the change of the root mean square error (RMSE) during the training process is shown in Fig. 3. A total of rounds of iterations is set, and as the number of iterations increases, the RMSE of the predicted value and the actual value as well as the loss function all show a decreasing trend in general, but when n is increased to a certain number, it will reach saturation, and at this time, the loss function reduction is not obvious when the number of iterations is increased. Here, the RMSE is used to measure the fit between the predicted values and the actual values, and the smaller the RMSE, the higher the accuracy of the measurement:
where is the number of samples in the data set, and and are the actual and predicted values, respectively.
Fig. 3Input and output of CNN model training set (before the “3·11” Tohoku Earthquake)
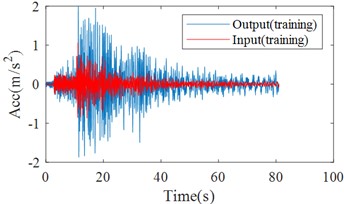
a) Time history curves of input and output
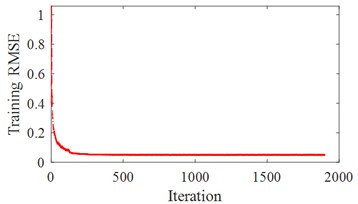
b) Training RMSE
Table 1Parameters of convolutional neural network model of structural response
Layer name | Parameterization | |
Kernel size | Number | |
Input Layer | 100×2 | |
Convolutional Layer 1 | 6×2 | 16 |
Convolutional Layer 2 | 6×2 | 16 |
Convolutional Layer 3 | 6×2 | 16 |
Convolutional Layer 4 | 6×2 | 16 |
Convolutional Layer 5 | 6×2 | 32 |
Convolutional Layer 6 | 6×2 | 32 |
Convolutional Layer 7 | 6×2 | 32 |
FC Layer 1 | 256 | |
FC Layer 2 | 64 | |
FC Layer 3 | 1 | |
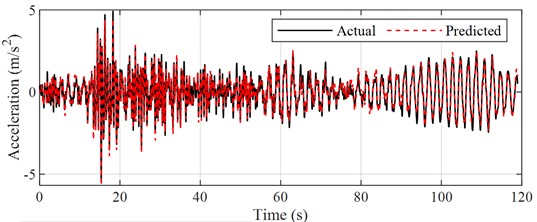
The optimal parameters of the convolutional layer, pooling layer, convolutional kernel, and fully connected layer neurons are mainly obtained based on a large number of experimental calculations of the control variable method, so that the fit between the predicted value and the actual value is maximized. The hyperparameters of the CNN prediction model of the structural response in this paper are shown in Table 1, where the third column indicates the number of neurons in the convolutional kernel or the fully connected layer, and FC represents the fully connected layer. Then the acceleration predicted by the CNN model is compared with the strong earthquake record from the accelerometer on the structure vertex. By inputting a seismic record (from the accelerometer located on 1st floor) into the CNN model to obtain the predicted values, it can be seen that the predicted values are basically consistent with the actual strong earthquake records (shown in Fig. 4). The RMSE and standard deviation (Std) are both around 0.02, indicating there is only a slight difference between the actual and predicted values.
Fig. 4Comparison of CNN model training results with actual records (before the Tohoku Earthquake)
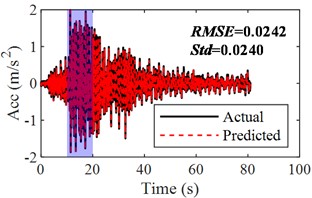
a) Time history of actual and predicted response
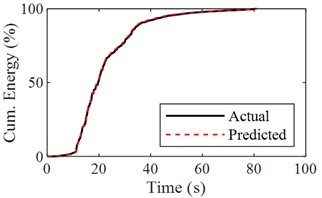
b) Cumulative energy of actual and predicted response
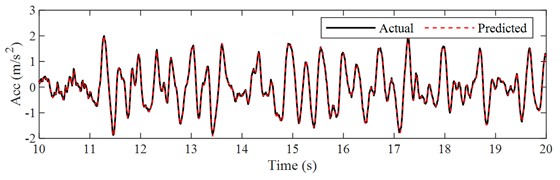
c) Time history of actual and predicted response ([10, 20] time interval)
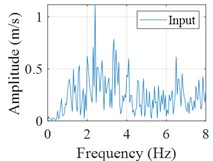
d) Fourier spectrum (input)
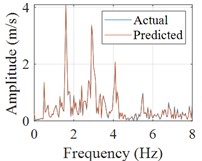
e) Fourier spectrum (response)
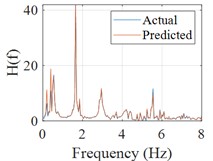
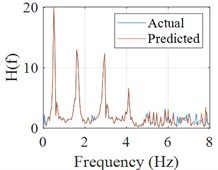
f) Frequency response function
The sum of squares of acceleration is generally defined as cumulative energy, which is an important physical quantity to characterize the non-stationary nature of the structural response, so the cumulative energy of acceleration is used to assess the agreement between the actual and predicted accelerations in this paper. The Fourier spectrums of the input, actual response and predicted response are calculated, then the frequency response function can be obtained and the peak frequencies corresponding to natural frequencies of the structure can be clearly identified, which can make the mechanical properties of the building evaluated (shown in Fig. 4(d-f)).
Fig. 5Time history of actual and predicted response
Recorded data from the accelerometer located on 1st floor during another earthquake event is selected as input and the corresponding predicted results are shown in Fig. 5. Besides the comparison between the predicted and actual acceleration curves, the probability distributions and normalized cumulative energy curves are also compared, which are basically the same in terms of trend and values (shown in Fig. 6(a-b)). Similarly, the Fourier spectrums and frequency response function are calculated, which indicates that the robustness of the proposed the CNN model is satisfactory (Fig. 6(c-e)). Most of the acceleration values are concentrated in the [-2, 2] interval, and the acceleration energy graphs are normalized for easy comparison. It can be seen that the values and trends of the acceleration energy graphs of the predicted and actual values are basically the same, and 80 % of the energy is concentrated in the first 100 s interval.
A CNN prediction model was also built for strong earthquake data after the Tohoku Earthquake (still using the TKD building as target structure), but in order to make the article more compact, only the results of the data before the earthquake are shown in this paper. The above results show that the prediction model based on CNN has high prediction accuracy for structural seismic response and indicate that the method is feasible.
Fig. 6Comparison of CNN model training results with actual records (before the Tohoku Earthquake)
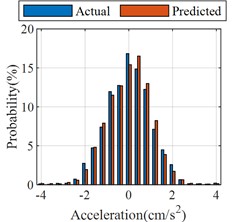
a) Probability distributions
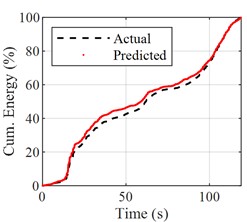
b) Normalized cumulative energy curves
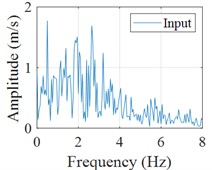
c) Fourier spectrum (input)
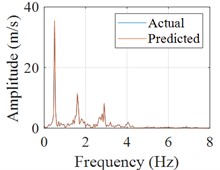
d) Fourier spectrum (response)
e) Frequency response function
3. Comparison of structural seismic response prediction results before and after the Tohoku earthquake
After the validity and accuracy of the aforementioned CNN has been verified, the next step will be to input the ground vibration and obtain the acceleration response and displacement response of the structure through the model. By using CNN prediction models based on the data before and after the Tohoku earthquake on March 11, 2011, respectively, the top acceleration response and displacement response induced by the same acceleration input to the target structure (TKD building) can be obtained.
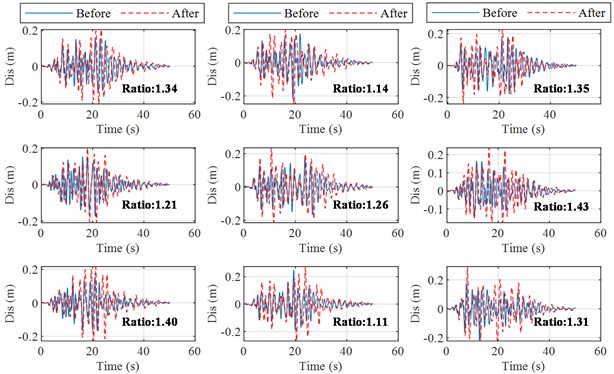
The seismic response before and after the earthquake is calculated. 9 seismic waves are inputted for the calculation based on the established CNN prediction model, and finally the average of the maximum response before and after the earthquake is counted. Besides, the ratios of PGA after the earthquake to before the earthquake and ratios of Max. displacement after the earthquake to before the earthquake are calculated (shown in Fig. 7-8). The acceleration of the structure after the earthquake is generally seen to decrease, but the peak acceleration at the apex of the structure basically does not change much, on the contrary the relative displacement of the apex is increased. The results show that the acceleration response at the apex of the structure after the earthquake has slightly decreased to about 95 % of what it was before the earthquake. In contrast to the acceleration response, the average value of the maximum structural displacement is increased, by approximately 28 % of the value before the Tohoku Earthquake.
4. Conclusions
In this paper, a structural response prediction model has been developed based on CNN, which in turn analyzes the structural response and investigates the effect of the reduction in natural frequency on the structural response after the Tohoku Earthquake. Based on the training results and predicted values from this neural network model, the following conclusions are drawn.
1) This CNN prediction model can effectively predict the seismic response of structures.
2) The decrease in the natural frequency of the site after the Tohoku Earthquake resulted in a slight decrease in the acceleration response of the structure under seismic action and a significant increase in the displacement response.
3) The seismic response prediction method based on CNN provides a new analysis method for predicting the structural response of buildings that lack design data information.
Fig. 7Predicted structural acceleration response before and after the Tohoku earthquake
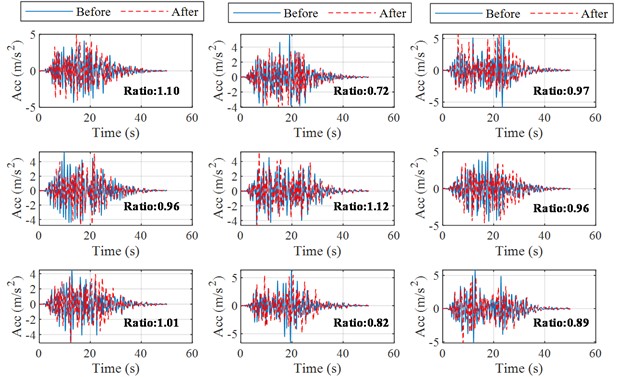
Fig. 8Predicted structural displacement response before and after the Tohoku earthquake
References
-
O. V. Pavlenko, “Atypical soil behavior during the 2011 Tohoku earthquake (М w = 9),” Journal of Seismology, Vol. 20, No. 3, pp. 803–826, Jul. 2016, https://doi.org/10.1007/s10950-016-9561-0
-
J. Gu et al., “Recent advances in convolutional neural networks,” Pattern Recognition, Vol. 77, pp. 354–377, May 2018, https://doi.org/10.1016/j.patcog.2017.10.013
-
R. Yang, S. K. Singh, M. Tavakkoli, N. Amiri, M. A. Karami, and R. Rai, “Continuous video stream pixel sensor: A CNN‐LSTM based deep learning approach for mode shape prediction,” Structural Control and Health Monitoring, Vol. 29, No. 3, Mar. 2022, https://doi.org/10.1002/stc.2892
-
L. Luan, J. Zheng, M. L. Wang, Y. Yang, P. Rizzo, and H. Sun, “Extracting full-field subpixel structural displacements from videos via deep learning,” Journal of Sound and Vibration, Vol. 505, p. 116142, Aug. 2021, https://doi.org/10.1016/j.jsv.2021.116142
-
J. Wang, Y. Xie, T. Guo, and Z. Du, “Predicting seismic interaction effect between soil and structure group using convolutional neural network,” Structures, Vol. 50, pp. 1011–1020, Apr. 2023, https://doi.org/10.1016/j.istruc.2023.02.087
-
Y.-C. Wu, F. Yin, and C.-L. Liu, “Improving handwritten Chinese text recognition using neural network language models and convolutional neural network shape models,” Pattern Recognition, Vol. 65, pp. 251–264, May 2017, https://doi.org/10.1016/j.patcog.2016.12.026
-
H. Adeli and X. Jiang, “Dynamic fuzzy wavelet neural network model for structural system identification,” Journal of Structural Engineering, Vol. 132, No. 1, pp. 102–111, Jan. 2006, https://doi.org/10.1061/(asce)0733-9445(2006)132:1(102)
About this article

The authors have not disclosed any funding.
The datasets generated during and/or analyzed during the current study are available from the corresponding author on reasonable request.
The authors declare that they have no conflict of interest.
