Abstract
In order to more effectively and intuitively obtain the modal characteristics of steel structural components, a graphical analysis scheme is proposed based on dynamic testing, finite element simulation, and virtual reality technology. Based on the external excitation method, the vibration sensors and measurement point positions were reasonably arranged according to the number of nodes in the structural components. Through the data processing of the detection unit, the vibration response can be effectively obtained and provide a verification basis for the simulation results. The finite element software Midas Civil was used to model and analyze structural component models, and the results of the first five modes and natural frequencies were obtained. The structural data of modal analysis will be compared and integrated into the virtual environment model through VRML. Due to the ease of modifying the parameters of the virtual model, compared to traditional methods, it is faster and more accurate in detection and scientifically reasonable in control.
Highlights
- A graphical analysis scheme is proposed based on dynamic testing, finite element simulation, and virtual reality technology.
- Based on the external excitation method, the vibration sensors and measurement point positions were reasonably arranged according to the number of nodes in the structural components.
- Through the data processing of the detection unit, the vibration response can be effectively obtained and provide a verification basis for the simulation results.
1. Introduction
Steel structural components are widely used in manufacturing, construction, transportation, and other fields, capable of withstanding large tensile, bending, and vibration loads [1]. During the assembly process of structural components, as the cantilever length continues to increase, the cantilever end continues to bend downwards. The stress of the rod near the cantilever support point increases under load, and may even exceed the allowable range or cause local buckling of the compression rod, which can cause severe vibration response [2, 3]. Therefore, it is very necessary to analyze the natural vibration mode of structural components, which is one of the foundations to ensure construction stability. Taking bridges as an example, traditional construction monitoring methods are gradually unable to meet the needs with the increasing scale of the structure. This is mainly due to the manual operation of traditional measuring instruments, which is time-consuming and labor-intensive, and the lack of measured data points and low level of automation, making them very suitable for the current form of large-scale engineering construction. Therefore, it is urgent to use computer network technology, digital image processing technology, and virtual reality technology to establish a comprehensive intelligent construction monitoring system [4].
Through modal analysis, the frequency range within which the structure is most affected and the characteristics of the main modes of each order can be determined. Based on these frequency ranges and modal characteristics, it is possible to determine some vibration reactions that may occur in certain parts of the structure under various vibration sources [5]. For example, the occurrence of cracks can be determined based on changes in modal frequency, and the location of cracks can be determined based on analysis of vibration modes. Therefore, modal analysis has become an important method for structural dynamic design and structural fault diagnosis. Measurement data can be displayed and analyzed on a computer, which is beneficial for structural inspection and corresponding measures can be taken based on the detection situation to complete construction control. In addition, the virtual reality technology of computers is also a major driving force. Engineering construction usually involves converting planar two-dimensional design drawings into three-dimensional physical objects. Once the complexity of the structure reaches a certain level, it is difficult to fully reproduce the designer’s intentions. Through strict computer logic operations, the structural model has been well restored and displayed, enabling engineering personnel to have a first-hand understanding of the structure and appearance of the building. They can also modify structural parameters in a virtual environment based on various operating conditions and provide feedback to the real environment to guide the construction control of the structure.
2. Application of modal analysis method
2.1. Modal testing and process analysis
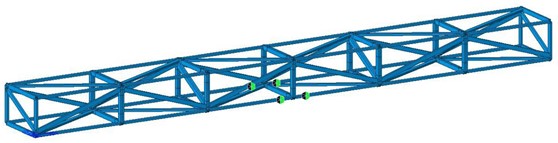
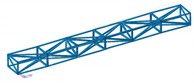
The steel structural component model studied in the paper consists of a total of 6 sections, totaling 3 m, arranged in a cantilever manner at both ends. Each segment is 0.5 m long, 0.3 m wide, and 0.2 m high. The segments are connected with ordinary bolts, and then the steel truss beam is fixed on the bridge pier. The model is shown in Fig. 1, with sensors arranged at the nodes of each segment. If the three-dimensional spatial vibration signal of the steel truss beam model needs to be fully collected, at least 24 sensors must be used simultaneously to collect the vibration signal. Due to the insufficient number of channels in the signal acquisition instrument (only 16 channels are supported) and the limited number of sensors (only 8 unidirectional sensors), in order to obtain vibration signals from 24 measurement points, it is necessary to use a fixed reference point and a moving measurement point method. A total of 5 tests (5 working conditions) are conducted before and after, and then the 5 test data are combined to obtain all required vibration data from 24 measurement points.
Fig. 1Node layout for modal testing
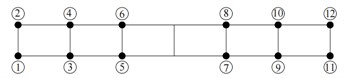
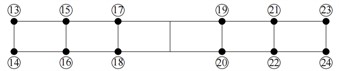
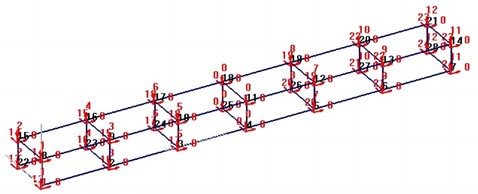
Fig. 2Vibration response results of nodes
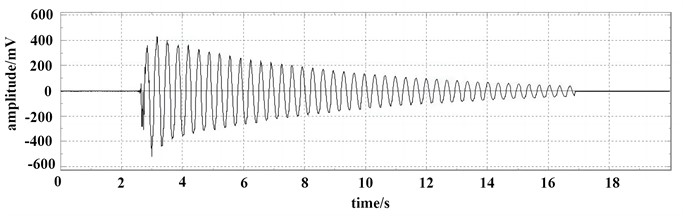
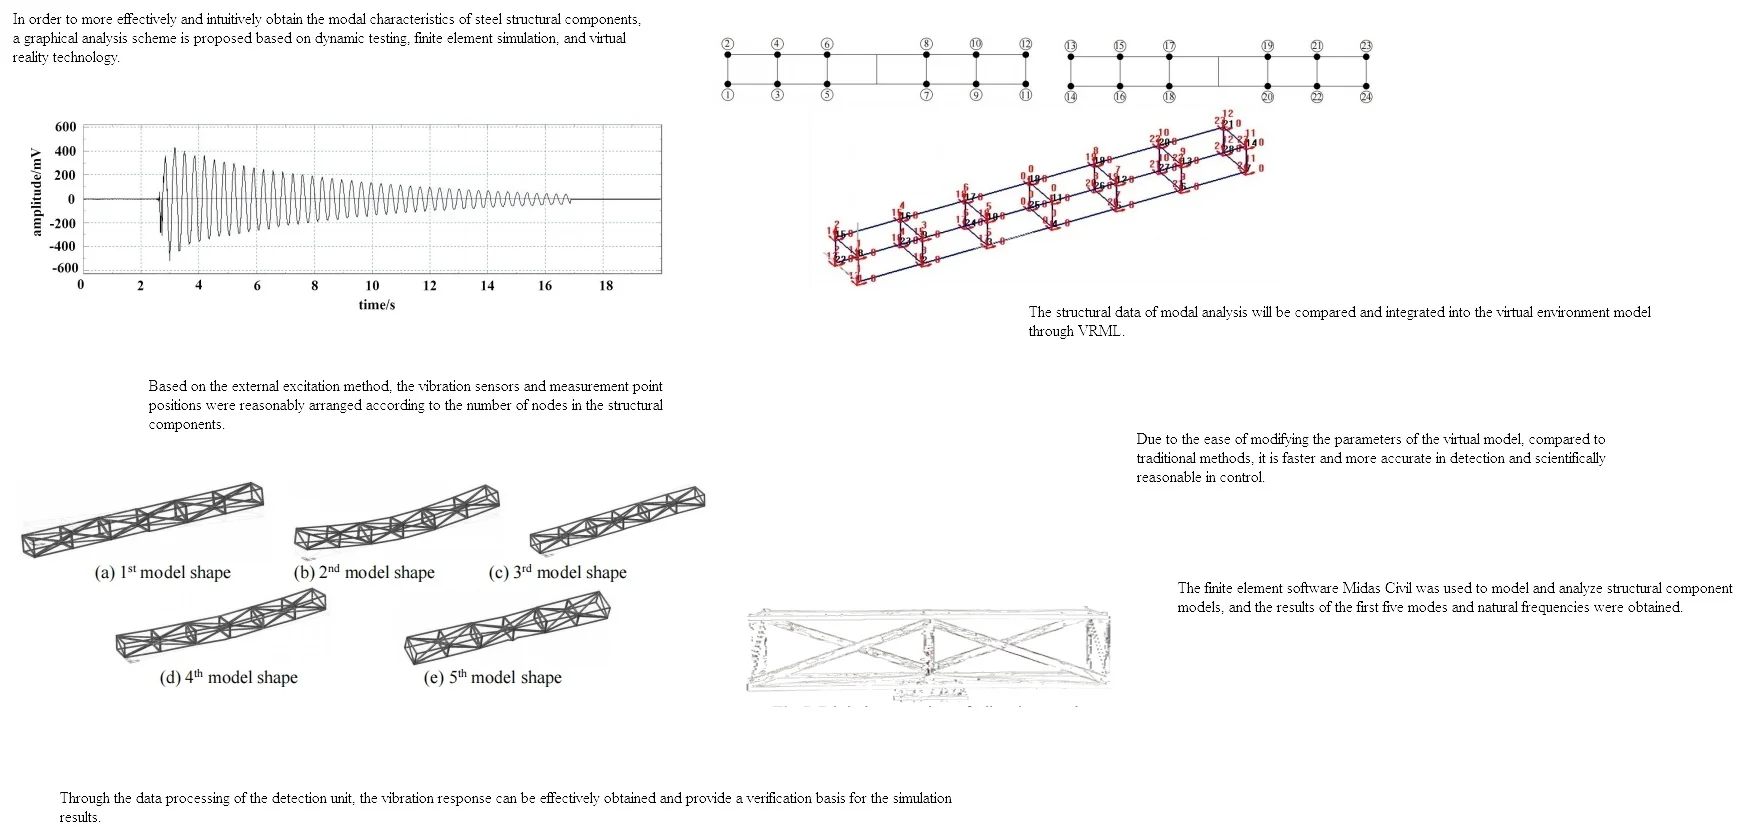
Connect the sensor to the signal acquisition instrument using a data cable, and then interact with the computer for data. Input the calculated calibration coefficient into DASP software and set the sampling frequency to 102.4 Hz. This experiment adopts the hammering method, where vibration data is collected at the same time as the hammering. When the structural vibration is about to end, the collection is completed, with a collection time of approximately 18 seconds. Vibration data from 8 measuring points is collected at once. Vibration response results of nodes is shown in Fig. 2, Although vibration response and spectral characteristics can be obtained, they are still not intuitive and visual enough.
2.2. Finite element analysis of modal characteristics
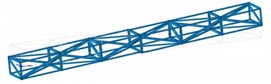
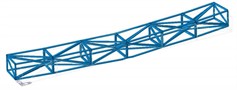
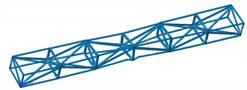
Finite element analysis is currently one of the most effective means of modal calculation, with good convenience and intuitiveness. The structural component model is modeled and analyzed using the finite element software Midas Civil, as shown in Fig. 3, and its size and material characteristics are consistent with the actual model. All hollow rectangular pipe members of steel structural components are simulated using spatial beam elements. There are various methods for analyzing dynamic characteristics, including subspace iteration method, multiple Ritz vector method, and Lanczons method. The subspace iteration method is adopted in the paper. The calculated mode order of the initial model and the measured mode order may not be consistent, and the order of the same calculated mode may also change during the structural parameter iteration process. To ensure that the calculated and measured vibration modes match and improve the accuracy of model correction, modal confidence criteria can be introduced to calculate the correlation between the two.
Fig. 3Establishment of finite element model
The entire process of finite element model modification is essentially the process of optimizing structural parameters using real structural response data, and the parameter optimization process is fundamentally an iterative process. By optimizing the algorithm, a faster method can be used to complete the iterative process and find the optimal values of structural parameters. Through model optimization, the error between the theoretical calculation values of the finite element model and the measured values is within the allowable range of engineering, which can reflect the true state of the structure. After determining the number of vibration modes and iteration times in the Midas Civil eigenvalue analysis module, the established model was analyzed to obtain the first five natural frequencies and vibration modes of structural components, as shown in Table 1 and Fig. 4.
Fig. 4The first five order model shape
a) 1st model shape
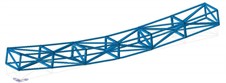
b) 2nd model shape
c) 3rd model shape
d) 4th model shape
e) 5th model shape
Table 1Calculation results of natural frequency
Modal order | 1 | 2 | 3 | 4 | 5 |
Natural frequency / Hz | 3.24 | 18.92 | 33.24 | 36.68 | 40.24 |
Vibration mode characteristics | Vertical anti symmetry | Vertical positive symmetry | Transverse anti symmetry | Transverse positive symmetry | Torsion |
3. Vibration analysis based on virtual reality technology
3.1. Deformation measurement by digital image method
The instruments and equipment used in the experiment mainly include image acquisition equipment, tripods for cameras, and laptops. The image acquisition equipment can be either a dedicated camera or a mobile phone. The advantages of specialized cameras are quite prominent. Due to their large photosensitive components and a large number of pixels, their accuracy is relatively high. Moreover, they have a high degree of automation, strong resistance to environmental interference, and a large working range, and are generally used for image acquisition at construction sites. The cost of mobile phones is relatively low, they are easy to carry, and their accuracy also meets general engineering needs with minimal environmental interference. Therefore, the experiment used mobile phones for image collection, with parameters of 12 million pixels and 4032 pixels × 3024 pixels on each image.
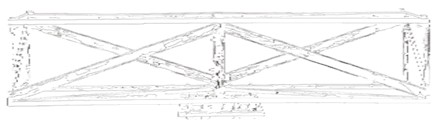
After the structural component model is assembled according to the working conditions, select a suitable location to install the image acquisition equipment. Before loading, take an image as the reference image, and after processing, record the vertical coordinates of the corresponding measurement points as the initial values. After stabilizing, take another image as a deformation image, and after processing, record the vertical coordinates of the corresponding measurement points as the final value. The digital processing of vibration result is shown in Fig. 5. The difference between the final value and the initial value, after conversion, is the actual displacement value of the measuring point after loading. According to error analysis, the calculation results of the finite element method are basically consistent with the measurement results of the digital image method. The minimum absolute error value of the finite element method is only 0.68 %, and the maximum absolute error value is 4.64 %. The minimum absolute error value of the digital image method is only 0.26 %, and the maximum absolute error value is 8.12 %, both within the allowable range of engineering errors.
Fig. 5Digital processing of vibration result
After the collection of video images is completed, it is necessary to read and process the video images. At present, the main computer software for reading and processing includes Matlab, Open CV, and Labview. When conducting static research on structures, such as conducting static load tests, it is necessary to use image acquisition equipment to collect images before and after loading, and then process them to obtain corresponding edges. By comparing the different edges of the front and back images and corresponding conversions, the actual displacement of the measured point can be obtained. When conducting dynamic research on structures, such as conducting dynamic load tests, it is necessary to use video capture equipment to collect vibration videos of the research object. Use corresponding techniques to decompose the collected vibration videos into one image after another, and then conduct corresponding research.
3.2. Modeling of virtual reality
To establish a large-scale irregular structure model in a virtual environment, three-dimensional spatial modeling software can be used to establish and render virtual scene models. The VRML used in this paper is a software that is easy to operate and can effectively create three-dimensional scenes. In order to accurately simulate the deformation characteristics of structural components themselves and meet the requirements of virtual reality interactive control, it is necessary to process the basic structural components in a virtual reality environment. For steel structural component models, it is necessary to label each node and program of the model in the VR program editor to facilitate editing and usage. If the structure itself is very irregular or the structural deformation after applying loads cannot be achieved using a single model, the structural model should represent the overall model of the structure and the shape of the components through node coordinates based on the actual size of the structure and referring to the modeling units, proportional dimensions, etc. of VRML software, to ensure the smooth progress of subsequent work.
For large-scale virtual scene models, the specific placement positions of various structural components require specific numerical editing. Obtaining the corresponding coordinate values of these objects in the proposed virtual scene model, or placing the object models required for each virtual scene in the corresponding coordinate positions, is the prerequisite and foundation for achieving overall virtual environment simulation. If the coordinate values of each object model have already been determined during modeling, their coordinate form is absolute coordinates. When conducting structural analysis simulation, only the model to be edited needs to be exported. If the coordinates of each target structure are not determined during modeling, their coordinate form is relative coordinates, and the positional connections between the object models are relatively close. If multiple models are involved in the problem, it will cause some difficulties for editing and modification, but it is relatively easy to determine the coordinate parameter values. In summary, when building large-scale virtual scenes, users can choose appropriate coordinate forms for integration based on their actual needs.
4. Conclusions
Vibration has always been a key issue affecting the safety of steel structural components and has attracted the attention of researchers. The use of modal analysis technology and virtual reality technology to analyze structural components is beneficial for rapidly advancing construction control progress and providing effective guarantees for engineering construction, and the following conclusions can be drawn:
1) The dynamic load test mainly uses external excitation methods, and the collection equipment is used to collect and analyze data, thus obtaining the modal parameters of the structure. Modal simulation is mainly based on finite element calculation, and the visualized vibration mode results can be obtained, which is the foundation of virtual reality modeling.
2) The establishment of a building structure model based on virtual reality technology can convert the two-dimensional plane profile of the required structure into three-dimensional spatial data. At the same time, it is necessary to add physical information corresponding to structural components in the virtual environment model, including load data, material data, constraints, and other information.
References
-
W. Sun, H. Ma, and Z. Chen, “Multi-objective optimization of cylindrical shell structure with local viscoelastic damping patch for minimum vibration response and lightest attachment mass,” Structural and Multidisciplinary Optimization, Vol. 65, No. 11, pp. 1–28, Nov. 2022, https://doi.org/10.1007/s00158-022-03418-3
-
C. de O. Mendonça, U. A. Monteiro, R. H. R. Gutierrez, L. A. Vaz, J. Medeiros, and E. B. Tinoco, “Correction to: Prediction of vibration responses in a reciprocating compressor interstage piping system using the modal expansion method,” The International Journal of Advanced Manufacturing Technology, Vol. 119, No. 5-6, pp. 4091–4091, Mar. 2022, https://doi.org/10.1007/s00170-022-08876-z
-
V. Goel and N. Kumar, “Vibration response analysis of healthy and cracked gears through different signal processing techniques,” Vibroengineering PROCEDIA, Vol. 39, No. 3, pp. 43–47, Dec. 2021, https://doi.org/10.21595/vp.2021.22311
-
N. J. A. Egarguin, T. Meklachi, D. Onofrei, and N. D. Harari-Arnold, “Vibration suppression and defect detection schemes in 1D linear spring-mass systems,” Journal of Vibration Engineering and Technologies, Vol. 8, No. 4, pp. 489–503, Aug. 2020, https://doi.org/10.1007/s42417-019-00104-5
-
H. H. Chen et al., “Research on machining technology of complex structure parts of high-speed train body,” in Journal of Physics: Conference Series, Vol. 1721, No. 1, p. 012035, Jan. 2021, https://doi.org/10.1088/1742-6596/1721/1/012035
About this article

The paper was supported by the Shandong Vocational Education Teaching Reform Research Project (2022341) and Shandong Province Smart Education Research Project, titled “Research on the Development and Application of Ideological and Political Teaching Resources for University Curriculum Based on Virtual Reality Technology”.
The datasets generated during and/or analyzed during the current study are available from the corresponding author on reasonable request.
The authors declare that they have no conflict of interest.
