Abstract
In order to ensure the good stability of the composite pipeline under fluid dynamic loads, finite element analysis method was applied to simulate and calculate the modal characteristics under dry and wet mode conditions. According to the working principle and structural characteristics of composite pipelines, the model was parameterized and simplified to improve computational efficiency and convergence. The modal testing platform is constructed, consisting of a combination of pipeline structure and pipeline support structure. The movement direction of the slider is limited by the guide rail used, allowing the horizontal section of the branch to move only along its own pipeline axis direction. The fluid structure coupling analysis technology was applied to obtain the vibration mode and spectral response results of the composite pipeline, which was verified through an experimental platform. The research results indicate that the natural frequency in wet mode was about 16 % lower than that in dry mode. In addition, it could be proven that the simulation scheme had good computational accuracy, with a maximum error of 9.2 %.
Highlights
- According to the working principle and structural characteristics of composite pipelines, the model was parameterized and simplified to improve computational efficiency and convergence.
- The modal testing platform is constructed, consisting of a combination of pipeline structure and pipeline support structure.
- The movement direction of the slider is limited by the guide rail used, allowing the horizontal section of the branch to move only along its own pipeline axis direction.
1. Introduction
Composite pipelines, as an engineering structure for transporting gases and liquids, are widely used in fields such as nuclear industry, aerospace, and shipbuilding [1-3]. During the service process of a composite pipeline structure, the instability of the fluid motion state can cause displacement and deformation of the pipeline, which in turn affects the fluid state [4, 5]. This interaction between the fluid and the structure is called fluid solid coupling [6]. Under this long-term fluid solid coupling effect, the flow pipeline may experience fatigue damage or even rupture, resulting in safety accidents. From this, it can be seen that conducting research on the fluid solid coupling vibration characteristics of composite pipeline structures and analyzing the mechanism of pipeline structural vibration has important guiding significance for the safety design and operation of pipeline systems [7]. Scholars have conducted extensive numerical and experimental research on the fluid structure coupling vibration problem of composite pipeline structures, but there is relatively little research on the common composite pipeline structures with branch pipes in practical engineering. Therefore, this article will take the simplified design of a complex pipeline system in a certain engineering project as the research object, and conduct modal and flow induced vibration response tests and numerical studies successively, providing a certain reference for improving the safety and reliability of pipeline structures.
2. Testing and calculation of modal and vibration response characteristics
2.1. Processing of structural models
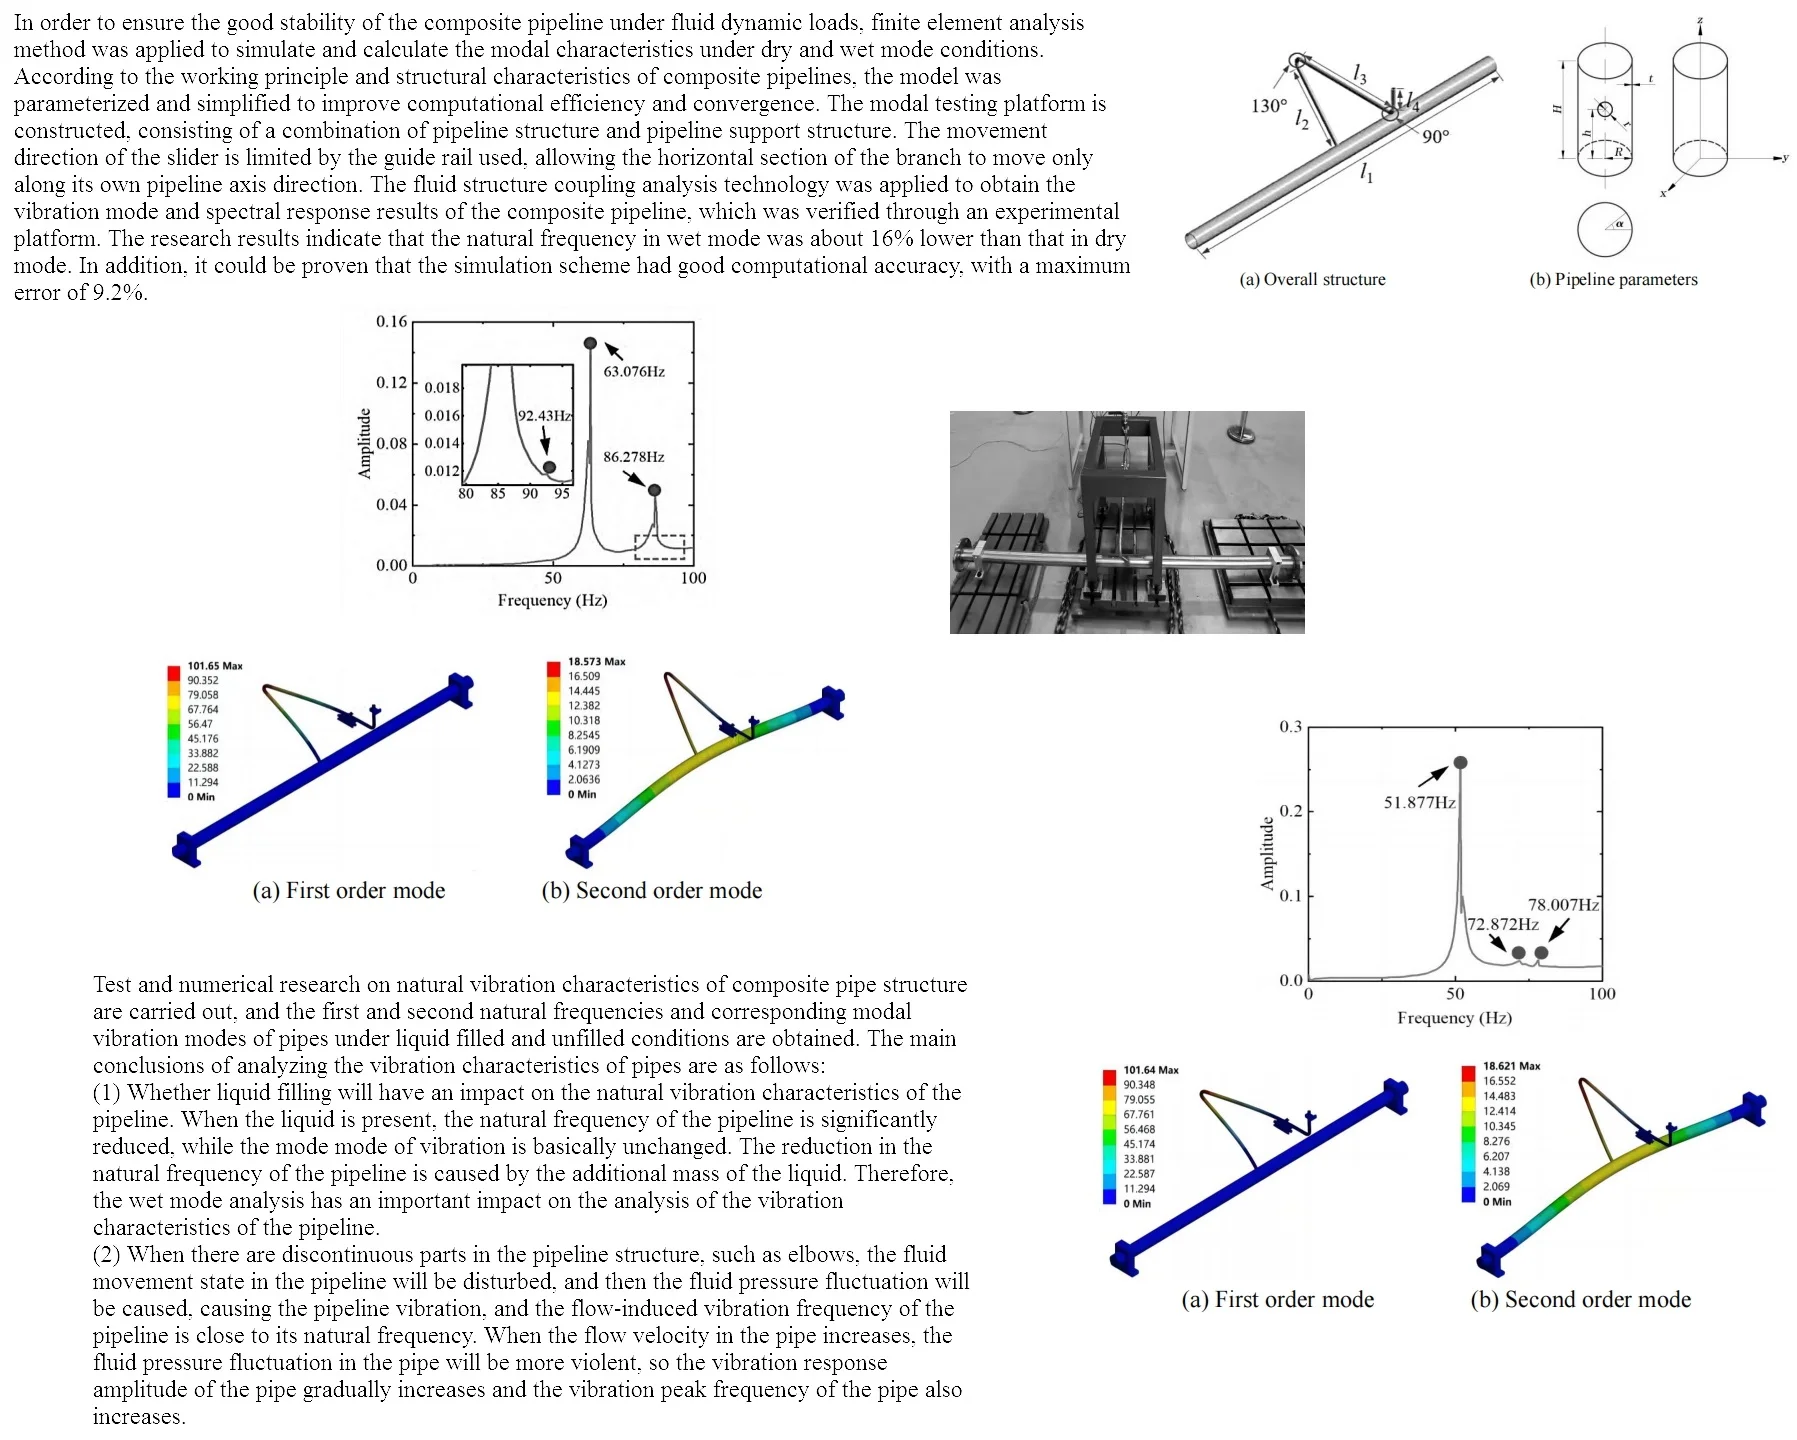
The pipeline structure model in this study is a composite pipeline structure obtained by simplifying the design of a complex pipeline system in a certain engineering project. The structural model is shown in Fig. 1, consisting of two parts: a straight pipe and a bent pipe. In order to increase the universality of research conclusions, the internal structural characteristics of the interface structure due to process requirements were ignored during the modeling process, and the structure was simplified as a thin-walled cylindrical shell structure with holes. The opening parameters of pipeline structure include opening radius, opening angle, and opening height. In practical engineering, the bottom of the pipeline structure is connected through welding seams. The straight pipe has a length of 2000 mm, an outer diameter of 63 mm, and a wall thickness of 4 mm. The outer diameter of the bend is 16 mm, and the wall thickness is 1mm. It is considered as a branch pipe welded at the central cross-section of the straight pipe (main pipe). The bend configuration includes 130° bends and 90° bends. The pipeline structure material is 304 stainless steel, with an elastic modulus of 206 GPa, a density of 7850 kg/m3, and a Poisson’s ratio of 0.3.
Fig. 1Structure and key parameters of composite pipelines
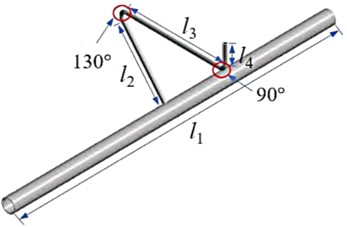
a) Overall structure
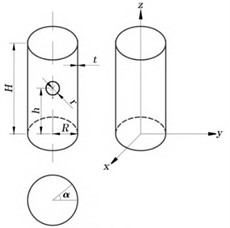
b) Pipeline parameters
2.2. Experimental modal testing plan
The experimental model is composed of a combination of pipeline structure and pipeline support structure, and the overall assembly results of both are shown in Fig. 2. The aluminum T-shaped support is installed at the ends of the main pipe and branch pipe, and the T-shaped support at the end of the branch pipe is fixed using a designed carbon steel bracket. Fix the carbon steel bracket and the T-shaped support at the end of the main pipe on the cast iron T-shaped groove to achieve the fixing effect on the pipeline. In addition, guide supports are installed at a distance of 140 mm from the 90° elbow in the horizontal section of the branch pipe. The characteristic of using guide rails to restrict the movement direction of the slider allows the horizontal section of the branch pipe to only move along its own pipeline axis direction.
Fig. 2Experimental design of modal testing

Modal tests were conducted on the above experimental model using the hammering method, and the natural frequencies and modal vibration modes of the pipeline were obtained in both filled and unfilled states [8]. The modal testing system includes a force hammer, acceleration sensor, electrical load amplifier, and LMS data acquisition system. Among them, the impact of the hammer on the test pipeline generates an excitation signal, and the acceleration sensor measures the pipeline response signal [9]. The signal is amplified by a charge amplifier and collected by the LMS data acquisition system. In the internal Impact module, it is necessary to create a geometric model, set the sensor parameters of the channel, use a hammer oscilloscope to determine the channel range, set the bandwidth, add windows, etc. After setting up, testing will be conducted. After selecting the obtained modal data, set the analysis bandwidth and sequentially extract stable system poles to obtain the corresponding modal shapes. The main pipe is divided into 6 sections along its axial busbar direction for point placement, and 9 measuring points are arranged along the circumference at the same cross-sectional position of the pipeline, totaling 54 measuring points. The inclined section of the branch pipe is divided into 5 sections along its axial busbar direction for point arrangement. Four measurement points are arranged along the circumference at the same cross-sectional position of the pipeline, totaling 20 measurement points. The horizontal section of the branch pipe is divided into 7 sections, and 3 measurement points are arranged along the circumference at the same cross-sectional position of the pipeline, with a total of 21 measurement points arranged. Due to the low height of the pipeline structure from the ground, it is not possible to accurately strike the bottom vertices of the main and branch horizontal sections, so no measurement points have been set. The response signal point picked up by the acceleration sensor is measurement point 82 on the horizontal section of the branch pipe, and all other measurement points are hammering points.
3. Simulation and calculation of modal characteristics
To compare and verify with experimental results, this study conducted modal simulation analysis using the finite element software Ansys Workbench. The finite element model of the combined pipeline structure was established based on the actual pipeline support structure. The type of indirect contact surface between the slider and the guide rail in the guide support is set to non separation, that is, non separation in the normal direction and small displacement in the tangential direction [10]. The types of other contact surfaces such as bolts and pipe clamps, pipe clamps and branch pipes are all set to bind. Due to the fact that the mass of the T-shaped groove foundation in the experimental model is much greater than that of the pipeline and carbon steel support, it can be approximated as a fixed constraint. Therefore, in the finite element model, both the bottom surface of the T-shaped support at the main pipe and the bottom surface of the carbon steel support are set as fixed constraints. For grid division, the T-shaped support and aluminum guide rails at the main and branch ends are divided using hexahedral elements, while the rest are divided using tetrahedral elements. Conduct modal analysis on the established finite element model, in which the wet modal analysis in the liquid filled state adopts the Modal Acoustic module, sets the fluid domain as Acoustic Body, and establishes the acoustic FSI interface between the fluid and pipeline, which is solved using asymmetric solving methods. As a fluid transport structure, pipelines exhibit certain differences in their natural vibration characteristics between filled and unfilled states under the coupling effect with the fluid. Among them, the natural vibration characteristics in the unfilled state are called dry mode, and the natural vibration characteristics in the filled state are called wet mode.
3.1. Without liquid inside the tube (dry mode)
The dry mode frequency response curve of the composite material pipeline structure in the unfilled state obtained using modal testing systems and methods is shown in Fig. 3. It can be seen that the first three natural frequencies of the dry mode of the test pipeline are 63.076 Hz, 86.278 Hz, and 92.43 Hz, respectively. Through comparative analysis, it can be seen that the error of the natural frequency is within 10 %, and the modal shape is also well matched. The modal shape are shown in Fig. 4. The modal vibration mode corresponding to the first natural frequency is manifested as a local vibration mode where only the branch pipe bends and vibrates axially. The lower natural frequencies are relatively close, and the corresponding modal vibration modes are manifested as the overall bending vibration of the main and branch pipes. The reason for the error between the modal test and simulation results may be due to the complex design of the guiding support structure, which has a certain impact on the stiffness of the branch pipe. The experimental pipeline and support structure are connected by bolts, and the magnitude of the pre tightening force applied to the bolts during the assembly process will have a certain impact. There are differences between the experimental pipeline structure and the simulation model, such as branch pipe deviation caused by welding at the connection between the main pipe and the branch pipe.
Fig. 3Vibration response curve under dry mode conditions
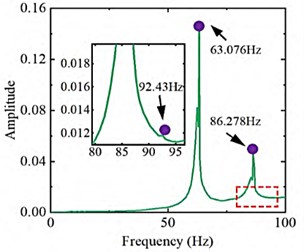
Fig. 4Modal shape under dry mode conditions
a) First order mode
b) Second order mode
3.2. With liquid inside the tube (wet mode)
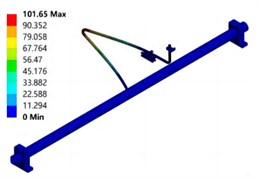
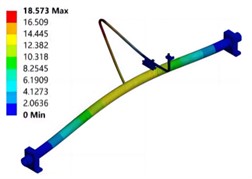
The vibration response curve of the test pipeline in the liquid filled state is shown in Fig. 5. It can be seen that the first three wet mode natural frequencies are 51.877 Hz, 72.872 Hz, and 78.007 Hz, which are approximately 16 % lower than the dry mode natural frequencies. This indicates that the additional mass of the fluid will reduce the natural frequency of the pipeline structure. The simulation results of vibration mode are shown in Fig. 6. It can be seen that the natural frequencies and modal shapes of the two are in good agreement, and the dry and wet modal shapes are basically the same, indicating that the modal shape of the pipeline structure is less affected by fluid action. In addition, considering that there may be some bubbles inside the pipeline during the water injection process, the relative error between the wet model test and simulation results is slightly greater than that of the dry model.
Fig. 5Vibration response curve under wet mode conditions
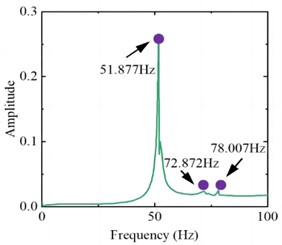
Fig. 6Modal shape under wet mode conditions
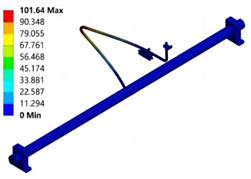
a) First order mode
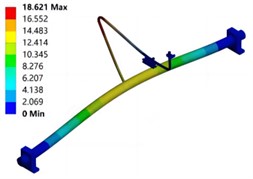
b) Second order mode
3.3. Testing of vibration response characteristics
To verify the response characteristics of the pipeline under excitation, fluid vibration conditions shall be designed. Piping systems include test piping, metal hoses, and connecting piping. A small section of pipe is connected at the inlet and outlet of the test pipe as a stable development section, and a metal hose is connected at the other end of the stable development section to reduce the impact of the pressure pulsation of the pump output fluid on the test results. The data acquisition system includes LMS data acquisition system, charge amplifier, acceleration sensor and electromagnetic flowmeter. The electromagnetic flowmeter is used to monitor the flow in the pipeline in real time. In addition, a ball valve for opening and closing the outlet of the water tank and a filter for filtering particulate impurities in the fluid are provided between the water tank and the water pump. The manual control valve and gate valve are respectively arranged in the main circuit and bypass circuit connected with the pump outlet. By adjusting the opening of the two valves, the flow of the main section can reach the flow required by the test. Before the test, except for the manual control valve of the main section, other valves shall be kept open. When the water pump starts, the water in the water tank flows into the main section by adjusting the opening of the valve of the manual control valve. Observe the real-time flow value in the pipe through the electromagnetic flowmeter. When the flow required for the test is reached and stabilized, the acceleration vibration response is collected and three repeatability tests are conducted. The test results are shown in Table 1. It can be seen that the deviation between the test value and the simulation value of different natural frequencies of the pipeline is less than 10 %, and the accuracy meets the engineering requirements.
Table 1Comparison of frequency of vibration peak
Piping type | Testing value / Hz | Simulation value / Hz | Error / % |
Main pipeline | 65 | 71 | 9.2 |
Branch pipeline | 67 | 70 | 4.5 |
4. Conclusions
Test and numerical research on natural vibration characteristics of composite pipe structure are carried out, and the first and second natural frequencies and corresponding modal vibration modes of pipes under liquid filled and unfilled conditions are obtained. The main conclusions of analyzing the vibration characteristics of pipes are as follows:
1) Whether liquid filling will have an impact on the natural vibration characteristics of the pipeline. When the liquid is present, the natural frequency of the pipeline is significantly reduced, while the mode of vibration is basically unchanged. The reduction in the natural frequency of the pipeline is caused by the additional mass of the liquid. Therefore, the wet mode analysis has an important impact on the analysis of the vibration characteristics of the pipeline.
2) When there are discontinuous parts in the pipeline structure, such as elbows, the fluid movement state in the pipeline will be disturbed, and then the fluid pressure fluctuation will be caused, causing the pipeline vibration, and the flow-induced vibration frequency of the pipeline is close to its natural frequency. When the flow velocity in the pipe increases, the fluid pressure fluctuation in the pipe will be more violent, so the vibration response amplitude of the pipe gradually increases, and the vibration peak frequency of the pipe also increases.
References
-
R. K. Bhamu, A. Shukla, S. C. Sharma, and S. P. Harsha, “Vibration response of steam turbine healthy and cracked blade under the stress stiffening and spin softening effects,” Proceedings of the Institution of Mechanical Engineers, Part K: Journal of Multi-body Dynamics, Vol. 236, No. 2, pp. 224–243, Feb. 2022, https://doi.org/10.1177/14644193221078656
-
A. Daşdemir, “A modal analysis of forced vibration of a piezoelectric plate with initial stress by the finite-element simulation,” Mechanics of Composite Materials, Vol. 58, No. 1, pp. 69–80, Mar. 2022, https://doi.org/10.1007/s11029-022-10012-7
-
V. Nicoletti, R. Martini, L. Amico, S. Carbonari, and F. Gara, “Operational modal analysis for supporting the retrofit design of bridges,” Ce/papers, Vol. 6, No. 5, pp. 1182–1188, Sep. 2023, https://doi.org/10.1002/cepa.2125
-
M. Sohrabifard, M. Nategh, and M. Ghazavi, “Evaluation, calibration, and modal analysis for determination of contact stiffness between workpiece and components of milling fixture,” Proceedings of the Institution of Mechanical Engineers, Part B: Journal of Engineering Manufacture, Vol. 237, No. 12, pp. 1819–1835, Nov. 2022, https://doi.org/10.1177/09544054221138165
-
S. de Carolis, A. Messina, and L. Soria, “Modal analysis through response-based FRFs: Additional modes for local diagnoses,” Journal of Sound and Vibration, Vol. 549, No. 1, p. 117574, Apr. 2023, https://doi.org/10.1016/j.jsv.2023.117574
-
T. Sato, M. Funato, K. Imai, and T. Nakajima, “Self-powered fault diagnosis using vibration energy harvesting and machine learning,” Sensors and Materials, Vol. 34, No. 5, p. 1909, May 2022, https://doi.org/10.18494/sam3907
-
J. Kang and S. Zeng, “Uncertainty quantification in operational modal analysis of time-varying structures based on time-dependent autoregressive moving average model,” Journal of Sound and Vibration, Vol. 548, No. 1, p. 117549, Mar. 2023, https://doi.org/10.1016/j.jsv.2022.117549
-
H. D. Chalak, A. M. Zenkour, and A. Garg, “Free vibration and modal stress analysis of FG-CNTRC beams under hygrothermal conditions using zigzag theory,” Mechanics Based Design of Structures and Machines, Vol. 51, No. 8, pp. 4709–4730, Aug. 2023, https://doi.org/10.1080/15397734.2021.1977659
-
X. Yin, Z. Huang, and Y. Liu, “Damage features extraction of prestressed near-surface mounted CFRP beams based on tunable Q-factor wavelet transform and improved variational modal decomposition,” Structures, Vol. 45, No. 1, pp. 1949–1961, Nov. 2022, https://doi.org/10.1016/j.istruc.2022.10.036
-
J. Cui, Y. Peng, J. Sun, and B. Li, “Multi-modal stress characteristics under coupling effect of strip and work roll,” International Journal of Precision Engineering and Manufacturing, Vol. 22, No. 10, pp. 1719–1733, Aug. 2021, https://doi.org/10.1007/s12541-021-00559-1
About this article

The authors have not disclosed any funding.
The datasets generated during and/or analyzed during the current study are available from the corresponding author on reasonable request.
The authors declare that they have no conflict of interest.
