Abstract
In order to ensure the good stability and reliability of the vane pump, the modal characteristics of the mechanical structure were studied and analyzed through finite element simulation and impact modal testing. Based on the stiffness criterion, an optimization plan was proposed for the structure of the vane pump without reducing the natural frequency. Adopting tetrahedral adaptive mesh method, the mesh quality of the modal simulation model was verified to ensure the accuracy and efficiency of the calculation. In modal testing, force sensors and acceleration sensors were arranged reasonably. The excitation signal would be transmitted to the integrated vibration testing system for processing, and modal analysis and processing would be carried out through LMS Test Lab. Based on curve fitting, the spectrum and modal parameters of the tested structure could be obtained. The influence of different curvature radius of cover plates on natural frequencies were studied, and the results show that increasing the curvature radius within a certain range can enhance stiffness and improve processability.
Highlights
- Based on the stiffness criterion, an optimization plan was proposed for the structure of the vane pump without reducing the natural frequency.
- Adopting tetrahedral adaptive mesh method, the mesh quality of the modal simulation model was verified to ensure the accuracy and efficiency of the calculation.
- Based on curve fitting, the spectrum and modal parameters of the tested structure could be obtained.
1. Introduction
Vane pump is often operated at high speeds and subjected to various pre-stresses, which can cause severe vibration and resonance, leading to fatigue fracture of the main body [1]. In order to improve the reliability of the vane pump, modal analysis of the structure should be firstly carried out in the design [2, 3]. By analyzing the modal characteristics of the vane pump structure, the natural frequency can be obtained, which has guiding significance for preventing structural damage and optimizing the structure. At present, although scholars have conducted a lot of research on the strength or modal characteristics of vane pump, there is relatively little analysis on the optimization of dynamic performance such as lightweight or process optimization based on modal analysis results [4, 5]. Due to the complex structure of the vane pump, which involves fluid dynamics analysis, it is may not possible to optimize the structural size on a large scale. However, the curvature radius inside the vane pump is an important and sensitive parameter that affects the vibration characteristics and the complexity of manufacturing processes, which needs to be optimized. Structural optimization based on modal characteristics can not only improve the manufacturing process of vane pump, but also enhance the overall stiffness, ultimately achieving optimization of vibration reduction performance.
2. Modal analysis based on finite element method
2.1. Model establishment
Finite element analysis is one of the most effective methods for modal calculation. As a mainstream finite element analysis software, ANSYS provides many methods for modal extraction, among which the Lanczos method is the most widely used in practical engineering. This algorithm is commonly used in shell element models and can extract multiple modes, with a wide range of applications. The finite element method can usually be divided into displacement method, hybrid method, and force method. The force method is solved through node force, the displacement method is solved through node displacement, and the hybrid method is solved through both. The displacement method has strong universality and is easy and simple to process by computer, making it widely used. Based on the characteristics of the analysis target, the displacement method is adopted. Firstly, discretize the model by dividing the continuum into individual free bodies. Then, construct the displacement function, establish the unit equation, and jointly establish the relevant algebraic equations. Finally, use the relevant algebraic equations and corresponding boundary conditions to solve the corresponding results.
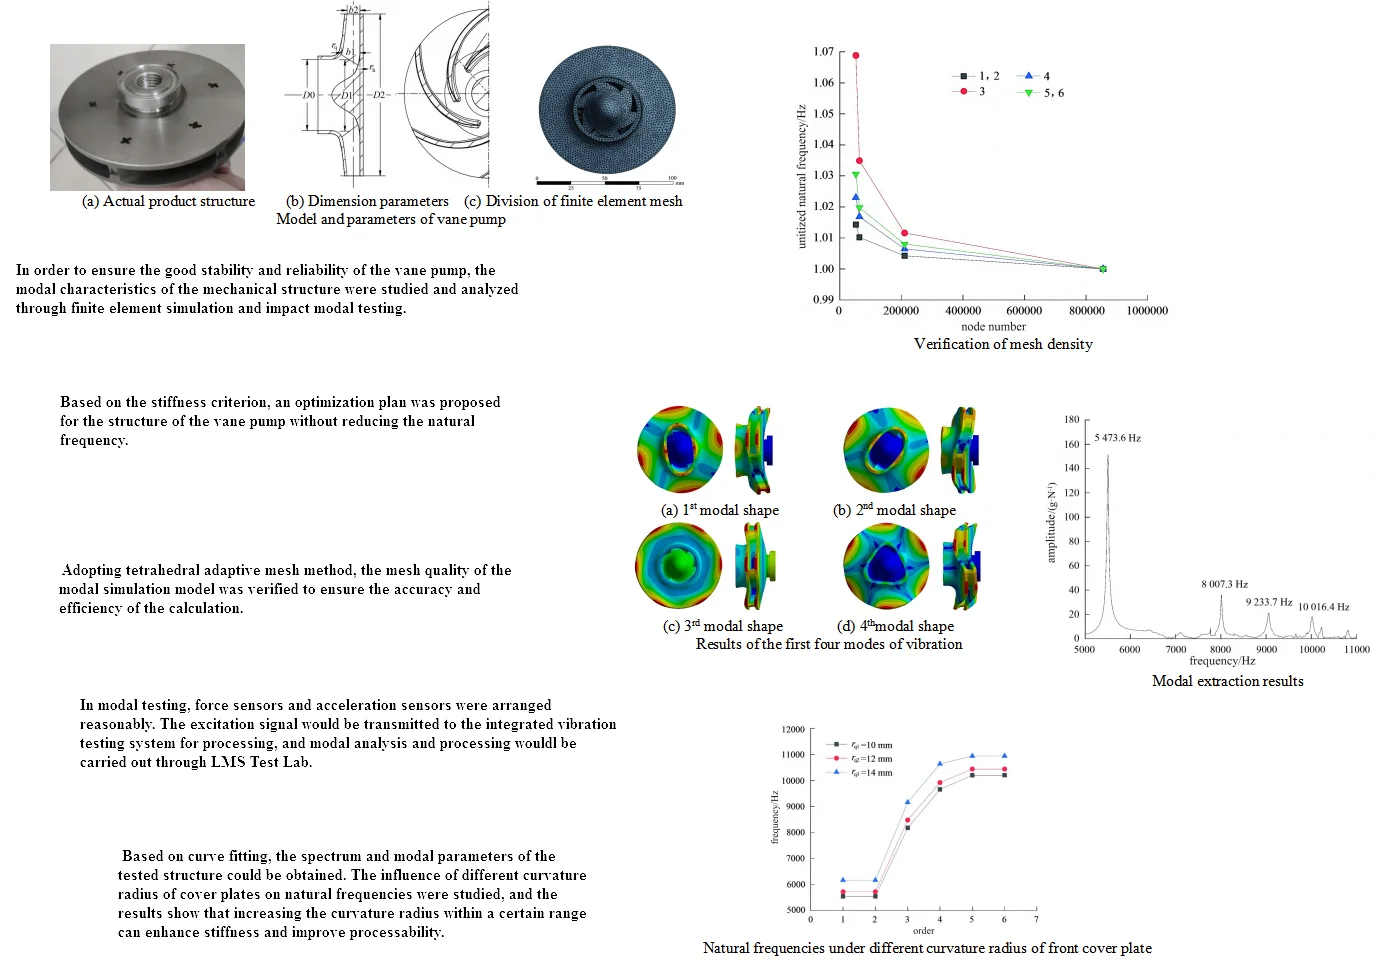
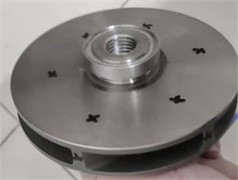
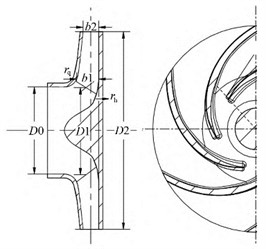
Actual product structure is shown in Fig. 1(a), and its physical properties are shown in Table.1. The working parameters of this vane pump are as follows: design flow rate 25 m3/h, speed 6600 r/min, medium density 1200 kg/m3, design head 52 m. The structural parameters are as follows: the number of blades 6, the outer diameter of the impeller 100 mm, the curvature radius of the front cover plate of the impeller 10 mm, and the curvature radius of the rear cover plate of the impeller 20 mm, as shown in Fig. 1(b). Use Pro/E software to conduct 3D solid modeling of the vane pump, and its material performance parameters are shown in Table 1. Workbench software is used to divide the model into tetrahedral grids, as shown in Fig. 1(c). Because grid partitioning and subsequent solutions consume a large amount of computational resources, four schemes are adopted for grid cell size, namely 0.5, 1, 2, and 3 mm.
Table 1Physical properties of vane pum
Parameter | Young’s modulus / GPa | Density / (kg·m-3) | Poisson’s ratio | Yield strength / MPa |
value | 205 | 4620 | 0.36 | 800 |
Fig. 1Model and parameters of vane pump
a) Actual product structure
b) Dimension parameters
c) Division of finite element mesh
Fig. 2Verification of mesh density
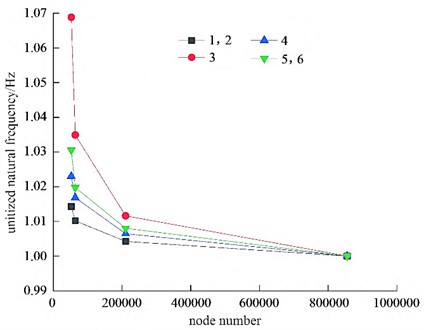
The corresponding grid nodes and cell numbers for each scheme after partitioning are shown in Table 2. To verify the accuracy of the grid, pre solve the first six free modes of the model for each of the four schemes, and obtain the corresponding natural frequencies for each order. Unitize the natural frequencies obtained for each scheme, and divide the first six frequencies by the final convergence frequency to obtain the normalized natural frequencies, as shown in Fig. 2. It can be seen that when the number of nodes reaches 200000 or more, the line gradually converges to 1, indicating that the natural frequency is less and less affected by the density of grid nodes. Considering the accuracy of the calculation results and the availability of computing resources, the second option is selected as the final solution. Finally, the number of elements is 136682 and the number of nodes is 203575.
Table 2Number of elements and nodes under different mesh densities
Scheme | 1 | 2 | 3 | 4 |
Number of nodes | 83560 | 203575 | 62108 | 54873 |
Number of elements | 53215 | 136682 | 30170 | 21055 |
3. Simulation results of modal characteristics
The solving conditions are the free mode of the model, that is, the boundary conditions are unconstrained and unloaded. After calculating and solving, it will be found that the first six natural frequencies of the vane pump are almost zero. This is because the model is in a rigid body mode in free mode, so its structural dynamic characteristics are stable and only move or rotate as a whole. In fact, the first natural frequency is the seventh natural frequency. The effective first four modes of the model are calculated, as shown in Fig. 3. It can be seen that the first and second vibration modes of the impeller are the same, with their vibration directions perpendicular to each other, and the maximum deformation occurs at the inlet and outlet. The third mode of vibration is the axial vibration of the impeller, with the deformation increasing from the center of the impeller along the radial direction, reaching its maximum at the outlet. The fourth vibration mode is the torsional vibration along the hub at the impeller outlet, with its directions perpendicular to each other, and the maximum deformation occurs at the impeller outlet.
Fig. 3Results of the first four modes of vibration
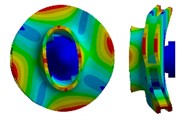
a) 1st modal shape
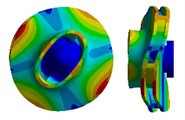
b) 2nd modal shape
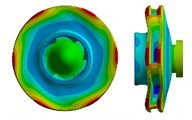
c) 3rd modal shape
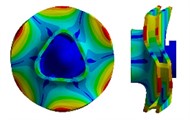
d) 4thmodal shape
4. Verification of modal experiments
Due to the small overall size of the tested structure, the hammer excitation method was chosen for testing. Firstly, use a PCB force hammer to hammer the impeller. The force sensor and acceleration sensor installed on the impeller will generate signals and transmit them to the integrated vibration testing system for processing, obtaining the transfer function. By transmitting data to LMS Test Lab software for modal analysis and processing, the spectrum and modal parameters of the tested structure are obtained based on curve fitting. The experimental components are shown in Fig. 4, including integrated vibration testing system equipment, PCB force hammer, and PCB three-way sensor. In order to ensure that the model is in a free state during the experiment, a soft rope is used to suspend the impeller on the bracket, with the aim of avoiding interference with the test and causing significant differences in the measured natural frequencies, as its stiffness is much smaller than that of the impeller. Fix the position of the model and attach the PCB three-way sensor to the model response test point through adhesive. The test point should fully reflect the overall structural vibration characteristics of the specimen, so the test point is selected at the center of the front cover plate. The position of the hammering test points directly affects the natural frequency of the impeller, and the hammering points are arranged in the front cover plate, blade, and rear cover plate of the impeller. During the hammering process, the force of the hammering should always be perpendicular to the surface of the measured point. Deviation from this direction will cause the measured value to decrease. The hammering force should not be too strong, and it should be ensured that the impeller will not experience severe vibration after hammering. Excessive force can exceed the sensing range of the force sensor, resulting in an increase in the measured value. The sensitivity of the force sensor is 10 mv/g. If the force is too small, the measured value of the sensor decreases, resulting in a decrease in the measured value. In order to improve the accuracy of the hammering results, the method of continuously hammering each test point five times is adopted, and then the results are linearly averaged to obtain the best hammering result and improve the signal-to-noise ratio.
Fig. 4Composition of modal experiments
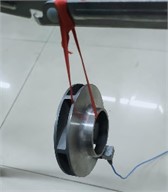
a) The suspension state of the model
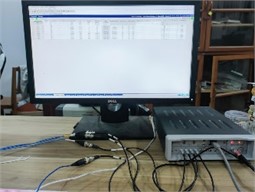
b) Signal collector and upper computer
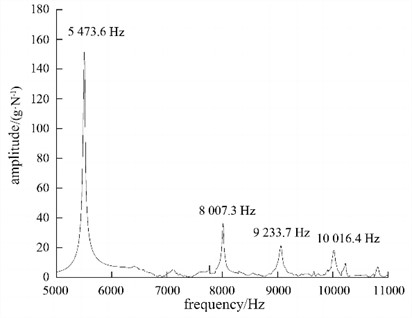
To accurately test modal parameters, the Ploy Max method is used to process the obtained frequency response function signal. Extract the most clear signal of the frequency response function separately, which can more intuitively see the natural frequency values of each mode, and obtain the frequency response function curve as shown in Fig. 5. Due to machining errors in the impeller used during modal testing, as well as certain errors in the magnitude, direction, and position of the artificial hammering force on the impeller during testing, there may be some errors between the calculated natural frequency and the experimental natural frequency. The comparison results between the first four calculated modes and experimental modes of the model are shown in Table 3. It can be seen that through repeated experiments, the natural frequencies of each order remain relatively stable, with the maximum error located at the 1st order natural frequency, with an error value of 1.9 %. However, the errors of the other order natural frequencies are all below 1.5 %. This indicates that the established finite element model is relatively accurate and the results of modal simulation are reliable.
Table 3Natural frequency comparison of calculated and experimental results
Order | 1 | 2 | 3 | 4 |
Calculated natural frequency / Hz | 5576.2 | 8093.5 | 9339.8 | 10135.5 |
Tested natural frequency / Hz | 5473.6 | 8007.3 | 9223.7 | 10016.4 |
Error / % | 1.9 | 1.1 | 1.3 | 1.2 |
Fig. 5Modal extraction results
5. Structural optimization and analysis
5.1. The influence of front cover plate curvature on vibration
Set the curvature radius of the front cover plate to 10, 12 mm, and 14 mm, while keeping other parameters unchanged. Import the model into ANSYS Workbench for modal analysis. The modal frequency comparison diagram of three different front cover plate curvature radius impellers is shown in Fig. 6. It can be seen that increasing the curvature radius of the front cover plate can cause an increase in the natural frequencies of each order. When the curvature radius of the front cover plate increases from 10 mm to 12 mm, the natural frequencies of each order do not increase significantly. When the curvature radius of the current cover plate increases from 10 mm to 14 mm, the natural frequency increase of each order increases significantly. The maximum point is the 4th order natural frequency, increasing by 10 %. From the perspective of impeller structure, the front cover plate is connected to the impeller inlet diameter, and the rear end is connected to a diagonal edge. Increasing the curvature radius of the front cover plate will improve its support and increase the rigidity of the impeller. Therefore, in order to increase the stiffness and natural frequency of the impeller, the curvature radius of the front cover plate of the impeller can be appropriately increased.
Fig. 6Natural frequencies under different curvature radius of front cover plate
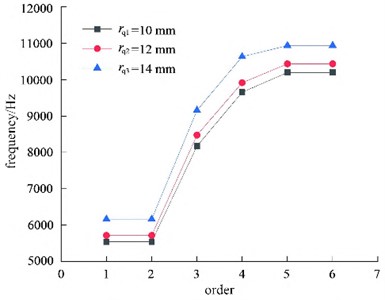
Fig. 7Natural frequencies under different curvature radius of rear cover plate
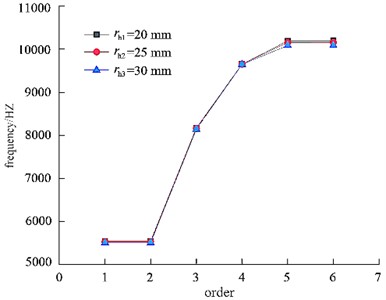
5.2. The influence of rear cover plate curvature on vibration
Set the curvature radius of the rear cover plate to 20, 25 mm, and 30 mm, while keeping other parameters unchanged. Import the model into ANSYS Workbench for modal analysis and comparison, and the natural frequencies of different curvature radii of the rear cover plate will be obtained, as shown in Fig. 7. It can be seen that by increasing the curvature radius of the rear cover plate, the natural frequencies of each order remain basically unchanged. The curvature radius of the rear cover plate has little effect on the natural frequency of the impeller, but increasing the curvature radius of the rear cover plate makes casting easier. Therefore, in order to improve the processing efficiency, the curvature radius of the rear cover plate can be appropriately increased.
6. Conclusions
The modal characteristics of vane pump has an important impact on their operational stability. The modal simulation and experimental testing of the mechanical structure were studied, and the following conclusions can be drawn.
1) Although the thickness of reinforcing ribs, number of blades, and blade thickness parameters have a significant impact on their natural frequency, optimizing these dimensions in practical applications can lead to difficulty in machining, high cost, and easy reduction of fluid dynamics characteristics. Through research, it is known that increasing the curvature radius of the front cover plate of the impeller can effectively improve the stiffness, thereby increasing the natural frequency and making it easier to machine.
2) Although the structural parameters of the rear cover plate have a small impact on the modal frequency of the impeller. But by optimizing these structural parameters, the processability can be improved to achieve more reasonable structural design.
References
-
S. de Carolis, A. Messina, and L. Soria, “Modal analysis through response-based FRFs: Additional modes for local diagnoses,” Journal of Sound and Vibration, Vol. 549, No. 1, p. 117574, Apr. 2023, https://doi.org/10.1016/j.jsv.2023.117574
-
T. Sato, M. Funato, K. Imai, and T. Nakajima, “Self-powered fault diagnosis using vibration energy harvesting and machine learning,” Sensors and Materials, Vol. 34, No. 5, p. 1909, May 2022, https://doi.org/10.18494/sam3907
-
J. Kang and S. Zeng, “Uncertainty quantification in operational modal analysis of time-varying structures based on time-dependent autoregressive moving average model,” Journal of Sound and Vibration, Vol. 548, No. 1, p. 117549, Mar. 2023, https://doi.org/10.1016/j.jsv.2022.117549
-
S. Gaygol and K. Wani, “Modal analysis of plate to analyze the effect of mass stiffeners using the Chladni plate approach,” Materials Today: Proceedings, Vol. 72, No. 3, pp. 1314–1321, 2023, https://doi.org/10.1016/j.matpr.2022.09.305
-
X. Li, D. Zhao, H. Zhai, M. Chen, and T. Zhang, “Modal analysis of circular arches in rectangular coordinate system,” Structures, Vol. 47, No. 1, pp. 2129–2137, Jan. 2023, https://doi.org/10.1016/j.istruc.2022.12.036
About this article

The authors have not disclosed any funding.
The datasets generated during and/or analyzed during the current study are available from the corresponding author on reasonable request.
The authors declare that they have no conflict of interest.
