Abstract
Globally automotive industry is going through a critical transition from gasoline vehicle to electric and hybrid electric vehicle. These changes have challenged industry with completely different vehicle driveline architecture. These systems have more electro-mechanical components which need to be critically designed for the vibration, thermal, structural and shock related requirements. Design for vibration endurance has been a major requirement and robust matured design of these systems may take several design iterations. Finite element models give us freedom to simulate and analyze design performance before actual prototype building. Simulation results can be predicted more accurately if model fidelity is strong enough. To have strong model fidelity, modal test data correlation is an important step towards robust design. In this paper, study on Test-FE model correlation has been performed for an electro-mechanical assembly using Modal Assurance Criterion. During the entire correlation study, it was assumed that the DUT was undamaged and entire focus of the work was towards improving FE model fidelity. But obtained results pointed the inconsistency between the FE model and test results at a specific region which later has been captured as a defect in the DUT. The results of this paper can help in identifying anomalies in actual product samples and in taking decision on testing other samples.
1. Introduction
The dynamic behavior of a physical structure majorly depends on its inherent properties i.e. Natural frequencies and Damping. Each natural frequency is associated with a specific mode shape, which describes how the structure deforms at that natural frequency. The mode shapes for a structure are identified in an experimental modal testing which are further correlated with modes of Finite Element Analysis model. A finite element (FE) model must be carefully created and fine-tuned with a correlation process to build confidence on modeling and dynamics prediction [1]. Various methods for the quantifiable correlation between a theoretical model and those measured in modal test have been studied in [2]. Changes are made to the finite element model when there are differences in test versus FE data. However, test data can mislead sometimes if DUT is having defects and unknown to the testing person. H. Chang et al. (2003) studied damage identification of ship under different damage conditions through numerical simulation and experimental verification done by COMAC based on orthogonality of modes before and after damage [5]. Influence of damage size onto vibration response of structure is studied with respect to undamaged unit through numerical simulation by Mehran K. et al. (2002) [4]. Cornwell P. et al. (1999) developed a method based on changes in strain energy of plate like structure with mode shapes of the structure before and after damage [6].
Based on the literature discussed so far, it can be concluded that there have been studies done on damage identification using different methods either through simulation or test. All the studies done so far show changes in vibration responses when compared damaged versus undamaged units. However, identifying damage in DUTs like electro-mechanical assembly from finite element-based model using Modal assurance criteria is yet to be studied. This research paper presents a comprehensive study on FE-test correlation of an electro-mechanical assembly using the Modal Assurance Criterion. The study has helped to establish a standard approach for identifying and locating the defects in the actual DUT with finite element based model using Modal assurance criterion.
2. Problem description
The architecture of an electric vehicle (EV) is much more different than conventional IC Engine vehicles. The typical architecture in modern electric vehicles include Battery Pack, Electric Motor, Power Electronics, On- board charger, Battery & thermal management system. The problem discussed in this paper deals with one of the power electronic system assemblies which is a very complex assembly comprising of power semiconductor device, DC Capacitor, Printed Circuit Boards, and cooling system. It becomes very much important to capture details of each component in finite element modeling to predict its performance during design stage.
The case study performed in this paper deals with detailed finite element modeling for electro-mechanical assembly and correlation study for vibration loading to improve the model fidelity to ensure robust design.
3. Approach description
The correlation between finite element models and experimental test data is crucial for ensuring accurate predictions and reliable simulations in structural analysis. Modal Assurance Criterion (MAC) is a widely adopted metric for quantifying the similarity between mode shapes obtained from FE models and experimental modal testing.
3.1. Modal assurance criterion
The Modal Assurance Criterion (MAC) is a parameter indicating the degree of consistency between a mode shape from test and another one from simulation. A MAC value near 1 indicates a high degree of correlation or consistency between two mode shapes while MAC value 0 indicates that the mode shapes are very different and have no correlation. The MAC between two mode shapes is the square of normalized dot product of their eigen vector:
MAC serves as a valuable tool for validation of finite element (FE) models. It helps in identifying areas of improvement in the FE models based on differences from test mode shapes, such as element properties, boundary conditions, constraints, or material parameters. In this project, MAC is calculated between modal test data and finite element modal results to perform correlation study on an electro-mechanical assembly.
4. Experimental modal testing
The overall goal of the modal test was to correlate the modes of a Finite Element Analysis (FEA) model with test predicted results. Therefore, it was important to have high quality measurements as the foundation for the improvements in the digital model.
Modal impact hammer using roving hammer method test was conducted on power electronic assembly and its components up to 3000 Hz frequency range.
4.1. Test instrumentation
– Accelerometers – accelerometers capable of measuring the response from the impact hammer excitation across the frequency range of interest are used. The specifications for modal analysis measurements are below:
(1) Linear (* 5 %) amplitude response from 1 to 10,000 Hz.
(2) ±10 g peak measurement range.
(3) 10 mv/g nominal sensitivity.
– Impact Hammer – the impact hammer capable of exciting the response locations across the frequency range of interest are used. The specifications for modal analysis measurements are below:
(1) Linear (* 15 %) amplitude response.
(2) ±400 N measurement range.
(3) 10 mv/N nominal sensitivity.
4.2. Test set up procedure
Boundary Conditions – The electro-mechanical assembly is provided with fixed boundary conditions at its mounting lugs.
Measurement Degree of freedoms (DOFs) – Both excitation and response degree of freedom are defined to excite and measure all identified modes of interest.
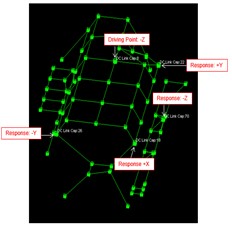
Geometry – The geometry of excitation and response DOFs are entered into the software package with adequate spatial accuracy and wireframe is used to connect the nodes (DOFs) to offer the best visual representation of the mode shapes (Fig. 1).
Fig. 1Geometry for electromechanical assembly with external, internal and total grid points
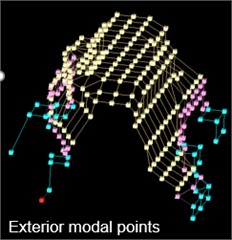
a) External modal points
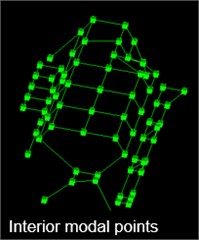
b) Internal modal points
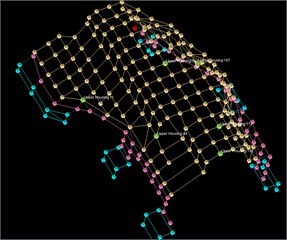
c) Total modal points
4.3. Data acquisition
Once excitation and response points are identified, DUT is impacted maintaining consistent force levels and FRF & coherence results are reviewed. The process is followed for all excitation DoFs.
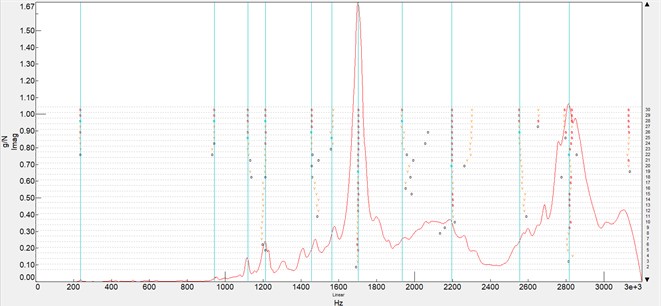
Mode shapes for coherent phasing and realistic shape are extracted using modal curve fitting in Siemens TestLab. Following the acquisition of the FRFs (transfer function matrix - H), a curve fitting process is completed to fit a linear modal model to the experimental FRFs. Poles (Modes or natural frequencies) are selected based on stabilization diagram and then the mode shapes are evaluated by completing the curve fit of the modal model to the FRFs (Fig. 2).
5. Finite element modeling
Any mechanical structure that provides mechanical support and houses PCB is referred to as housing and the combination of PCB with a mechanical structure is referred to as an electro-mechanical assembly. When such electro-mechanical assembly is subjected to vibration loads, PCB assembly shows change in its dynamics due to the combined stiffness of the housing and PCB. In such assemblies, it becomes very important to model the whole assembly to simulate the dynamic response for the power electronic components.
Fig. 2Natural frequencies selection based on stabilization diagram
A detailed FE model for similar electro-mechanical assembly has been built in ANSYS software to capture housing driven dynamics. The FE model includes housings, DC capacitor, power electronics modules, busbars along with printed circuit boards. Printed circuit board is modelled using Sherlock tool and exported to ANSYS environment to integrate with other structural components. The PCB sub-assembly model is aligned as per global co-ordinate system and contact details are defined. The mass of the FE model is verified with the tested product units. Isotropic material properties have been used for the components under consideration. Boundary conditions are captured as per the test conditions. Initial modal analysis is performed to ensure that there is no rigid body modes.
6. FE – test correlation
After thorough study of test data, results from test are stored in .unv file format and results from the simulation are captured in .RST file. These test results and FE Model Modal results are taken into Simcenter for MAC correlation study.
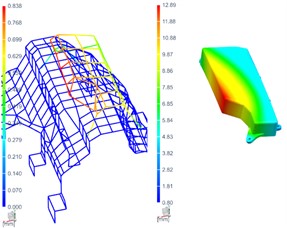
Initially, Data from two excitation points on the housing was taken for the MAC correlation study. Maximum MAC of 0.85 and Overall, MAC of 0.7 is observed across frequency spectrum for the housing. Since higher order modes were also captured with high MAC value, this study built confidence on the modeling and assumptions taken for the simulation. Housing correlation helped to understand some of the boundary condition variation with respect to test conditions. Operational mode shapes for housing from test are taken and compared with Simulation results (Fig. 3).
Having good confidence from housing mode shape correlation, the study was done on internal components of the power electronic assembly i.e. capacitor as shown in Fig. 4.
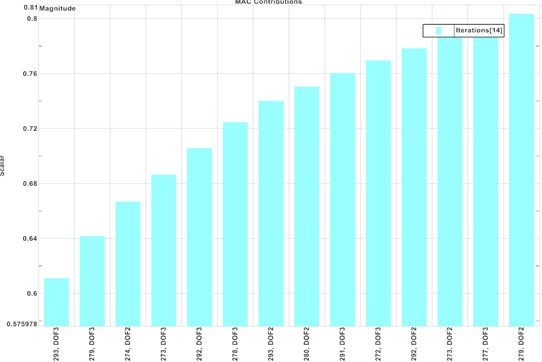
a) Even after verifying all the mass and contact details, the MAC value was not improving for the capacitor assembly. MAC contribution metric helped to identify the degree of freedoms in test results which were not available in FE simulation results.
b) MAC contribution bar chart showed degree of freedoms around left corner of the capacitor assembly to be constrained on FE model in order to improve MAC (Fig. 5).
c) On verifying the FE model with respect to test set up and DUT details, it was observed that left corner of the internal assembly was having a defect around screw location in the tested unit.
d) The study showed the advantages of Modal assurance criterion by identifying and locating a defect in the actual product.
Fig. 3Operational mode shape of housing from simulation and test
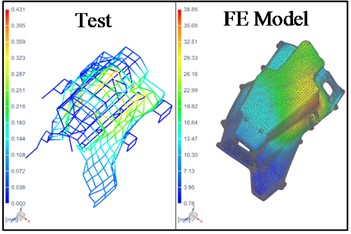
a) Percentage frequency difference – 5 %
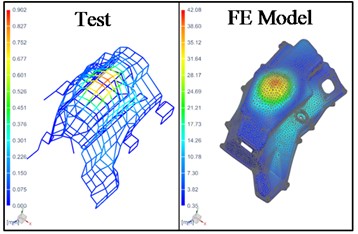
b) Percentage frequency difference – 6 %
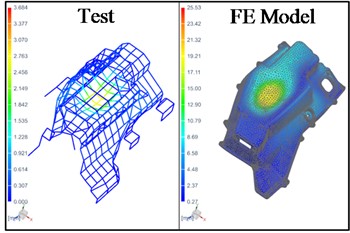
c) Percentage frequency difference – 0.2 %
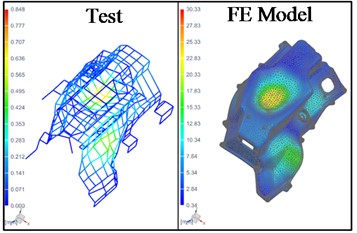
d) Percentage frequency difference – 2 %
Fig. 4Internal grid points and operation mode shapes for internal sub-assembly
a) Interior modal points
b) Percentage frequency difference: 8.5 %
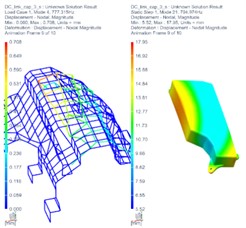
c) Percentage frequency difference: 2.2 %
Fig. 5DOFs to be constrained to improve MAC
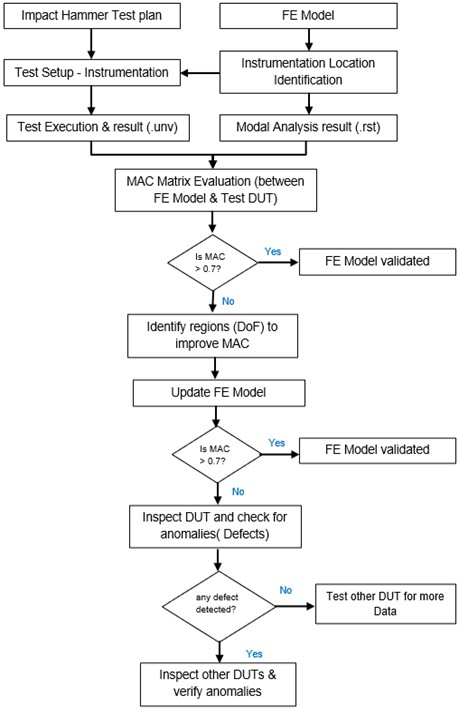
e) The whole work established a process for model correlation using MAC and how it can be effectively used to validate FE models or identify defects in units which ultimately helps business to take necessary decisions (Fig. 6).
Fig. 6Defect identification process using finite element based model and modal assurance criterion
7. Conclusions
The MAC is a valuable tool to validate finite element models, compare experimental and numerical results, identify mode shapes that are likely to contribute to dynamic responses. MAC correlation study was performed between finite element model of an electro-mechanical assembly of an electric vehicle and experimental modal test of the same. Results for external housing are found to be in good agreement with the modal experiment results in terms of frequencies and mode shapes. But the inconsistency found between FE predicted results and test data for internal components laid the foundation of establishment of the process for model correlation and defect identification using MAC method. The correlation study using MAC also helped to take decisions on inspecting and testing of other samples which provided additional benefits to the business. This work will help readers to ensure robustness of the product during the design stage and monitor on-field product health status.
References
-
T. Ting, T. L. C. Chen, and W. Twomey, “Correlating mode shapes based on the modal assurance criterion,” Finite Elements in Analysis and Design, Vol. 14, No. 4, pp. 353–360, Nov. 1993, https://doi.org/10.1016/0168-874x(93)90032-l
-
D. J. Ewins, “Model validation: correlation for updating,” Sadhana, Vol. 25, No. 3, pp. 221–234, Jun. 2000, https://doi.org/10.1007/bf02703541
-
“Fundamental of modal analysis – modal assurance criterion,” Siemens Community.
-
M. Khan, S. Mahato, D. Eidukynas, and T. Vaitkunas, “Influence determination of damage to mechanical structure based on modal analysis and modal assurance criterion,” Vibroengineering Procedia, Vol. 42, pp. 27–32, May 2022, https://doi.org/10.21595/vp.2022.22554
-
H. Cheng, J. Guo, Y. Zhang, and W. Li, “Experimental research on damage identification of fully free beams based on modal shapes,” Applied Ocean Research, Vol. 139, p. 103689, Oct. 2023, https://doi.org/10.1016/j.apor.2023.103689
-
P. Cornwell, S. W. Doebling, and C. R. Farrar, “Application of the strain energy damage detection method to plate-like structures,” Journal of Sound and Vibration, Vol. 224, No. 2, pp. 359–374, Jul. 1999, https://doi.org/10.1006/jsvi.1999.2163
-
Y. Fu, J. Liu, Z. Wei, and Z. Lu, “A two-step approach for damage identification in plates,” Journal of Vibration and Control, Vol. 22, No. 13, pp. 3018–3031, Jul. 2016, https://doi.org/10.1177/1077546314557689
-
Le, T. C., Ho, and D. D., “Damage detection in plate-like structures using modal strain energy-based approach,” Review of Ministry of Construction, Vol. 6, pp. 100–105, 2015.
About this article

The authors have not disclosed any funding.
The datasets generated during and/or analyzed during the current study are available from the corresponding author on reasonable request.
The authors declare that they have no conflict of interest.
