Abstract
The dynamic identification of a full-scale, two-storey building, made of rubble stone masonry, was achieved. Different configurations were analyzed: unstrengthened masonry and retrofitted masonry, in both undamaged and damaged conditions. Damage was accomplished by testing the building under lateral cyclic loading, to reproduce the seismic effects. The strengthening technique (CRM – Composite Reinforced Mortar) consisted in plastering the outer facades by means of a 30 mm tick mortar coating reinforced with glass-fiber polymer meshes and in introducing transversal connectors injected in the masonry. The mode shapes and natural vibrating frequencies were analyzed and compared, evidencing the effects of damage and of retrofitting. A finite element numerical model was developed, to perform eigenvalue analysis and calibrate the equivalent masonry stiffness for the different configurations.
Highlights
- Stone masonry building subjected to lateral cyclic loading
- 4 configurations analysed: unstrengthened and retrofitted, both undamaged and damaged
- Retrofitting by means of Composite Reinforced Mortar and transversal connectors
- Experimental dynamic characterization
- Calibration of a numerical model (eigenvalue analysis)
- Experimental-numerical comparison in terms of natural frequencies and mode shapes
1. Introduction
The dynamic identification, combined with suitably calibrated numerical models, is a useful tool to investigate on the integrity status of a structure [1]-[3]. A correct interpretation of the results requires a deep knowledge on the effects that damage and, eventually, consolidation interventions, may have on the response, in terms of modification of natural frequencies and mode shapes. With this aim, a full-scale stone masonry building is analyzed in the paper, carrying out a non-destructive vibrational tests under different known conditions. This research was recently carried out as part of the Interreg Italia-Slovenija Project “CONSTRAIN” [3], concerning the study of innovative strategies for the seismic protection of existing masonry buildings by the targeted use of fiber-reinforced composite materials. The main experimental tests concerned a full-scale quasi-static cyclic tests on a pilot building [4]. The experimentation was subdivided into two stages: test on the unstrengthened masonry configuration (till achieving a damage level close to the ultimate limit state) and test on the CRM retrofitted configuration (up to near-collapse). The CRM (Composite Reinforced Mortar) system consisted of a mortar coating reinforced with Glass Fiber Reinforced Polymer (GFRP) meshes, applied on the building external facades, and injected GFRP and steel transverse connectors. During this ambitious research, the dynamic characterization of the structure in four different configurations was also carried out: unstrengthened building (URM), before (-U) and after testing (-D), and retrofitted building (CRM), before (-U) and after testing (-D). It was thus possible to evaluate how damage and retrofitting intervention affected the performances in terms of natural frequencies and mode shapes.
2. Building configurations
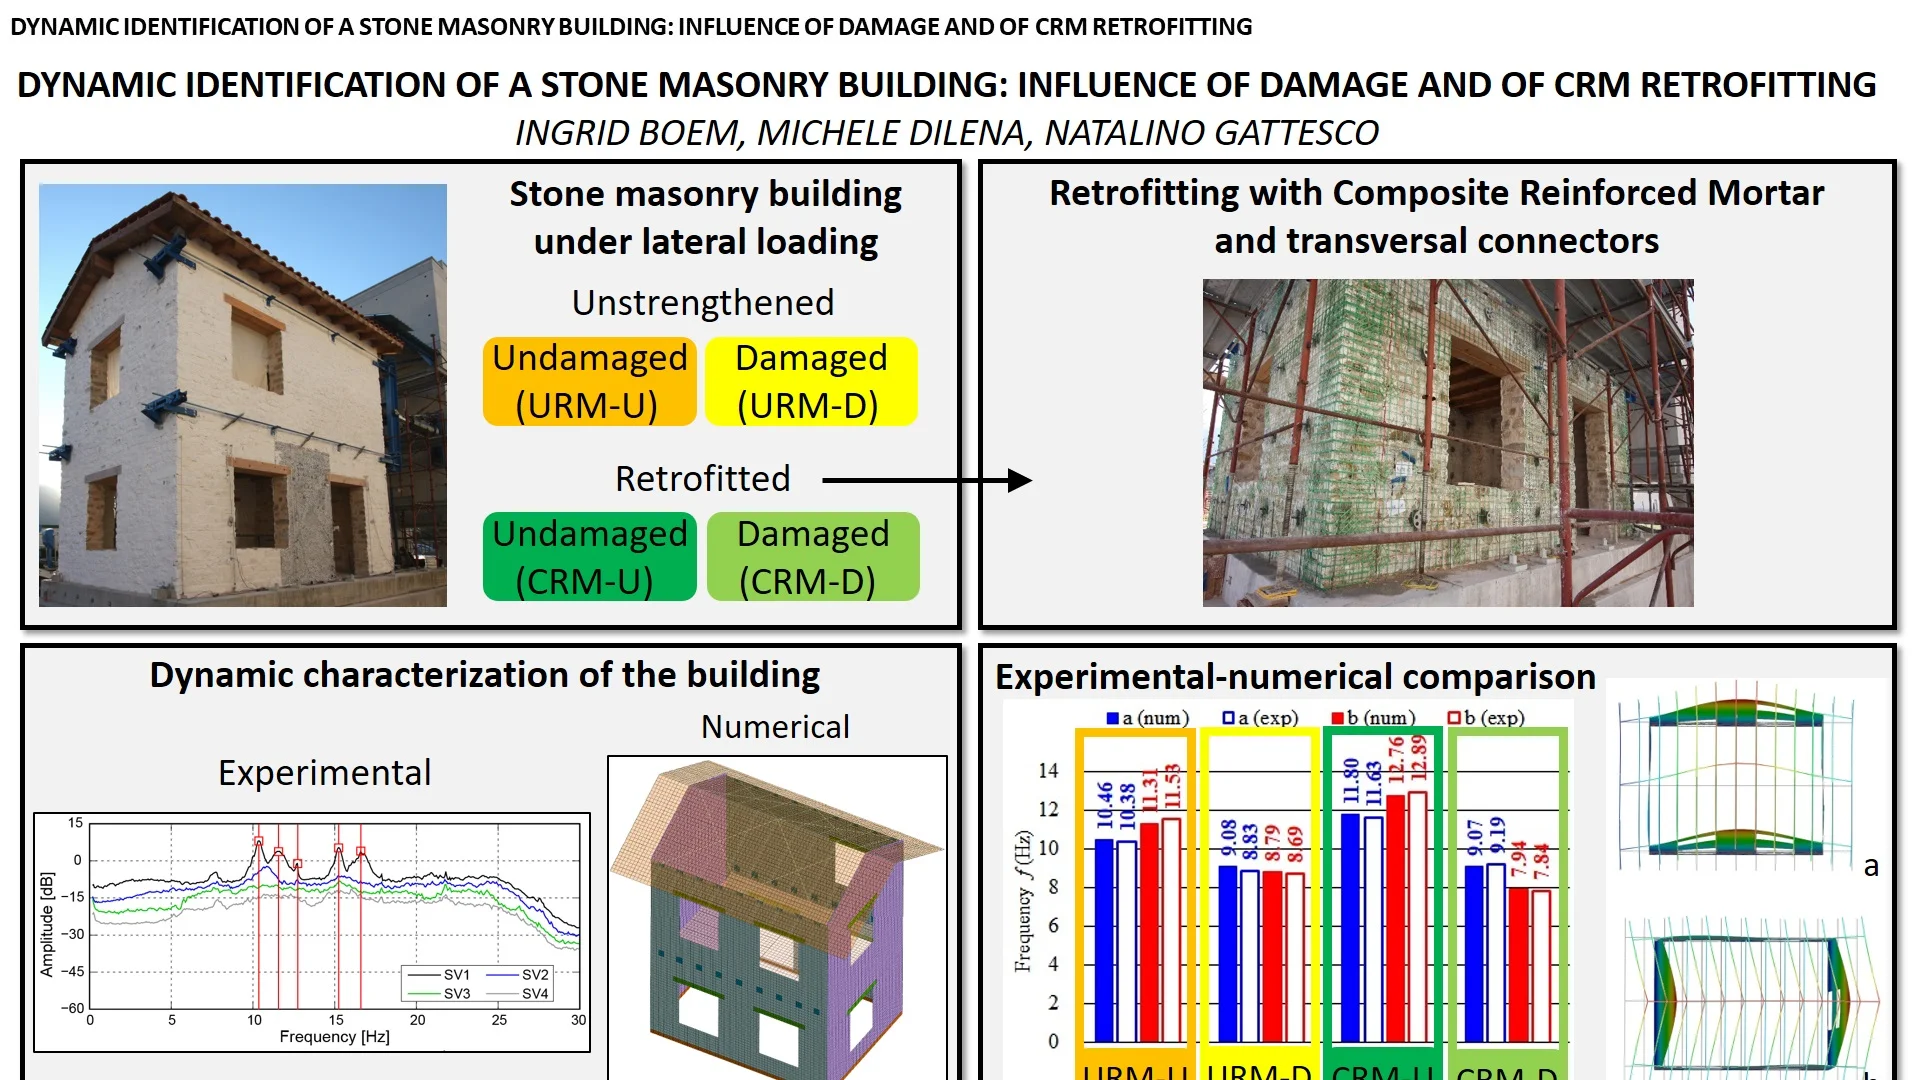
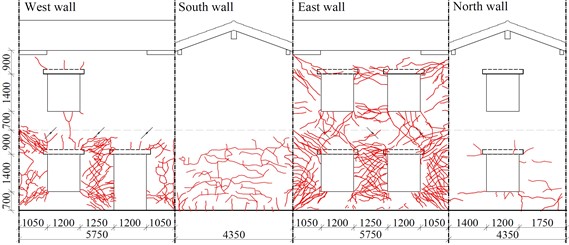
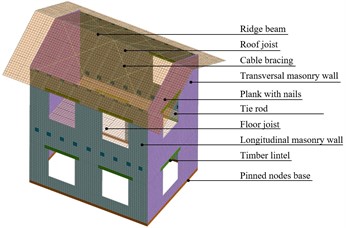
The pilot building, illustrated in Fig. 1(a), had two storeys (floor height 3000 mm) and consisted of four masonry bearing walls, with door and window openings, assembled in a rectangular plan 5750×4350 mm2. The walls were made of 350 mm thick rubble stone masonry laid in a double-leaf configuration. The sandstone units (approximate compressive strength 150-170 MPa) were assembled with 10 mm mortar joints filled with a lime-based mortar (hydraulic lime to sand ratio of 1:7 by mass, average compressive strength 1.5 MPa). The masonry average compressive strength and Young’s modulus, assessed by means of monotonic compression tests, were 2.5 MPa and 1074 MPa, respectively; the specific weight was about 21 kN/m3. The first row of stones was firmly connected with dowels to the RC foundation of the testing laboratory, to prevent potential sliding at the masonry-concrete interface. The intermediate floor consisted of nine 120×160 mm2 solid timber joists; the pitched roof of thirteen pairs of 100×140 mm2 solid timber joists, laid on the longitudinal walls and connected to the 200×320 mm2 solid timber ridge. 25 mm thick timber boards nailed on the joists covered both levels. Additional overloads simulated the typical combination of vertical loads for seismic conditions: 3.4 kN/m2 and 1.4 kN/m2, at intermediate floor and roof, respectively. Pairs of solid timber lintels (170×170 mm2) laid above each opening.
During the quasi-static cyclic tests, horizontal forces pushed the two longitudinal walls at the floor and roof levels, in correspondence of the gable walls, with increasing horizontal displacement amplitude.
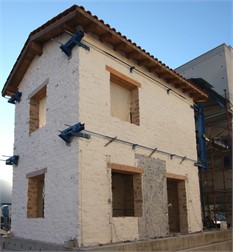
The most significant cracks in URM-D developed in the longitudinal walls and were due to in-plane mechanisms the piers and the intermediate spandrels (Fig. 1(b)). The transversal walls exhibited just some thin cracks, mostly localized around the loading points. Thin cracks also opened inside the building, along the walls’ intersections, evidencing a slight separation between orthogonal walls.
Fig. 1The experimental test on the pilot building, unstrengthened configuration
a) Global view
b) Crack pattern of URM-D
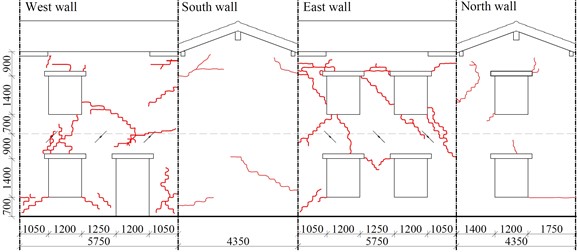
After testing the unstrengthened building, the structure was repaired by injecting the cracks with low-viscosity cementitious mortar, to a depth of 50 mm. Then, a layer of CRM coating (nominal thickness 30 mm) was applied on the outer surface of the perimeter walls – Fig. 2(a). A natural hydraulic lime mortar was used for the coating (compressive strength 13 MPa, Young’s modulus 10 GPa, indirect tensile strength 1.7 MPa, specific weight 18 kN/m3). The GFRP meshes had a 66×66 mm2 grid dimension (average strength 83.3 kN/m, axial stiffness 4303 kN/m).
The CRM coating was anchored to the walls by GFRP L-shaped connectors (cross section 7×10 mm2, 24/m2, injected in Ø16 drilled holes) and steel connectors (Ø16 stainless steel threaded bar with end washer, 2/m2, injected in Ø50 drilled holes). The CRM coating was anchored to the foundation by Ø8 stainless steel threaded bars (3/m). Four steel tie rods (Ø22) were installed along the internal surface of the perimeter walls, below the intermediate floor joists. At the roof level, eight tightened steel cable bracings (Ø8) were installed on the timber rafters, in a “cross” configuration.
Due to the loading direction, the most significant cracks in CRM-D developed in the longitudinal walls (Fig. 2(b)), involving widely both the coating and the masonry, with a greater concentration in the ground floor piers. The GFRP mesh prevented the formation of isolated thick cracks, instead promoting a wider diffusion of many closely-spaced thin cracks. Moreover, transverse connectors prevented leaves separation. The CRM coating also promoted the activation of a “box behaviour” of the building, including also some thin cracks in the transversal walls.
Fig. 2The experimental test on the pilot building, CRM retrofitted configuration
a) Detail during retrofitting
b) Crack pattern of CRM-D
3. Instrumental layout and test procedure
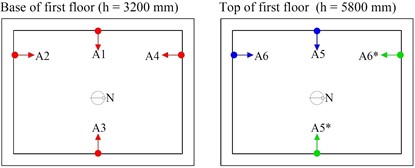
The instrumentation for the dynamic characterization consisted of six single-axis accelerometers and the layout was based on two setups. In Setup 1, four accelerometers (A1 to A4) were located at the base of the first-floor walls, one for each wall, and two at the top (A5, A6), while in Setup 2 the accelerometers were moved from positions (A5-A6) to (A5*-A6*), see Fig. 3(a). The components of the accelerations in the transversal direction of each wall of the building were recorded for 40 minutes, with a sampling rate of 300 Hz, on the base of environmental excitation (operational modal analysis). Subsequently, the time histories were decimated by a factor of 5, in order to reduce the frequency range from 0 to 30 Hz, suitable for the characterisation of the first vibration modes of the building.
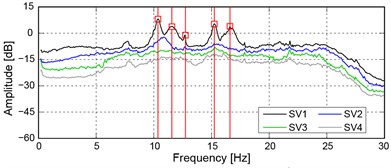
Natural frequencies and corresponding mode shape were estimated by means of the enhanced frequency domain decomposition (EFDD) technique [6], implemented in the software ARTeMIS Modal [7].
Fig. 3Dynamic characterization of the pilot building
a) Setup
b) Singular values of the spectral density matrix
4. Experimental results
Despite the small level of the excitation (wind blowing at a low intensity) and the relatively high stiffness of the building, at least the first four or five frequencies (Table 1) and the associated modes shapes were identified in each configuration.
As an example, Fig. 3(b) shows the singular values of the spectral matrices of all data sets in the URM-U configuration. In spite of the small amplitude of the environmental excitation, the peaks of the singular values associated to the first lower vibration modes are clearly detectable.
In URM-U, Mode 1 was translational in the transversal direction and Mode 2 in the longitudinal one; Mode 3 was rotational about a vertical axis; Mode 4 described longitudinal walls oscillating out of plane in phase opposition; in Mode 5 the longitudinal walls oscillated out of plane with floors in phase opposition. In URM-D, the fundamental vibrating modes inversed: first mode was translational in the longitudinal direction and second mode in the transversal one. Actually, the respective mode frequency decreased of 24.6 % (longitudinal) and 14.9 % (transversal). Mode 3 was not detected; also, Modes 4 and 5 detected vibration shapes similar to those of the undamaged configuration.
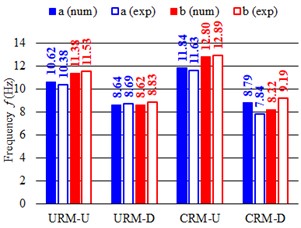
In CRM-U, the mode shapes 1 to 4 were qualitatively those of URM-U, but with slightly higher frequencies (at most 12 %). Thus, the retrofitting intervention restored, approximately, the original dynamic response of the structure and slightly increased the stiffness of the masonry walls. Mode 5 could not be identified. In CRM-D, the fundamental vibrating mode inversed in respect to CRM-U. As for the URM configurations, the frequency decrease was evident for both longitudinal (39.2 %) and transversal direction (21.0 %). Actually, in both URM and CRM configurations, the frequency decrease of the fundamental vibrating modes resulted higher in the longitudinal direction, in respect to the transversal one, coherently with the higher damage occurred in the longitudinal walls. Also, the frequency decrease induced by damage resulted higher in the CRM configuration, in respect to URM, consistently with the more advanced limit state attained in the lateral cyclic loading test.
Table 1Experimental frequencies [Hz] for all the building configurations and relative variations ∆ % with respect to URM-U configuration. Remark: in the damages states the order of Modes 1 and 2 is reversed
Mode | URM-U | URM-D | CRM-U | CRM-D | |||
[Hz] | [Hz] | % | [Hz] | % | [Hz] | % | |
1 | 10.38 | 8.83 | 14.9 % | 11.63 | –12.0 % | 9.19 | 11.5 % |
2 | 11.53 | 8.69 | 24.6 % | 12.89 | –11.8 % | 7.84 | 32.0 % |
3 | 12.52 | (–) | 13.38 | –6.9 % | 11.52 | 8.0 % | |
4 | 15.26 | 13.20 | 13.4 % | 14.77 | 3.2 % | 13.74 | 9.9 % |
5 | 16.68 | 14.13 | 15.3 % | (–) | 15.77 | 5.4 % | |
5. Analysis and comparisons
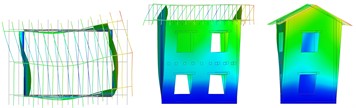
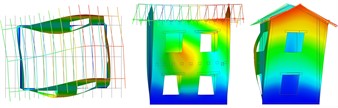
A finite element numerical model was developed with the software FEA NX 2020 (v.1.1) [8], to perform eigenvalue analysis for the different configurations (Fig. 4(a)). The model was composed of 4-nodes shell elements (average mesh size 87.5 mm), representing the masonry walls and the timber lintels, and beam elements, representing the timber joists and the ridge beam. 4-nodes shell elements were also used to represent the floor and roof planks, connected to the timber beams by means of elastic links in correspondence of the nails. Tie rods and cable bracings were introduced by using truss elements. The materials were assumed isotropic and elastic. All the nodes at the base of the building were pinned. The masonry self-weight was considered; moreover, the floor loads were introduced as line loads applied on the joists. The “load-to-masses” option was selected to activate the translational and rotational masses associated to all the applied loads. The total mass of the building resulted of 90×103 kg for URM configurations and of 96×103 kg for CRM configurations. The effective translational modal mass resulted of 73×103 and 79×103 kg, respectively.
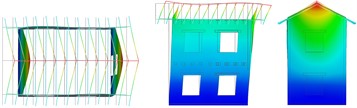
The numerical results are summarised in Table 2 for the different configurations, in terms of frequency and percentage of participant mass; the mode shapes are also indicated, with reference to the pictures in Fig. 5. The first simulation, concerning URM-U, was used to calibrate the Young’s modulus of the undamaged masonry and the equivalent shear stiffness of the planks-joist connections, by fitting experimental frequencies. Considering the small level of excitation of the building, it was expected to set a higher value of masonry Young’s modulus, in respect to the experimental one, which was evaluated as secant value within the range 10-40 % of the masonry compressive strength. In fact, the value was set equal to 3010 MPa, thus about 2.8 times the experimental one. The equivalent shear stiffness of the elastic links, calibrated equal to 1000 N/mm, accounted for friction among planks and with the joist and contact with the masonry walls at low excitation levels. The model results reliable: the frequencies and the mode shapes related to the first two translational modes in the transversal and longitudinal direction (a, b in Fig. 5) are in accordance with the experimental outcomes (1, 2). Moreover, Mode “c” and “e” resulted rotational about the vertical axes, and Mode “d”, with longitudinal walls oscillating out-of-plane in phase opposition, corresponded to the experimental Mode “4”. The fundamental modes “a” and “b” activated 57 % and 65 % of the effective translational modal mass, respectively, and mode “e” almost 60 % of the effective rotational modal mass around the vertical axes.
Fig. 4Numerical eigenvalue analysis of the pilot building
a) 3d numerical model overview
b) Comparison with the experimental results
Table 2Eigenvalue analysis results (frequency, percentage of participant mass and mode shape)
URM-U | URM-D | ||||||||||||||
(Hz) | Shape | (Hz) | Shape | ||||||||||||
10.62 | 0.0 % | 56.5 % | 0.0 % | 14.1 % | 0.0 % | 0.7 % | a | 8.62 | 71.0 % | 0.4 % | 0.0 % | 0.1 % | 12.2 % | 0.0 % | b |
11.38 | 64.5 % | 0.0 % | 0.0 % | 0.0 % | 14.6 % | 0.0 % | b | 8.64 | 0.5 % | 49.7 % | 0.0 % | 12.2 % | 0.1 % | 0.3 % | a |
13.37 | 0.0 % | 0.3 % | 0.0 % | 0.1 % | 0.0 % | 3.9 % | c | 10.77 | 0.0 % | 0.0 % | 0.0 % | 0.0 % | 0.0 % | 0.2 % | c |
15.20 | 0.0 % | 0.1 % | 0.0 % | 0.0 % | 0.0 % | 0.0 % | d | 12.62 | 0.0 % | 0.1 % | 0.0 % | 0.0 % | 0.0 % | 0.5 % | d |
18.53 | 0.9 % | 0.6 % | 0.0 % | 0.4 % | 0.2 % | 59.5 % | e | 14.62 | 0.1 % | 0.1 % | 0.0 % | 5.4 % | 0.1 % | 44.7 % | f |
CRM-U | CRM-D | ||||||||||||||
(Hz) | Shape | (Hz) | Shape | ||||||||||||
11.84 | 0.0 % | 59.3 % | 0.0 % | 14.3 % | 0.0 % | 0.8 % | a | 8.22 | 75.4 % | 0.0 % | 0.0 % | 0.0 % | 10.8 % | 0.0 % | b |
12.80 | 70.0 % | 0.0 % | 0.0 % | 0.0 % | 13.8 % | 0.0 % | b | 8.79 | 0.0 % | 50.8 % | 0.0 % | 9.6 % | 0.0 % | 0.4 % | a |
15.38 | 0.0 % | 0.3 % | 0.0 % | 0.1 % | 0.0 % | 4.4 % | c | 11.30 | 0.0 % | 0.0 % | 0.0 % | 0.0 % | 0.0 % | 6.7 % | c |
17.02 | 0.0 % | 0.1 % | 0.0 % | 0.0 % | 0.0 % | 0.0 % | d | 13.03 | 0.0 % | 0.0 % | 0.0 % | 0.1 % | 0.0 % | 1.3 % | d |
20.28 | 0.1 % | 0.1 % | 0.0 % | 0.3 % | 0.1 % | 63.8 % | e | 13.93 | 0.0 % | 1.0 % | 0.0 % | 16.8 % | 0.0 % | 5.4 % | f |
Fig. 5Vibrating mode shapes (plan, lateral and frontal views)
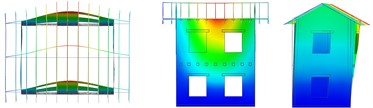
a) Translational –
b) Translational –
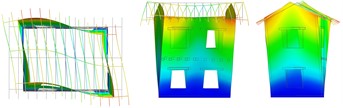
c) Rotational –
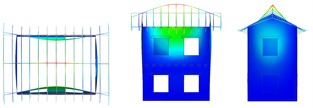
d) Long. walls out of plane in phase opposition
e) Rotational –
f) Long. walls out of plane, floors in phase opposition
Once the model was validated, the other three configurations were analyzed by means of parametric analysis, searching for the equivalent values of masonry Young’s modulus suitable to reproduce, in a simplified way, the effects of damage and CRM retrofitting. In particular, the first two vibration frequencies obtained from the numerical simulations were compared to the experimental ones (Fig. 4(b)). Different Young’s moduli were assumed for the longitudinal () and of transversal walls () in damaged conditions. In fact, the experimental damage localized mainly in the longitudinal walls and affected limitedly the transversal ones (see Section 2). Accordingly, in this preliminary, simplified study, the value of Young’s modulus for the transversal walls was maintained constant when passing from -U to -D configurations. The floor stiffness was unvaried in the four configurations.
For URM-D, the optimum solution was found with 1260 MPa (~0.42 ) and 3010 MPa (= ); for CRM-U it was assumed 3870 MPa (~1.3 ) and for CRM-R 1050 MPa (= 0.27 ) and 3870 MPa (= ). Consistently with the experiments, damage induced a frequency reduction and the fundamental vibrating modes a and b switched passing from undamaged to damaged condition.
6. Conclusions
Experimental vibrational tests on a two-storey masonry building were performed under different known conditions: unstrengthened and CRM retrofitted masonry, under both undamaged and advanced damage configurations. The natural vibrating frequencies and respective mode shapes were determined and compared. Reasonably, the damage induced a decrease of the frequency values, the retrofitting intervention approximately restored the original conditions with also a slight stiffness increase. Also, damage induced an inversion of the two fundamental, translational modes, coherently with the damage affecting mainly one direction. The numerical study allowed to set up, by means of eigenvalue analysis, the masonry equivalent Young’s modulus representing the perturbed situation, in respect to the original one. In particular, the Young’s modulus was about 42 % the original, for unreinforced masonry damaged up to reaching the ultimate limit state, and about 130 % when the CRM retrofitting intervention was completed. Then, the equivalent Young’s modulus of the retrofitted masonry decreased of 73 % when near collapse conditions were attained.
References
-
S. Hassiotis and G. D. Jeong, “Assessment of structural damage from natural frequency measurements,” Computers and Structures, Vol. 49, No. 4, pp. 679–691, Nov. 1993, https://doi.org/10.1016/0045-7949(93)90071-k
-
G. Hearn and R. B. Testa, “Modal analysis for damage detection in structures,” Journal of Structural Engineering, Vol. 117, No. 10, pp. 3042–3063, Oct. 1991, https://doi.org/10.1061/(asce)0733-9445(1991)117:10(3042)
-
G. Lacanna, M. Betti, M. Ripepe, and G. Bartoli, “Dynamic identification as a tool to constrain numerical models for structural analysis of historical buildings,” Frontiers in Built Environment, Vol. 6, p. 496524, Apr. 2020, https://doi.org/10.3389/fbuil.2020.00040
-
“Sharing and application of innovative strategies for the seismic protection of masonry buildings,” CONSTRAIN, 2022.
-
N. Gattesco et al., “The experimental campaign and numerical simulations of the CONSTRAIN project 2022,” 2022.
-
R. Brincker, L. Zhang, and P. Andersen, “Modal identification of output-only systems using frequency domain decomposition,” Smart Materials and Structures, Vol. 10, No. 3, pp. 441–445, Jun. 2001, https://doi.org/10.1088/0964-1726/10/3/303
-
“Software ARTeMIS Modal, release 5.3.0.8.” Structural Vibration Solution A/S, 2018. http://www.svibs.com
-
“Software MIDAS FEA NX, release 2020 (v.1.1).” MIDAS Information Technology Co., Ltd., 2020. https://www.midasoft.com/bridge-library/civil/products/midasfeanx.
About this article

This work was supported by the project CONSTRAIN, funded by the Interreg Italy-Slovenia Cooperation Program 2014-2020.
The datasets generated during and/or analyzed during the current study are available from the corresponding author on reasonable request.
The authors declare that they have no conflict of interest.
