Abstract
The paper applies the commercial software ABAQUS to establish numerical models of an original single-storey building and a reinforced building, and conducts experimental test to verify correctness of the computation models. Damages and dynamic characteristics of two kinds of models under seismic effects are studied systematically. -direction acceleration amplitudes of the wall obviously exceeded those in direction. In the same horizontal direction, accelerations of the left wall obviously exceeded those of the right wall. Compared with the original model, the -direction acceleration amplitude is decreased by 15.4 %, and the -direction acceleration amplitude is decreased by 49 % in the left wall of the reinforced model. As for right wall of the reinforced model, the -direction acceleration amplitude is decreased by 30.4 %, and the -direction acceleration amplitude is decreased by 17.6 %. In the direction, the power amplification factors of the reinforced model were less than those of the original model, and the value was decreased by 30 % for the power amplification factors corresponding to 1.3 g. In the direction, the power amplification factors of the reinforce model were less than those of the original model under different seismic effects, wherein the value of the reinforced model was decreased by 33 % for the power amplification factors corresponding to 1.3 g compared with the original model. Under the seismic effect of 0.1 g, damages took place to four wall bodies of the model at earliest, but its value was small. With increased seismic input excitation, damage degree of the wall bodies was also gradually increased. Under the seismic effect of 0.8 g, damages to four wall bodies were serious. Under seismic effect of 1.3 g, damage values of 4 wall bodies reached the maximum value 0.99, and the single-storey building will fail. Damages values of four wall bodies of the original model were relatively concentrated; while damage values of four wall bodies of the reinforced model were disperse. Under each seismic effect, the overall damage value was smaller than that of the reinforced model. This result fully indicates that reinforcement can reduce damages of wall bodies and generate anti-seismic effects.
1. Introduction
With rapid development of the economic society, especially the acceleration of urbanization and the improvement of farmers’ living standards, the rural building market also develops very actively. Meanwhile, quality problems of rural buildings also become more and more prominent. Most building structures of dwellings do not have normative design. Problems concerning structures, seismic resistance, safety and so forth are not valued. Once an earthquake takes place, anti-seismic performance of structures could hardly be guaranteed, while people’s life safety and properties cannot be ensured [1-4]. Aiming at defects concerning seismic resistance of a lot of single-storey solid brick wall houses existing in rural areas, simple and economic anti-seismic reinforcement measures are proposed. It is one of the effective approaches to improve comprehensive anti-seismic capacity of this type of houses, so as to guarantee safety of house structures under continuous strong seismic and recover use functions of houses as soon as possible [5-8].
At present, most researches on anti-seismic performance of buildings are achieved through shaking table test based on scaled-down models [9-14]. In order to obtain damage levels of house structures in related areas after earthquakes, Zhou [15] proposed a rational anti-seismic reinforcement method for damaged houses and conducted seismic damage survey and analysis, finding that main seismic damage forms of houses with a reinforced concrete structure in seismic areas included pillar crushing, node failure and enclosure wall damage, etc. In order to improve anti-seismic and damping capacities of rural houses, Cao [16] proposed a novel masonry building with a base sliding seismic isolation structure; through experimental test, the working mechanism of the base sliding seismic isolation structure was studied, and anti-collapse capacity and wall body damage processes of the anti-seismic structure were analyzed. Lv [17] conducted shaking table test to a wood frame building under 67 working conditions, wherein studied parameters including door opening width changes, and structural planar layout asymmetry were considered. Zheng [18] established a 1/6 scale model of a multi-storey building, conducted seismic shaking table test and analyzed dynamic performance of the structure under horizontal seismic effects as well as dynamic performance changing rules of the structure at different force stages. Liu [19] conducted the shaking table test on a 1/30 scale model in order to confirm seismic isolation effects and damage failure mechanism of building structures, and conducted test and comparison of dynamic characteristics of seismic-isolation and non-seismic isolation model structures. However, buildings studied in shaking table test are basically the scaled-down structures, so dynamic characteristics of real structures under seismic effects cannot be reflected completely. In addition, with the increased seismic shaking tables, more and more people begin paying attention to vibration effects of surrounding buildings and fields. In particular, vibration effects draw more attention when there are finishing workshops and precise instructions around shaking tables.
Therefore, it is very necessary to conduct numerical simulation of dynamic characteristics of buildings under seismic effects using commercial software [20-23]. Sun [24] adopted the ANSYS finite element software to establish two different carbon fiber reinforcement models for a reinforced building made of carbon fiber composite materials, so as to study anti-seismic performance of the reinforced building. Based on the ABAQUS software, Ge [25] conducted numerical simulation for a full-size model of a reinforced building, wherein the studied results show that reinforcement effects were good, and seismic responses of the building could be greatly decreased after reinforcement. Ma [26] established a non-linear finite element analysis model of a building under seismic effects, wherein studied results show that the numerical model could effectively simulate damage processes of the building, and weak parts in the structure were found. However, numerical model of the building did not have very high accuracy, and correctness of the model was not verified using experimental test. In addition, the simulation results were not analyzed systematically.
Building models in the above basically have a multi-storey structure. Analysis on anti-seismic characteristics of a single-storey building widely applied in towns is rarely reported. Aiming at the mentioned defects, the paper applies the commercial software ABAQUS to establish numerical models of an original single-storey model and a reinforced model, and conducts experimental test to verify correctness of the computation models. In addition, the paper systematically researches damages of two kinds of models under seismic effects.
2. Establishment and modal computation of original model
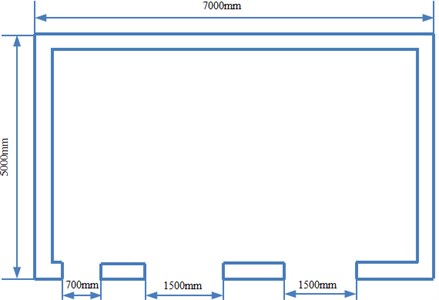
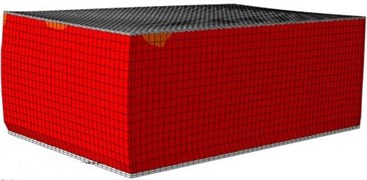
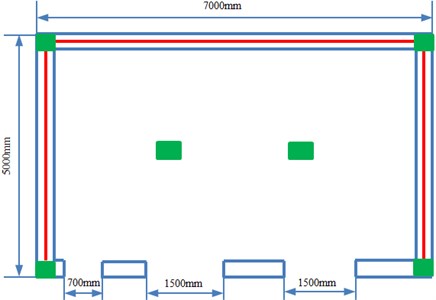
Researches on multi-storey models have been reported extensively. Therefore, the paper studied single-storey buildings widely applied in towns. The studied model is a side house, as shown in Fig. 1. As for the front outer vertical wall, the door size is 700 mm×2400 mm; the size of window is 1500 mm×1800 mm; the sill height is 600 mm. As for the rear vertical outer wall, there is no window. There is no supporting pillar in the house. Wall thickness is 25 mm.
Fig. 1Related model dimensions of the single-storey building
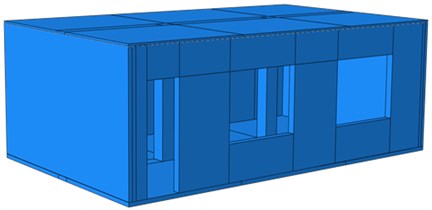
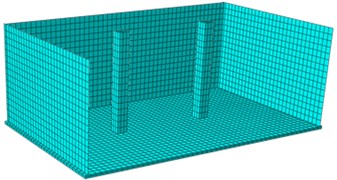
In order to verify correctness of the finite element model and based on many scholars’ attempts for the finite element model, the paper selects the ABAQUS software to establish the model because ABAQUS provides abundant functions for users, has very strong operability and can be used very conveniently. Even if the user encounters the most complicated problem, he only needs to provide structural data such as shape characteristics, material attributes, boundary conditions and load working conditions in order to establish the model very easily. During computation and analysis of the software, the user needs not to define any parameter, while ABAQUS could automatically select proper load increments and convergence norms, and accurate solutions could be obtained through automatic adjustment of values of these parameters. The ratio of the ABAQUS finite element model of each test specimen to the experimental model was kept at 1:1, as shown in Fig. 2. Loading situations were kept consistent with experimental situations in Section 3.2. Boundary constraints were applied to ground beams under seismic effects, so the fixed bearing could be simulated. Coupling reference points were set at the top beam, so displacement loads applied by an actuator to the wall body could be simulated. How to select elements rationally has obvious effects on computational efficiency and result accuracy of finite element analysis. Therefore, it is very necessary to apply fine meshes and rational element type in order to ensure enough accuracy of ABAQUS simulation results. The rough meshes could not ensure accuracy of analyzed results. If meshes are divided too finely, the computer resources needed by model running would be increase, leading to very high cost.
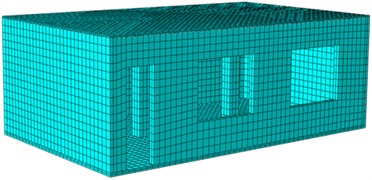
Fig. 2Geometric model and finite element model of the single-storey building
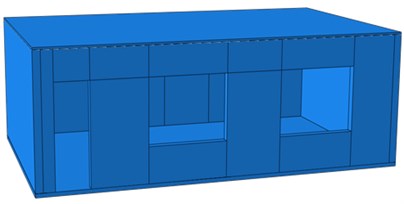
a) Geometric model
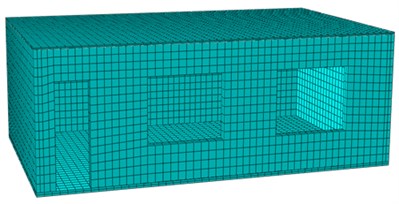
b) Finite element model
Therefore, it is very important to master proper ABAQUS mesh division technologies. C3D8R solid elements were applied to the established models. Tie constraints were applied for connection between different components. Damage analysis was only conducted to the wall body. Fine meshes of 65 mm were adapted to the building model; rough meshes of 200 mm were adapted to the wood materials. In the model, the loading beam and the fixed bearing could be deemed as rigid bodies with infinite rigidity. Relative sliding between reinforced bars and concrete was neglected. Embedded constraints were adopted for contact between reinforced bars and concrete.
In parameter definition of ABAQUS software, except for parameters of the concrete loss plastic model, elastic parameters of the material should be also defined. Concrete parameters are as follows: density is 2500 kg/m3, elasticity modulus is 3e4 N/mm2; Poisson’s ratio is 0.2. Reinforced bar parameters are as follows: density is 7800 kg/m3, elasticity modulus is 2e5 N/mm2; Poisson’s ratio is 0.3.
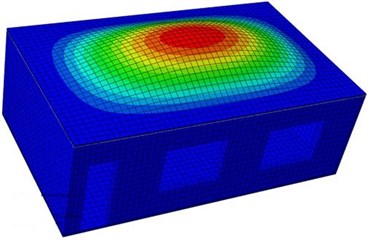
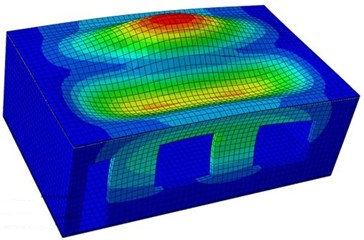
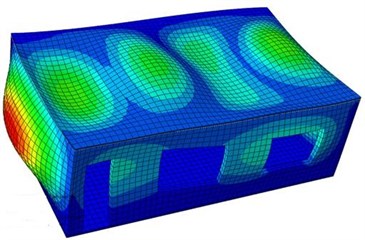
In modal analysis, only density, elasticity modulus, Poisson’s ratio and constraint conditions have effects on the computational results, while loads do not affect analyzed results. In modal computation analysis of the model, constraints between structural pillars and wall bodies are constructed. Considering the reinforced bar between structural pillars and wall bodies in actual structures, it is assumed that deformation between structural pillars and wall bodies is coupled, and pull constraint effects of reinforced bars on wall bodies in the actual structure are replaced by coupling constraints. After material parameters and constraint conditions are set, constraint modals of the single-storey building are computed. Results are shown in Fig. 3. It is shown in the figure that vibration shapes of the single-storey building presented an obvious symmetry, and longitudinal wave nodes and horizontal wave nodes appeared alternatively. The bottom of the single-storey building is fixed and constrained, so no deformation is shown in the modal shapes.
Fig. 3Vibration shapes of the single-storey building at top 6 orders
a) First order
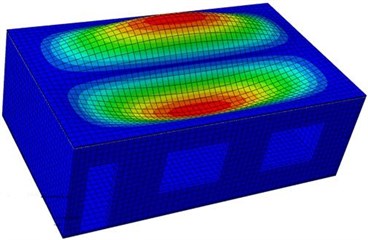
b) Second order
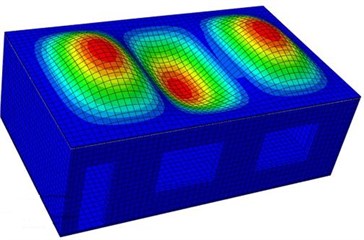
c) Third order
d) Fourth order
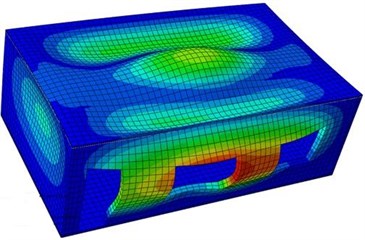
e) Fifth order
f) Sixth order
3. Analysis on dynamic and damage characteristics of original model
3.1. Analysis on dynamic characteristics of original model
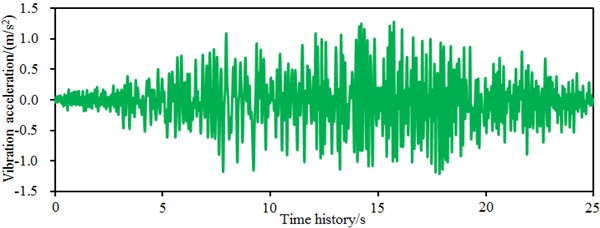
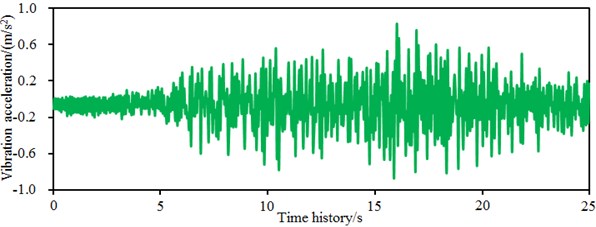
The paper only studies dynamic characteristics of the building in the horizontal direction, so only seismic waves in and directions need to be input. The Wolong wave in Wenchuan earthquake is tested by site experiments and has been widely used as a standard seismic wave [27-29]. It is not obtained by the artificial simulation, and its correctness does not need to be further validated by experiments. In this paper, only part of the Wolong wave is intercepted to be adjusted as the input seismic wave. Fig. 4 and Fig. 5 showed time-domain and frequency-domain spectrums of seismic waves in the two directions.
Fig. 4Time-domain seismic waves in two directions
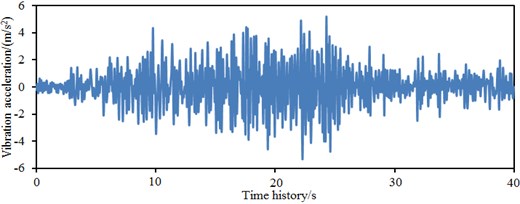
a) Seismic waves in direction
b) Seismic waves in direction
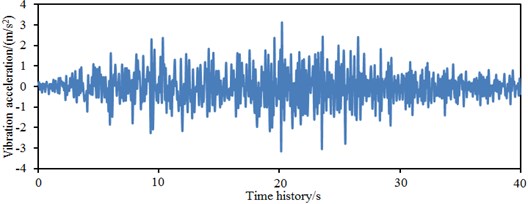
It is shown in Fig. 4 that the amplitude of time-domain accelerations in -direction obviously exceeded that in direction. Within 10 s-30 s, the acceleration amplitude of seismic waves is big. It is shown in Fig. 5 that frequency spectrum amplitudes of seismic waves are mainly distributed within 0-10 Hz. When the frequency is more than 10 Hz, the frequency spectrum amplitudes of the seismic waves basically approached 0. Frequency-domain amplitudes in -direction obviously exceeded those in direction. Obviously, energy of the seismic waves is mainly concentrated in low frequency bands. In addition, it is shown in the frequency spectrums that amplitude frequencies in and directions are basically consistent. Building sites have been divided into four kinds of categories including Category I, II, III and IV. The Category III requires that the acceleration magnitude of the seismic wave is 0.15 g. In this paper, the acceleration magnitude of the seismic wave is within 0.15 g; therefore, the studied site is Category III.
Load module in ABAQUS is a very important link in the finite element model. In the module, a user can input load and boundary conditions to be borne by the model. In order to ensure that boundary conditions of the finite element analysis could be consistent with constraint situations in the experimental test, only seismic excitation in and directions are applied.
Input forms of seismic motion directly decide results of seismic response analysis, so it shall be selected carefully according to actual situations. The paper mainly focuses on three-dimensional analysis of seismic responses, there are many computation elements in the finite element model and the computation is slow. Therefore, in order to increase the computational speed, the paper adopts consistent input for seismic motion input. Application of consistent input has small effects on seismic response compared with multi-point input. Therefore, the seismic input form of the paper is set as follows: consistent input is selected for the seismic motion input, and the direction is horizontal. Seismic motions in two orthogonal horizontal directions are input in the paper. Seismic motion is input through date sheets.
Fig. 5Frequency-domain seismic waves in two directions
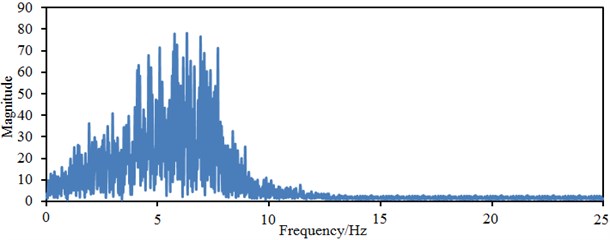
a) Seismic waves in direction
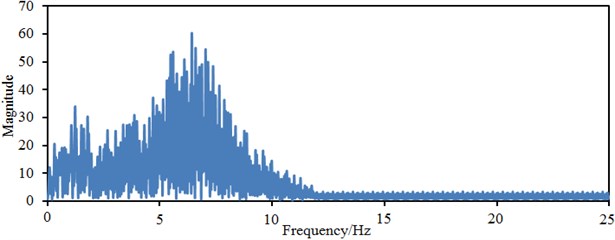
b) Seismic waves in direction
Fig. 6 shows the extracted time-domain acceleration curves in left and right walls of the single-storey building. Fig. 6(a) shows -direction accelerations of the left wall of the single-storey building. It is shown in the figure that the acceleration fluctuated around 0 with the maximum value of 1.3 m/s2, and obviously fluctuation sections of the acceleration curve were mainly concentrated within 5-20 s. Fig. 6(b) shows the -direction accelerations of the left wall of the single-storey building with the maximum value of 1.1 m/s2, and the obvious fluctuation sections of the acceleration curve were mainly concentrated within 7.5-22.5 s. In addition, amplitudes of -direction accelerations of the left wall obviously exceeded those of direction. Main vibration energy of seismic excitation loads was concentrated within 30 s. However, fluctuations of wall body accelerations were mainly concentrated within 22.5 s. The reason is that the seismic waves were greatly attenuated while being transmitted from the building bottom to tops of two walls, while the seismic waves were refracted and reflected for many times in the wall body, so that the final fluctuation scope was reduced. Similarly, Fig. 6(c) and Fig. 6(d) show two-directional accelerations of the right wall of the single-storey building. They fluctuated around 0. Obvious fluctuation sections of two directional accelerations were concentrated within 7.5-20 s, wherein the maximum acceleration in -direction was 1.15 m/s2and the maximum acceleration in -directional was 0.85 m/s2. Obviously, -directional accelerations obviously exceeded those in direction as amplitudes of -direction seismic waves also obviously exceeded those in direction. Through comparison of left and right wall bodies of the single-storey wall body, we can find that in the same direction, accelerations of left wall obviously exceeded those of right wall because the left wall is close to the door, the front vertical wall connected to it had low rigidity and its vibration was obvious.
Fig. 6Two-directional accelerations of the single-storey building walls
a)-direction acceleration of the left wall of the single-storey building
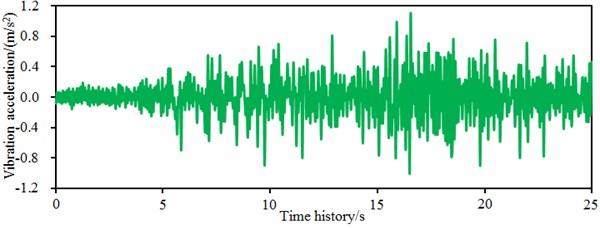
b)-direction acceleration of the left wall of the single-storey building
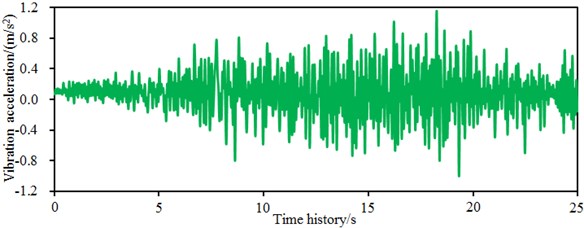
c)-direction acceleration of the right wall of the single-storey building
d)-direction acceleration of the right wall of the single-storey building
3.2. Experimental verification of original model
In order to verify correctness of the numerical computation model of the single-storey building, vibration accelerations of left and right walls were tested in experiments, as shown in Fig. 7. It is shown in the figure that many acceleration sensors were arranged on the left and right walls. Tested averages of each wall were taken as final results. The model adopted a brick concrete structure. The experiment was completed on a three-directional shaking table of 5×5 m, as shown in Fig. 8(a). As for the shaking table: maximum load borne is 25 t, the frequency ranges within 0.4-50 Hz, maximum displacement is 80 mm, and maximum acceleration is 1.5 g. In the experiment, acceleration sensors shown in Fig. 8(b) were used to measure accelerations of left and right walls of the model. The acceleration sensor has the advantages of small size, light weight, convenient use, high resolution ratio, large dynamic scope, etc. The experiment mainly investigated anti-seismic performance of the structure under horizontal seismic effects. Therefore, during design, similarity relations between normal section bending resistance and slope connection shear resistance of the lateral force resistance components were mainly considered; setting of reinforcing bars and steel framework was mainly converted based on equal intensity and equal rigidity; similarity relations of mass and loads were satisfied by additional mass. As for dimension determination of the model structure, the structural chassis should be limited in the table face of shaking table; the model center should approach the shaking table center as much as possible; the fixation bolt should avoid main components, so convenient construction for component combination and so forth could be conducted. The total weight of the model structure is smaller than the maximum allowable load bearing capacity of the shaking table. After input of the experimental testing data into the post-processing software, accelerations of the walls could be obtained and compared with numerical simulation results, as shown in Fig. 9.
Fig. 7Layout positions of acceleration sensors
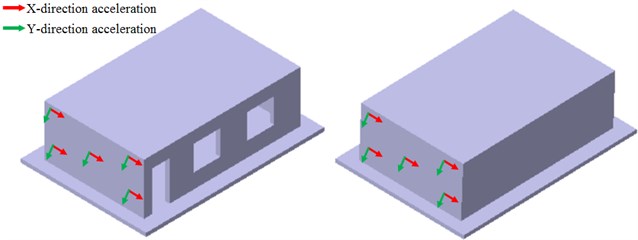
Fig. 8Acceleration testing equipment of the single-storey building
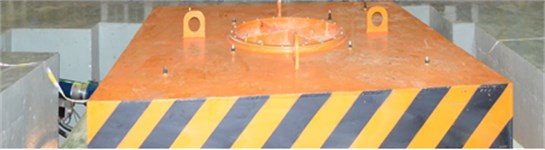
a) Shaking table

b) Acceleration sensor
It is shown in Fig. 9 that the order of magnitudes was kept consistent in experiments and numerical simulation of accelerations in each direction, while it was kept unchanged even for the fluctuation sections with obvious accelerations. In addition, experimental points coincided with the numerical simulation points at most peak points. At some time points, results of numerical simulation and experiment were not completely consistent. The reason is that the numerical simulation was obviously influenced by boundary conditions. Experimental model and numerical model of the single-storey building could not be kept consistent completely. However, aiming at requirements for errors in actual engineering, it is verified that the numerical computation model of the single-storey building established in the paper is still valid. It is reliable to use it to conduct a damage analysis and reinforcement for buildings.
3.3. Damage analysis on original model
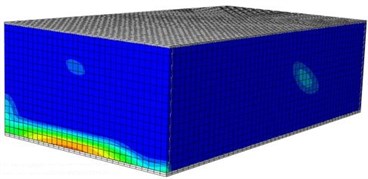
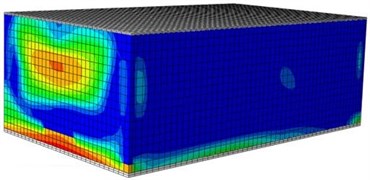
When a building bears seismic effects, wall bodies will be destroyed and damaged inevitably. Therefore, the paper studies damage processes of wall bodies under seismic waves based on the verified numerical computation model. In the mentioned researches, the maximum acceleration of the seismic waves was 5 m/s2, equivalent to 0.5 g. Fig. 10 shows a damage contour of the single-storey building under each input excitation. It is shown in the figure, under each working condition, the damage contour of the structural wall bodies in the model could be divided into three stages, namely elasticity stage, cracking stage and damage stage. Under input of 0.1 g, the model structure stayed at the elasticity stage, wherein no crack appeared, but slight damages appeared on left and right wall bodies. Under the input of 0.2 g, obvious damages appeared on the wall body, wherein obvious damages appeared on the left and right wall bodies. With increased input excitation, a lot of cracks began appearing on the wall bodies till the final collapse.
Fig. 9Comparison of accelerations between experiment and numerical simulation
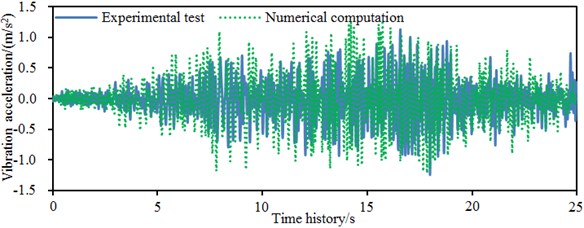
a)-direction acceleration of the left wall of the single-storey building
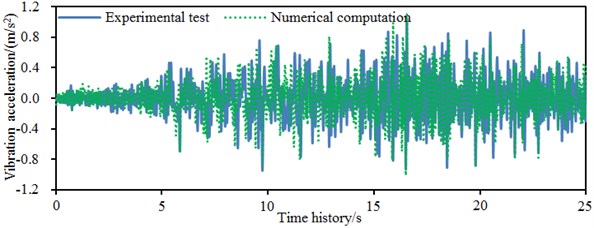
b)-direction acceleration of the left wall of the single-storey building
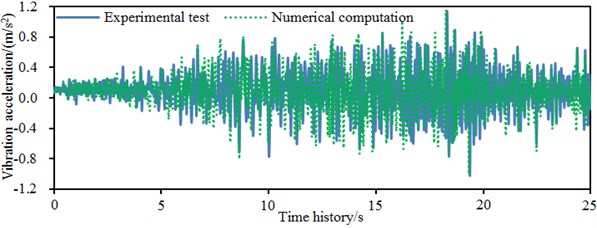
c)-direction acceleration of the right wall of the single-storey building
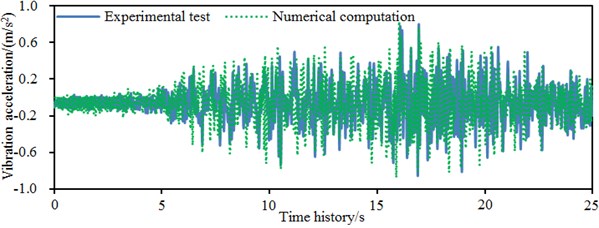
d)-direction acceleration of the right wall of the single-storey building
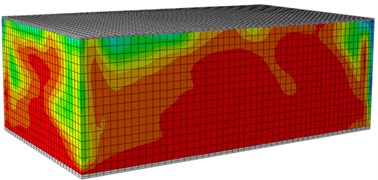
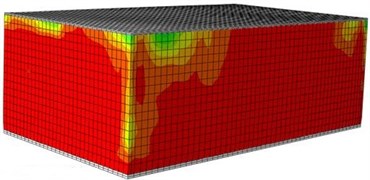
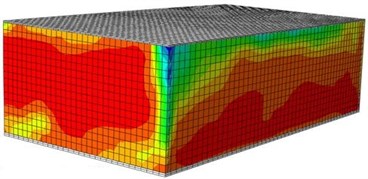
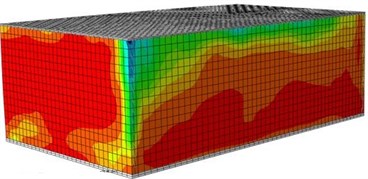
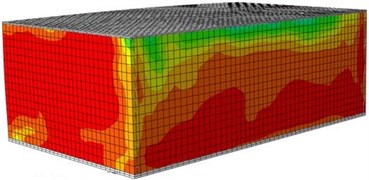
Fig. 10Damages of the single-layer building under different excitations
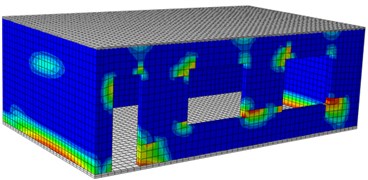
a) Front surface (0.1 g)
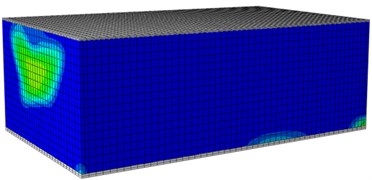
b) Rear surface (0.1 g)
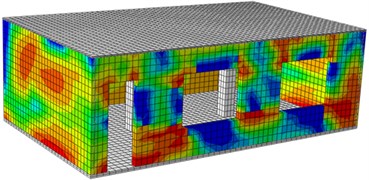
c) Front surface (0.2 g)
d) Rear surface (0.2 g)
e) Front surface (0.3 g)
f) Rear surface (0.3 g)
g) Front surface (0.5 g)
h) Rear surface (0.5 g)
i) Front surface (1.0 g)
j) Rear surface (1.0 g)
4. Analysis on dynamic and damage characteristics of reinforced model
4.1. Analysis on dynamic characteristics of reinforced model
Under seismic effects, serious damages would take place to buildings. Therefore, it is necessary to reinforce the original single-storey building model. Measures were conducted to the reinforced model aiming at anti-seismic problems of the original model: no connection measure was adopted between vertical and horizontal wall bodies of the house, wall bodies could easily incline outwards and collapse; connection between roof system nodes was weak, integral performance was poor, etc. As shown in Fig. 11(a), some reinforced bars were set at joints of horizontal and vertical wall bodies, left side wall, right side wall and rear vertical wall, and two supporting pillars were set in the building. A geometric model of the reinforced building was established according to a reinforcement proposal, as shown in Fig. 11(b). The finite element model of the reinforced building was further established, as shown in Fig. 12.
Fig. 11Geometric model of the reinforced model
a) Reinforcement measure
b) Reinforced geometric model
Fig. 12Finite element model of the reinforced model
a) Finite element model
b) Model with reinforced structure
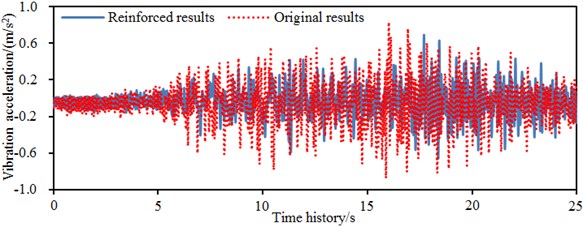
The same seismic excitation load was input into the reinforcement model to compute time-domain accelerations of left and right walls. Computational results were compared with the original model. Results are shown in Fig. 13. Fig. 13(a) shows comparison results of -direction accelerations of left wall of the building. It is shown in the figure that accelerations of two kinds of models fluctuated around 0; the maximum value of original model was 1.3 m/s2; the maximum acceleration of reinforced model was 1.1 m/s2; the acceleration amplitude decreased by 15.4 %; obvious fluctuation sections of the acceleration curve were mainly concentrated within 5-20 s. Fig. 13(b) shows -direction accelerations of the left wall of the building, wherein maximum value of the original model was 1.1 m/s2; maximum value of the reinforced model was 0.56 m/s2; the acceleration amplitude decreased by 49 %; and the obvious fluctuation sections of the acceleration curve were mainly concentrated within 7.5-22.5 s. In addition, the -direction acceleration amplitude of left wall of the reinforced model still exceeded that of -direction. Main vibration energy of seismic excitation loads was concentrated within 30 s.
Fig. 13Comparison of accelerations between the original and reinforced model
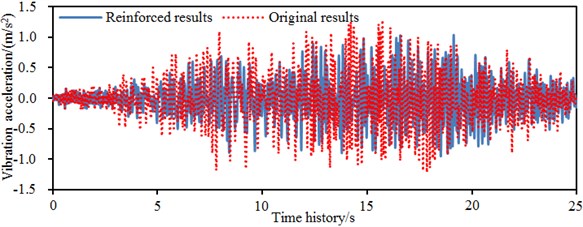
a)-direction acceleration of the left wall of the single-storey building
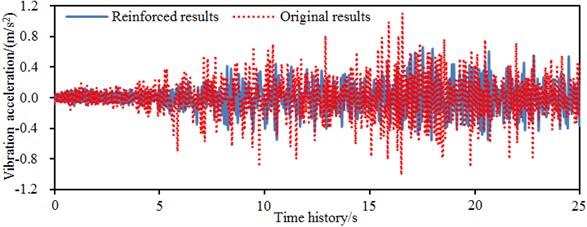
b)-direction acceleration of the left wall of the single-storey building
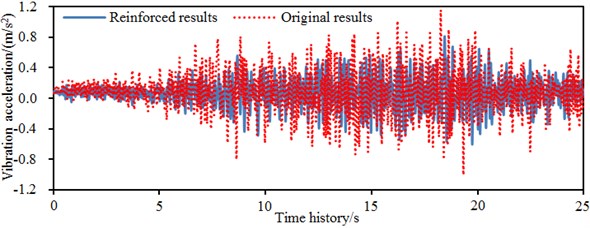
c)-direction acceleration of the right wall of the single-storey building
d)-direction acceleration of the right wall of the single-storey building
However, fluctuations of the wall accelerations were mainly concentrated within 22.5 s. The reason is that the seismic waves were already attenuated greatly while being transmitted from the building bottom layer to tops of two side walls; the seismic walls were refracted and reflected in the wall body for many times, and the final fluctuation scope was reduced. Similarly, Fig. 13(c) and Fig. 13(d) show two-directional accelerations of the right wall of the building. They fluctuated around 0 as well. Obvious fluctuation sections of -direction and -direction accelerations were concentrated within 7.5-20 s. The maximum -direction acceleration of the original model was 1.15 m/s2. The maximum acceleration of the reinforced model was 0.8 m/s2. The acceleration amplitude decreased by 30.4 %. The maximum -direction acceleration of the original model was 0.85 m/s2. The maximum acceleration of the reinforced model was 0.7 m/s2. The acceleration amplitude decreased by 17.6 %. Obviously, as for the reinforced model, accelerations in direction obviously exceeded those in direction as well as amplitudes of -direction seismic waves also exceeded those in direction. Through comparison between left and right side walls of the single-storey building, we can find that in the same horizontal direction, accelerations of the left wall obviously exceeded those of right wall because the left wall body was close to the door; the front vertical wall body connected to it had small rigidity; and vibration was obvious.
Under seismic waves, walls of the single-storey building would shake inevitably. Therefore, it is feasible to further analyze amplification effects of walls on seismic wave accelerations, as shown in Fig. 14. It is shown in the figure that after dual-way input of seismic waves, the model stayed at the elasticity stage when the excitation was small; the power amplitude factors of its acceleration were small and did not vary obviously; with increased seismic wave amplitudes, the power amplification factors also increased correspondingly; around 0.3-0.6 g, the -directional amplification factors reached the maximum value and then decreased. The peak of -directional amplification factors appeared at 1.0 g. Therefore, it can be confirmed that the original model and the reinforced model were damaged to different extents. In the direction, the power amplification factors of the reinforced model were less than those of the original model, and the value was decreased by 30 % for the power amplification factors corresponding to 1.3 g. In the direction, the power amplification factors of the reinforce model were less than those of the original model under different seismic effects, wherein the value of the reinforced model was decreased by 33 % for the power amplification factors corresponding to 1.3 g compared with the original model.
Fig. 14Two-directional acceleration amplitudes of wall bodies under different seismic amplitudes
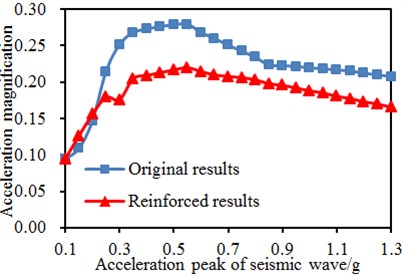
a)-direction acceleration amplitude
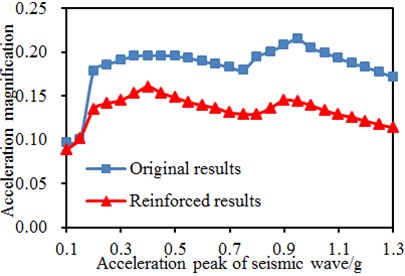
b)-direction acceleration amplitude
4.2. Analysis on damage characteristics of reinforced model
Pull damage is the damage form which could easily take place to a single-storey building. Easy-to-damage points in the ABAQUS simulation model and the original model were analyzed, so the curve concerning relations between pull damage peak and input seismic peak at each position was obtained, as shown in Fig. 15. Under the seismic effect of 0.1 g, damages took place to four wall bodies of the original model at earliest, but its value was small. With increased seismic input excitation, damage degree of the wall bodies was also gradually increased. Under the seismic effect of 0.8 g, damages to four wall bodies were serious. Under seismic effect of 1.3 g, damage values of 4 wall bodies reached the maximum value 0.99, and the single-storey building will fail. Under the seismic effect of 0.1 g, damage still took place to four wall bodies of the reinforced model at earliest, but its value was small. After that, with increased seismic input excitation, damages of the right wall increased sharply. When the seismic input excitation was lower than 0.8 g, damage of the four wall bodies of the reinforced model was smaller than that of the original model. Under the seismic effect of 1.3 g, the damage values of four wall bodies reached the maximum value of 0.99, and the building will fail. Damages values of four wall bodies of the original model were relatively concentrated; while damage values of four wall bodies of the reinforced model were disperse. Under each seismic effect, the overall damage value was smaller than that of the reinforced model. This result fully indicates that reinforcement can reduce damages of wall bodies and generate anti-seismic effects.
Fig. 15Damage comparison of two models under different seismic amplitudes
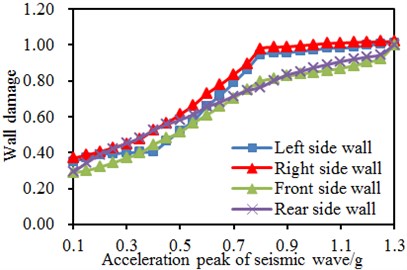
a) Original single-storey building model
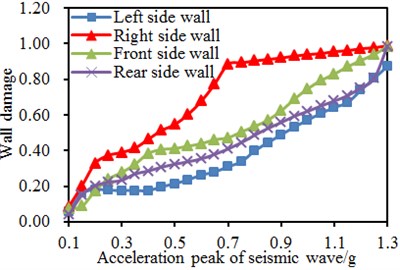
b) Reinforced single-storey building model
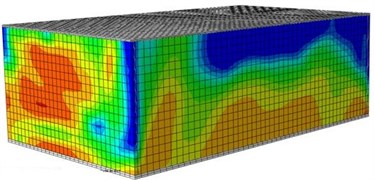
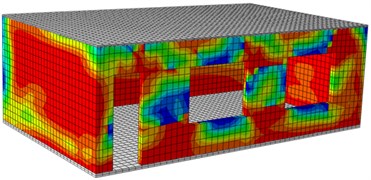
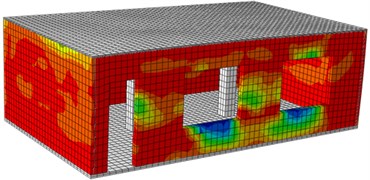
The following figures are damage contours of ABAQUS model simulation under each seismic input value. Through the following pull damage contours, damage positions of the building and damage degrees under each seismic effect could be known clearly. Fig. 16 shows the damage contours of the reinforced building under each seismic input value. It is show in the figure: under each working condition, the damage contour of the structural wall bodies in the model could be divided into three stages, namely elasticity stage, cracking stage and damage stage. Under 0.1 g input, the model structure stayed at the elasticity stage, and no crack appeared. However, it could be found that slight damage appeared on the left and right wall bodies. Under the 0.2 g input, obvious damage appeared on the wall bodies, but the damage was not so serious like the original model. With increased input excitation, a lot of cracks also appeared on the wall bodies till the final collapse.
5. Conclusions
1) Vibration shapes of the building presented obvious symmetry, while longitudinal wave nodes and horizontal wave nodes appeared alternatively. The -direction accelerations of the left wall of the building fluctuated around 0, wherein the maximum value was 1.3 m/s2; obvious fluctuation sections of the acceleration were mainly concentrated within 5-20 s. As for the -direction accelerations of the left wall, the maximum value was 1.1 m/s2; obvious fluctuation sections of the acceleration were mainly concentrated within 7.5-22.5 s. In addition, -direction acceleration amplitudes of the left wall obviously exceeded those in direction. Obvious fluctuation sections of two-directional accelerations of the right wall were concentrated within 7.5-20 s; the maximum -direction acceleration was 1.15 m/s2; and the maximum -direction acceleration was 0.85 m/s2. In the same horizontal direction, accelerations of the left wall obviously exceeded those of the right wall.
2) The order of magnitudes was kept consistent in experiments and numerical simulation of accelerations in each direction, while it was kept unchanged even for the fluctuation sections with obvious accelerations. In addition, experimental points coincided with the numerical simulation points at most peak points. It is verified that the numerical computation model of the single-storey building in the paper is still valid. It is reliable to use it to conduct damage analysis and reinforcement for buildings.
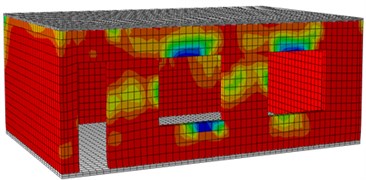
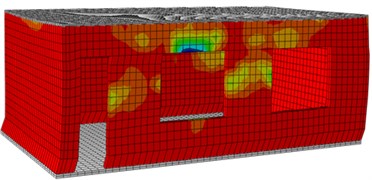
Fig. 16Damages of the reinforced building under different excitations
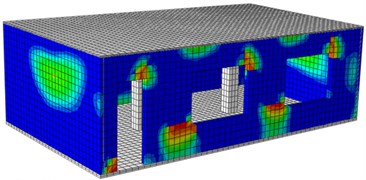
a) Front surface (0.1 g)
b) Rear surface (0.1 g)
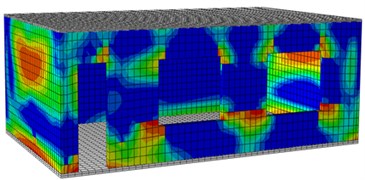
c) Front surface (0.2 g)
d) Rear surface (0.2 g)
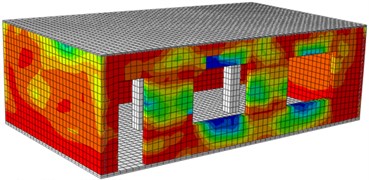
e) Front surface (0.3 g)
f) Rear surface (0.3 g)
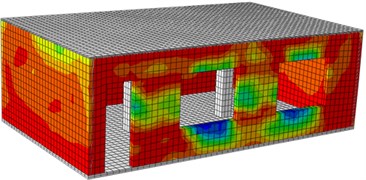
g) Front surface (0.6 g)
h) Rear surface (0.6 g)
i) Front surface (1.0 g)
j) Rear surface (1.0 g)
3) Under each working condition, damage of the wall bodies in the model could be divided into three stages, namely elasticity stage, cracking stage and damage stage. Under input of 0.1 g, the model structure stayed at the elasticity stage, wherein no crack appeared, but slight damages appeared on left and right wall bodies. Under the input of 0.2 g, obvious damages appeared on the wall body, wherein obvious damages appeared on the left and right wall bodies. With increased input excitation, a lot of cracks began appearing on the wall bodies till the final collapse.
4) As for the left wall of the reinforced model, the maximum -direction acceleration was 1.1 m/s2, while the amplitude decreased by 15.4 %; the maximum -direction acceleration was 0.56 m/s2, and the amplitude decreased by 49 %. As for right wall of the reinforced model, the maximum -direction acceleration was 0.8 m/s2, wherein the amplitude decreased by 30.4 %. The maximum -direction acceleration was 0.7 m/s2, and the amplitude decreased by 17.6 %.
5) The model stayed at the elasticity stage when the excitation was small; the power amplitude factors of its acceleration were small and did not vary obviously; with increased seismic wave amplitudes, the power amplification factors also increased correspondingly; around 0.3-0.6 g, the -directional amplification factors reached the maximum value and then decreased. The peak of -directional amplification factors appeared at 1.0 g. Therefore, it can be confirmed that the original model and the reinforced model were damaged to different extents. In the direction, the power amplification factors of the reinforced model were less than those of the original model, and the value was decreased by 30 % for the power amplification factors corresponding to 1.3 g. In the direction, the power amplification factors of the reinforce model were less than those of the original model under different seismic effects, wherein the value of the reinforced model was decreased by 33 % for the power amplification factors corresponding to 1.3 g compared with the original model.
6) Under the seismic effect of 0.1 g, damages took place to four wall bodies of the original model at earliest, but its value was small. With increased seismic input excitation, damage degree of the wall bodies was also gradually increased. Under the seismic effect of 0.8 g, damages to four wall bodies were serious. Under seismic effect of 1.3 g, damage values of 4 wall bodies reached the maximum value 0.99, and the single-storey building will fail. Under the seismic effect of 0.1 g, damage still took place to four wall bodies of the reinforced model at earliest, but its value was small. After that, with increased seismic input excitation, damages of the right wall increased sharply. When the seismic input excitation was lower than 0.8 g, damage of the four wall bodies of the reinforced model was smaller than that of the original model. Under the seismic effect of 1.3 g, the damage values of four wall bodies reached the maximum value of 0.99, and the building will fail. Damages values of four wall bodies of the original model were relatively concentrated; while damage values of four wall bodies of the reinforced model were disperse. Under each seismic effect, the overall damage value was smaller than that of the reinforced model. This result fully indicates that reinforcement can reduce damages of wall bodies and generate anti-seismic effects.
References
-
Masi A., Chiauzzi L., Santarsiero G., et al. Seismic damage recognition based on field survey and remote sensing: general remarks and examples from the 2016 central Italy earthquake. Natural Hazards, Vol. 86, Issue 1, 2017, p. 193-195.
-
Yamada M., Hayashida T., Mori J., et al. Building damage survey and microtremor measurements for the source region of the 2015 Gorkha, Nepal, earthquake. Earth, Planets and Space, Vol. 68, Issue 1, 2016, p. 1-8.
-
Toma Danila D., Armaş I. Insights into the possible seismic damage of residential buildings in Bucharest, Romania, at neighborhood resolution. Bulletin of Earthquake Engineering, Vol. 15, Issue 3, 2017, p. 1161-1184.
-
Bessason B., Bjarnason J. Ö. Seismic vulnerability of low-rise residential buildings based on damage data from three earthquakes (M w 6.5, 6.5 and 6.3). Engineering Structures, Vol. 111, 2016, p. 64-79.
-
Ashour A., El Dakhakhni W. Influence of floor diaphragm-wall coupling on the system-level seismic performance of an asymmetrical reinforced concrete block building. Journal of Structural Engineering, Vol. 142, Issue 10, 2016, p. 04016071.
-
El Zareef M. A. Seismic damage assessment of multi-story lightweight concrete frame buildings reinforced with glass-fiber rods. Bulletin of Earthquake Engineering, Vol. 15, Issue 4, 2017, p. 1451-1470.
-
Ezzeldin M., El Dakhakhni W., Wiebe L. Experimental assessment of the system-level seismic performance of an asymmetrical reinforced concrete block-wall building with boundary elements. Journal of Structural Engineering, Vol. 143, Issue 8, 2017, p. 4017063.
-
Thinley K., Hao H. Seismic performance of reinforced concrete frame buildings in Bhutan based on fuzzy probability analysis. Soil Dynamics and Earthquake Engineering, Vol. 92, 2017, p. 604-620.
-
Chung Y. L., Nagae T., Hitaka T., et al. Seismic resistance capacity of high-rise buildings subjected to long-period ground motions: E-Defense shaking table test. Journal of Structural Engineering, Vol. 136, Issue 6, 2010, p. 637-644.
-
Xing S., Yuji M. Seismic response characteristics of a building supported by pile foundation in frozen soil based on shaking table test. Journal of Earthquake and Tsunami, Vol. 10, Issue 2, 2016, p. 1640005.
-
Gavridou S., Wallace J. W., Nagae T., et al. Shake-table test of a full-scale 4-story precast concrete building. II: Analytical studies. Journal of Structural Engineering, Vol. 143, 2017, p. 4017035.
-
Lourenço P. B., Avila L., Vasconcelos G., et al. Experimental investigation on the seismic performance of masonry buildings using shaking table testing. Bulletin of Earthquake Engineering, Vol. 11, Issue 4, 2013, p. 1157-1190.
-
Ikeda Y. Verification of system identification utilizing shaking table tests of a full‐scale 4‐story steel building. Earthquake Engineering and Structural Dynamics, Vol. 45, Issue 4, 2016, p. 543-562.
-
Moaveni B., He X., Conte J. P., et al. System identification study of a 7-story full-scale building slice tested on the UCSD-NEES shake table. Journal of Structural Engineering, Vol. 137, Issue 6, 2010, p. 705-717.
-
Zhou W., Zheng W. Z., Tong J. Y., Chang J. M. Seismic strengthening and damage analysis of buildings in Wenchuan earthquake. Journal of Harbin Institute of Technology, Vol. 45, Issue 12, 2013, p. 1-9.
-
Cao W. L., Zhou Z. Y., Wang Q., Dong H. Y., Zhang J. W. Experimental study on base vibration isolation and anti-seismic masonry structure in rural areas by shaking table test. Journal of Vibration and Shock, Vol. 30, Issue 11, 2011, p. 209-213.
-
Lv X. L., Cheng H. J., Lu W. S., Ni C. Shake table tests of a two-storey light wood framed house. China Civil Engineering Journal, Vol. 40, Issue 10, 2007, p. 41-49.
-
Zheng S. S., Yang Y., Zhao H. T. Experimental study on seismic behavior of masonry building with frame-shear wall structure at lower stories. China Civil Engineering Journal, Vol. 37, Issue 5, 2004, p. 23-31.
-
Liu Y., Liu W. G., He W. F., Yang Q. R. Shaking table tests for a complex museum’s isolated structure. Journal of Vibration and Shock, Vol. 33, Issue 4, 2014, p. 108-112.
-
Valente M., Milani G. Seismic assessment of historical masonry towers by means of simplified approaches and standard FEM. Construction and Building Materials, Vol. 108, 2016, p. 74-104.
-
Grilli S. T., Harris J. C., Bakhsh T. S. T., et al. Numerical simulation of the 2011 Tohoku tsunami based on a new transient FEM co-seismic source: Comparison to far-and near-field observations. Pure and Applied Geophysics, Vol. 170, Issues 6-8, 2013, p. 1333-1359.
-
Jankowski R. Non-linear FEM analysis of pounding-involved response of buildings under non-uniform earthquake excitation. Engineering Structures, Vol. 37, 2012, p. 99-105.
-
Abate G., Corsico S., Massimino M. R. FEM modelling of the seismic behavior of a tunnel soil-aboveground building system: a case history in Catania (Italy). Procedia Engineering, Vol. 158, 2016, p. 380-385.
-
Sun D. H., Ding F., Zhang Z. X. Numerical simulation under reinforcing masonry buildings of mechanical seismic action. Journal of Hebei United University (Natural Science Edition), Vol. 35, Issue 2, 2013, p. 126-128.
-
Ge D. D., Chen X., Miao Q. S., Li W. F. Numerical research on a full-scale masonry buildings retrofitted by external precast structure. Journal of Civil Engineering and Management, Vol. 28, Issue 3, 2011, p. 344-348.
-
Ma H. W., Wang L. M., Chen L. Z., Li Q. S. Numerical simulation of earthquake damage in rural masonry buildings. China Earthquake Engineering Journal, Vol. 35, Issue 2, 2013, p. 232-239.
-
Yu H. Y., Wang D., Yang Y. Q., Xie Q. C., Jiang Zhou W. X. B. F. The preliminary analysis of strong ground motion records from the Ms 8.0 Wenchuan earthquake. Journal of Earthquake Engineering and Engineering Vibration, Vol. 29, Issue 1, 2009, p. 1-13.
-
Wang W. P., Yin Y. P., Li B., Feng Z., Yan J. K. Spectral characteristics of dynamic response of slope with different angles of inclination. Chinese Journal of Rock Mechanics and Engineering, Vol. 34, Issue 1, 2015, p. 121-128.
-
Yue M. G., Wang D. S., Sun Z. G., Su Z. B. Analysis on collapse resistant capability of reinforced concrete frame structure under Wenchuan earthquake. Engineering Mechanics, Vol. 29, Issue 11, 2012, p. 250-256.
About this article

