Abstract
To reasonably evaluate the overall seismic performance of infilled wall frames, a corresponding nonlinear analysis model is constructed with infilled wall frames as the research object. It quantifies the failure levels of structural and non-structural components and proposes a method for extracting structural overall performance indicators. The vulnerability of the case frame structure is analyzed using the Incremental Dynamic Analysis (IDA) method. The results showed that the seismic performance of the infilled wall frame and the ordinary frame met the seismic fortification requirements, and the seismic capacity of the infilled wall frame was better. After implementing a 7-degree seismic fortification, the cumulative probability of basic integrity, minor damage, and moderate damage for infill wall frames reached 99.15 %, surpassing the fortification target of 1.5 g. However, the seismic capacity of ordinary frames was overestimated, as their cumulative probability of basic intact, minor damage, and moderate damage under a 7-degree seismic fortification was 99.7 %. Neglecting its impact, ordinary frames exhibited lower seismic performance compared to other structures, with a basic intact probability of only 48.49 % under frequent earthquake actions at 7 degrees. The research utilizes effective methods for evaluating the seismic vulnerability of infilled wall frames.
1. Introduction
While significant progress has been made in enhancing the seismic performance of structural components, research on non-structural components remains limited and has not received adequate attention [1-3]. Currently, existing seismic design standards in China generally ensure that structural components meet fortification requirements. However, insufficient in-depth research on the seismic mechanisms of non-structural components has resulted in these components failing to meet relevant requirements, leading to substantial damage. The current research on the seismic performance and design of non-structural components lacks reasonable and efficient evaluation methods, thus being unable to accurately depict the behavior of buildings during strong earthquakes. This impedes the advancement of modern structural design. Simultaneously, international research on performance indicators for frame structures incorporating non-structural elements is not yet comprehensive, lacking relevant evaluation criteria for overall performance assessment based on non-structural components. Assessing the performance indicators of ordinary frame structures falls short of meeting the overall seismic performance design requirements for buildings, lacking in evaluation rationality, and failing to accurately gauge the overall seismic resistance of frame structures. The Incremental Dynamic Analysis (IDA) method, as a structural nonlinear analysis approach, effectively accounts for the uncertainties associated with ground motion and provides insight into the seismic performance of structures under specific ground motion parameters [4-6]. Therefore, the IDA method is employed as a research methodology to assess the overall seismic resistance of infilled wall frames, facilitating a reasonable evaluation of their structural behavior.
2. Related work
To achieve a comprehensive understanding of a building's overall performance, it is crucial to conduct a comprehensive evaluation of both its structural and non-structural components. However, there remains a lack of extensive research on the performance of frame structures that consider non-structural elements, such as infill walls. Furthermore, there is currently no standardized method for determining overall performance indicators in this context, which poses challenges in meeting the requirements of overall seismic performance design. Jagadesesan et al. conducted comparative experiments to analyze relevant parameters of reinforced concrete (RC) infill walls and studied their performance when incorporating basalt fibers. The findings indicated that the addition of basalt fibers improved the corresponding frame structure's performance [7]. Similarly, Saheb et al. conducted experiments on single-layer, single-span specimens and performed performance analysis to enhance the connection method between frame and infill walls, achieving effective filling. The research method ensured intact filling with positive application effects [8]. Davorin et al. focused on investigating the role of masonry infill walls in the shear bearing capacity of frames, particularly examining the impact of different types of openings on individual component performance. Validation results showed that infill wall frames with windows exhibited lower shear strength [9]. Bozyigit et al. introduced dynamic stiffness formulas and developed relevant models to comprehend the harmonic response of infill wall frames. The results demonstrated the effectiveness of the established model [10].
Yang et al. conducted a seismic response analysis using relevant hysteresis models and the IDA method to evaluate the seismic resistance of high-rise wooden structures. The results demonstrated that the selected method effectively assessed the building’s performance in relation to seismic events [11]. Jayarajan employed the IDA method to analyze the seismic resistance of steel pipe frame structures in petrochemical enterprises. The findings indicated that this method was successful in evaluating the seismic performance of steel pipe frame structures [12]. Beiraghi developed a nonlinear model to assess the performance changes of RC coupled shear walls under Far Field Earthquake (FFE) and Near Field Earthquake (NFE) scenarios and utilized the IDA method to calculate the corresponding brittleness curves. The results highlighted significant differences in the brittleness curves between FFE and NFE [13].
In conclusion, while there has been increased attention on the influence of infill walls on structures, there is still limited research on how to effectively incorporate their role in structural design evaluation. Therefore, this study aims to address this gap by focusing on infill wall frame structures and analyzing their seismic vulnerability. To conduct a comprehensive earthquake assessment, the study will utilize the IDA method, which has proven to be effective in previous research. This study sets itself apart from prior studies by fully considering the significance of infill walls in frame structures and analyzing their overall performance level indicators. The goal is to establish a solid foundation for achieving rational seismic performance evaluation.
3. Seismic vulnerability of infilled wall frame structures based on IDA method
3.1. Frame structure infilled walls-based analysis model and interstory displacement angles performance index limits
A building is comprised of both structural and non-structural components, and understanding their performance collectively is crucial in assessing the overall performance of the building. However, the existing research on performance indicators for non-structural frame structures is still lacking in comprehensiveness, which hinders the determination of overall performance indicators for building structures. To address this, research is undertaken from the perspective of non-structural components, specifically focusing on infill walls, to analyze the overall seismic performance of frame structures that incorporate infill walls. To begin, a corresponding nonlinear analysis model is established, utilizing the fiber model within Perform-3D software. The frame's beam-column elements are represented by fiber elements, which are divided into 7 and 5×5 sections respectively, employing a concentrated plastic hinge model. For the analysis of infill walls, the FEMA equivalent slant support model is employed. This is achieved through the construction of the Concrete Structure unit within Perform-3D software [14-16]. The calculation formula for the equivalent width of the slant support is presented in Eq. (1):
where, represents the parameter, represents the frame column height, and the diagonal length of the infill wall is expressed as . The calculation formula for is shown in Eq. (2):
where, the height, length, and thickness of the infill wall are expressed as , , and , the elastic modulus of the infill wall material is set as , the moment of inertia of the column is expressed as , and is the inter-layer displacement angle. Infilled walls usually have openings. For infilled walls with openings, when using the FEMA equivalent slant support model, the reduction coefficient method is used to simplify the impact of openings on frames’ performance. The Strength reduction coefficient is shown in Eq. (3):
where, the area of the infill wall and the area of the opening are and . When is 0.6 times greater than , the effect of infill walls can be ignored. The stiffness reduction coefficient outside the plane is shown in Eq. (4):
In the constitutive equation of unconstrained concrete, the relevant formula for the reference value of the descending segment of the concrete uniaxial stress-strain curve is shown in Eq. (5):
where, , , and all represent variables, and represents the concrete damage evolution parameters under uniaxial compression. The Mander model is used for the constitutive model of constrained concrete, and the peak strain of constrained concrete is shown in Eq. (6):
where, the peak stress of unconstrained concrete is set to , and its peak strain is set to ; The peak stress of the confined concrete is expressed as , with a peak strain of and an ultimate peak strain of . The constitutive relationship of concrete materials is defined through Perform-3D software, as shown in Fig. 1.
Fig. 1F-D relationship of the five-line model
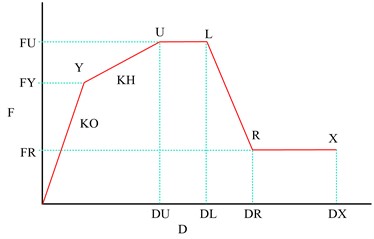
In Fig. 1, F represents strength; D represents deformation in the strength state; FY, FU, and FR represent material ultimate strength, yield strength, and residual strength. The first yield point is Y, the strength limit point is set to U, the strength degradation point is set to L, and the residual strength point is R. The deformation limit point is represented as X. The deformations corresponding to these key points are set as DU, DL, DR, and DX. In the constitutive model of steel reinforcement, the Non-Buckling model is used, and the strength of the infill wall material is the average axial compressive strength of the masonry. According to the performance indicators of ASCE 41-06, the limits for infill wall components are given in Table 1.
Table 1Performance index limits for infilled wall components
Performance level | Intact | Minor damage | Moderate damage | Serious damage | Damage |
< 0.10 % | 0.10 %~0.18 % | 0.18 %-0.50 % | 0.50 %-0.60 % | > 0.60 % |
According to the performance index limits in Table 1, the performance of infill walls can be analyzed. The damage indicators of components are quantified and the overall performance indicators of the structure are extracted. When extracting indicators, the relevant steps are shown in Fig. 2.
Fig. 2Steps for extracting overall performance indicators of the structure
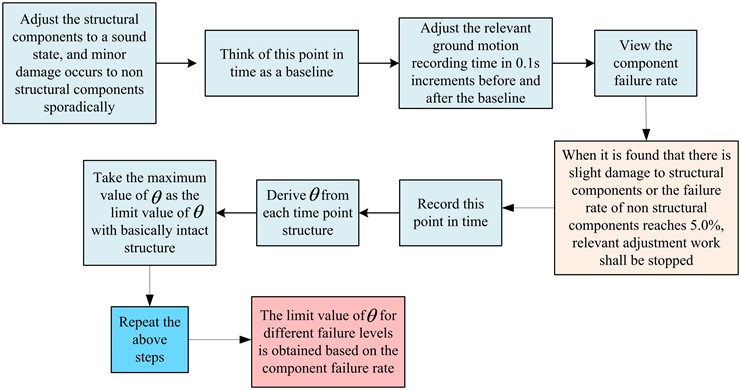
In Fig. 2, the structural components are first adjusted to their intact state. There are sporadic non-structural components with slight damage, and this time point is used as a benchmark. The relevant seismic motion recording time is adjusted in increments of 0.1 seconds before and after the benchmark, and the component failure rate is checked. When slight damage is found to structural components or the failure rate of non-structural components reaches 5.0 %, relevant adjustment work shall be stopped and this time point shall be recorded. is derived from the structure at each time point, and the maximum value is used as the limit value for the basic integrity of the structure. Repeating the above operation can obtain the limit values for different failure levels based on the component failure rate.
3.2. IDA method application in seismic vulnerability analysis
A comprehensive understanding of the seismic resistance of building structures is crucial for effective disaster prevention and mitigation efforts. In light of this, this study focuses on the infill wall frame structure as a representative example and employs the IDA method to analyze the seismic resistance of the building structure [17]. Specifically, the structural performance parameter chosen for evaluation is the maximum interlayer displacement angle. The steps involved in the IDA method are illustrated in Fig. 3.
Fig. 3The process of IDA method for seismic analysis of building structures
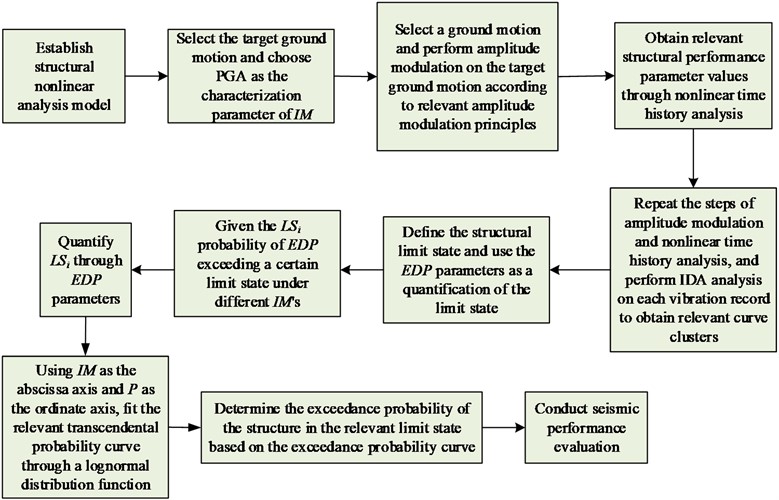
Fig. 3 illustrates the construction of a nonlinear analysis model for the structural examples. The selection of the target ground motion follows the ATC-63 screening principle, which determines the characterization parameters for the ground motion intensity measure (IM). In this study, Ground Peak Acceleration (GPA) is chosen as the IM characterization parameter for . A specific seismic motion is selected, and relevant principles of amplitude modulation are referred to in order to modulate the target seismic motion. The selected amplitude modulation method employs both equal step size and unequal step size. Following the amplitude modulation process, multiple ground motion records with the same spectral characteristics and duration but varying peak values are obtained from each original ground motion record. Nonlinear time-history analysis is then conducted to obtain the corresponding Engineering Demand Parameter (EDP) values under the relevant seismic amplitudes. The steps of seismic motion selection and amplitude modulation are repeated, and each seismic motion record undergoes analysis using the IDA method. This iterative process results in an IDA curve cluster for the structure, providing a comprehensive representation of its seismic response characteristics. By utilizing these techniques, this study aims to achieve a thorough understanding of the structural behavior under various seismic conditions, as depicted in the IDA curve cluster.
Based on the structural type, its limit state is defined and represented by parameters is quantified. Given the probability of exceeding a certain limit state under different , i.e. . represents the corresponding value when exceeds a certain limit state. is set as through the quantification of the parameter, and the probability of exceeding when is shown in Eq. (7):
where, the conditional probability distribution conforms to the logarithmic normal distribution. With and as the horizontal and vertical axes, the curve of exceedance probability under different is fitted and drawn through the logarithmic normal distribution function. On the basis of the obtained exceedance probability curve, the exceedance probability of each is determined under the fortification target and different in the structure, and the seismic performance is evaluated. In vulnerability analysis, the nonlinear behavior of structures under different conditions is generally predicted by drawing IDA curves of different ground motions. However, due to the inaccuracy of ground motion, the IDA curve plotted has a certain degree of nonlinearity. Thus, it is necessary to statistically analyze the curve data, using the median to represent the average level of the curve cluster, and using the 16 % and 84 % percentile curves to characterize the discrete type, as shown in Eq. (8):
where, represents the standard normal cumulative distribution function, the inter-layer displacement angle is expressed as , , , and represent the quantile curve relationship. The logarithmic mean of is set as , the logarithmic standard deviation of is set as , and can represent the degree of dispersion of . The mathematical expression of is shown in Eq. (9):
where, represents the variable and represents the variable. The mathematical expression of is shown in Eq. (10):
According to Eqs. (8), (9), and (10), the relevant mathematical expressions for , , and can be obtained as shown in Eqs. (11):
where, represents the exponential function based on the natural constant .
3.3. Case models and seismic vulnerability construction
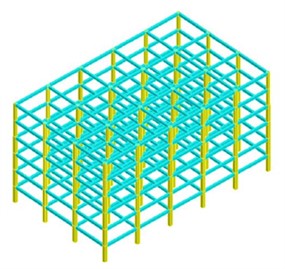
After explaining the design and establishment of the IDA calculation model, a city in China was selected to calculate the construction age of 500 frame structures. Over time, a larger proportion of structures were designed according to the new standards. To evaluate the seismic performance and understand the situation of newly designed structures, particularly in relation to important non-structural components like infill walls, a 6-story frame structure office in Tianjin was chosen as a representative prototype. During the selection process for the case structure prototype, the office building in Tianjin was redesigned using PKPM2010 software to represent many current frame structures. The seismic performance analysis was conducted using Perform-3D software. Specifically, the selected representative frame structure is a 6-story RC frame office building with a floor height of 3.6 m. The building has 5 spans in the direction and 3 spans in the direction, each with a span of 7.5 m, the structural plan is shown in Fig. 4.
Fig. 4Structural plan
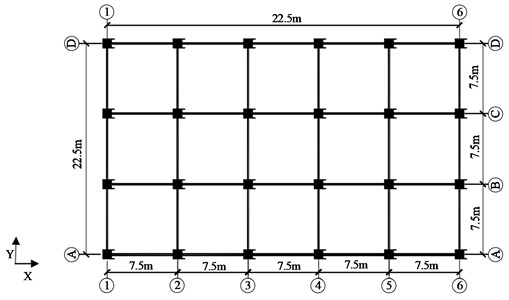
In Fig. 4, in terms of design parameters, the structure falls under Class III in the design site category, with a seismic intensity of 7 degrees (0.15 g). The exterior wall consists of clay brick-filled walls, and windows are installed along the A to D axis and 1 to 6 axis, with a hole opening rate of 40 %. The structure adopts C30 concrete material, Grade III steel for longitudinal reinforcement, and Grade I steel for stirrups. The infill walls have outer and inner wall thicknesses of 240 mm and 180 mm, respectively. MU10 standard clay bricks and M2 mixed mortar are used for masonry. Additionally, tie bars extend 500 mm beyond the column edge and are embedded inside column 2A6@500. The floor load is designed with a constant load of 6.25 kN/m2, while the roof load is designed with a constant load of 7.5 kN/m2. The live load reduction coefficient is taken as 0.5, and the basic wind pressure is designed with a value of 0.5 kN/m2.
The reinforcement design of the frame structure is carried out using PKPM2010 and is verified through simplified arrangements based on the principle of equivalent reinforcement area. Subsequently, fiber models are defined based on these arrangements. The analysis model is constructed, and geometric modeling is established using SAP200. The obtained frame node coordinates, loads, and other information are then imported into Perform-3D software. To facilitate rapid modeling and analysis, material properties and load effects are redefined. Verify the rationality of the Perform-3D model using SAP200 basic modal calculations. The relevant situation of the model is shown in Fig. 5.
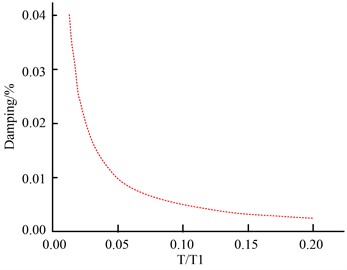
Fig. 5 (a) shows the three-dimensional model of the PKPM framework structure, Fig. 5(b) shows the three-dimensional model of the SAP2000 framework structure, and Fig. 5(c) shows the infill wall framework structure. Determine model damping. During an earthquake, when the input seismic energy dissipates, the building eventually stops shaking. This energy dissipation occurs through two main mechanisms: elastic-plastic energy dissipation and other forms of energy dissipation. However, accurately calculating the latter form of energy dissipation is challenging. Therefore, it is commonly represented by setting a damping coefficient. Due to the complexity of estimating damping, the damping ratio can serve as a reference value. The influence of damping on the structure can be analyzed through modal damping and Rayleigh damping. The expression for modal damping is shown in Eq. (12):
where, is the damping matrix, the number of damping modes is expressed as , is vibration mode, the period of is , the damping ratio of is , the mass matrix is expressed as , and the shape of is . In Rayleigh damping, is set as the linear combination of structural mass matrix and stiffness matrix. When , represent variables, the relevant formula can be obtained as shown in Eq. (13):
where, represents the variable, the mode is set to with a period . During the calculation, 5 % modal damping is applied to the periodic interval, and high-frequency vibration is eliminated by adding 0.1 % Rayleigh damping. The values of Rayleigh damping are shown in Fig. 6.
Fig. 53D model of structure
a) 3D model diagram of PKPM framework structure
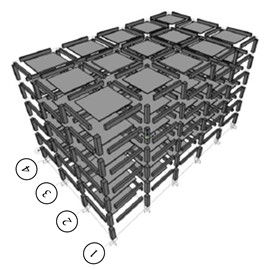
b) 3D model of SAP2000 frame structure
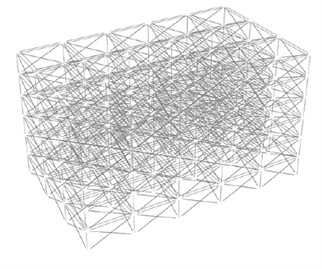
c) Infilled wall frame structure
Fig. 6 provides the values of Rayleigh damping that are used to match the model structural damping with the actual structural damping, ensuring the energy balance of the seismic input structure. To accurately consider the effect of infilled walls, the study simulates them using equivalent diagonal strut elements, which serve as simulation elements. In order to ensure the correctness of the nonlinear analysis, a method of deleting elements under gravity load is adopted. This means assuming that the internal force of such elements under gravity load is zero, and then activating these elements in subsequent analyses to incorporate their contributions.
Fig. 6Setting of Rayleigh damping
The deformation of the frame structure with infill walls, when subjected to horizontal forces, results in a transition from shear type to bending shear type, which introduces a gravity effect -. Therefore, this effect must be taken into account in the calculations. The selected performance indicators in the example structure include beam components, frame column sections, and infill walls. Table 2 presents the performance indicators specifically for beam components and infill walls.
Table 2Relevant performance indicators
Index | Destructive | Basically intact | Minor damage | Moderate damage | Serious damage |
Performance indicators of beam components | Plastic | 0.004 | 0.007 | 0.0016 | 0.0024 |
Infilled wall performance indicators | Compressive | 0.000436 | 0.000785 | 0.00218 | 0.00262 |
Table 2 contains various performance indicators with different values corresponding to different indicator rating levels. These values serve as reference points for conducting correlation analysis. The study also involves the selection of seismic motion and amplitude modulation. Following the ground motion selection principle outlined in ATC-63, a total of fifteen far field motions and one El Centro motion have been selected. Table 3 presents some specific details about these selected motions.
Table 3Partial ground motion input
Order number | Earthquake magnitude | Earthquake name | Station | Weight |
1 | 7.4 | Manjil, Iran | Abbar | ABBAR-T |
2 | 6.9 | Kobe, Japan | Hin-Osaka | SHI090 |
3 | 7.5 | Kocaeli, Turkey | Duzce | DZC270 |
4 | 7.3 | Landers, USA | Yermo Fire Station | YER270 |
5 | 6.9 | Loma Prieta, USA | Gilroy Array #3 | G03000 |
In Table 2, the seismic magnitude selected is approximately 7.0, resulting in variations in the corresponding seismic acceleration time history curve and response spectrum curve. The study selected three equal step sizes of 0.05 g, 0.10 g, and 0.20 g for unequal step amplitude modulation. After 13 amplitude modulation and 208 nonlinear time history analyses, the required structural performance parameters were obtained. The seismic peak accelerations after 13 amplitudes of modulation are: (0.05 g, 0.10 g, 0.15 g, 0.20 g, 0.25 g, 0.30 g, 0.35 g) +(0.40 g, 0.50 g, 0.60 g) + (0.80 g, 1.00 g, 1.20 g), a total of 13 amplitudes. For the infill wall frame structure, overall performance indicators are derived, and the average inter-layer displacement angles are obtained under the selected seismic motion, which are then used as performance indicators. The overall failure rate is utilized to represent the failure of the infill wall and the subsequent repair requirements. During vulnerability analysis using the IDA method, the obtained IDA data undergoes regression analysis to establish a linear regression analysis function, as shown in Eq. (14). This regression analysis function aids in understanding the relationship between various parameters and provides valuable insights for assessing the structural vulnerability:
where, and represent parameters. Substituting and into Eq. (15), the conditional probability of exceeding a limit state under different can be obtained:
where, represents the structural capacity parameter, and takes a value of 0.4. The relevant exceedance probability curve and the relevant vulnerability matrix can be obtained. Thus, the seismic vulnerability of infill wall frame structures can be analyzed.
4. IDA method application results in the study of seismic vulnerability of infilled wall frame structures
To validate the IDA method, Perform-3D software was utilized to analyze the seismic vulnerability of the infill wall frame in the calculation example. The 16 selected seismic motions were grouped into 16 sets and compared with the ordinary frame in the calculation example. During this analysis, three different step sizes (0.05 g, 0.10 g, and 0.20 g) were used to create unequal step amplitude modulation. A total of 13 amplitude modulation and 208 nonlinear time history analyses were carried out to obtain the necessary structural performance parameters. Following the completion of these calculations, the exceedance probabilities of the two frameworks under different limit states are presented in Fig. 7. This figure provides a visual representation of the comparison between the infill wall frame and the ordinary frame in terms of their performance under various limit states.
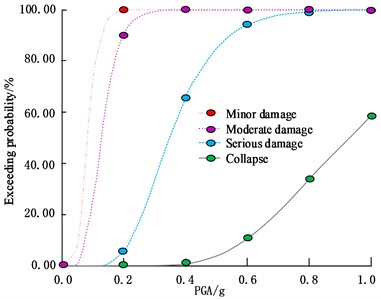
Fig. 7Exceeding probabilities of two types of frame structures under various limit states
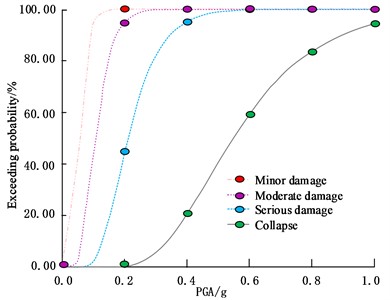
a) Transcendence probability of ordinary frames
b) Transcendence probability of infilled wall frames
In Fig. 7(a), under the same failure level, as increases, the corresponding probability of exceedance first rapidly increases, then the rate of increase decreases and finally stabilizes. When was at a lower level, under the same , the higher the level of damage, the smaller the probability of exceedance. When was 0.20 g, the probability of collapse exceeding was 0.00 %, 94.23 % lower than moderate damage. When was 0.7 g, the probability of collapse exceeding was 73.72%. The trend of exceedance probability related changes in Fig. 7(b) is similar to Fig. 7(a). When was 0.20 g, the probability of medium failure exceeding was 91.05 %, 3.18 % lower than Fig. 7(a); When was 0.3 g, the probability of collapse exceeding was 0.00 %, 34.11 % lower than severe damage. In the three types of earthquakes: Frequent, fortified, and rare, the corresponding for the structure with a degree of 7 (0.15 g) were 55Gal (0.0561 g), 150 Gal (0.15 g), and 220 Gal (0.3163 g). Further analysis of the correlation between the limit states of these two frames in the calculation example showed the structural vulnerability matrix under the two fortification levels of degree 7, 0.1 g, and 0.15 g, as shown in Table 4.
Table 4Relevant performance indicators
Seismic level | Performance status | ||||||
Level classification | Frame type | PGA (g) | Basically intact (%) | Minor damage (%) | Medium damage (%) | Serious damage (%) | Collapse (%) |
7 degree frequent earthquake | Normal Frame | 0.0357 | 87.34 | 12.45 | 0.20 | 0.00 | 0.00 |
0.0561 | 48.49 | 47.01 | 4.48 | 0.02 | 0.00 | ||
Infilled wall frame | 0.0357 | 98.88 | 1.10 | 0.02 | 0.00 | 0.00 | |
0.0561 | 84.05 | 14.80 | 1.15 | 0.00 | 0.00 | ||
7 degree earthquake fortification | Normal Frame | 0.1020 | 5.48 | 49.81 | 41.91 | 2.80 | 0.00 |
0.1500 | 0.46 | 18.62 | 62.62 | 18.26 | 0.04 | ||
Infilled wall frame | 0.1020 | 24.06 | 47.57 | 28.35 | 0.02 | 0.00 | |
0.1500 | 3.58 | 26.39 | 69.18 | 0.85 | 0.00 | ||
7 degree rare earthquake | Normal Frame | 0.2245 | 0.01 | 2.68 | 41.36 | 54.97 | 0.98 |
0.3163 | 0.00 | 0.24 | 14.55 | 77.68 | 7.53 | ||
Infilled wall frame | 0.2245 | 0.16 | 4.80 | 84.28 | 10.76 | 0.00 | |
0.3163 | 0.00 | 0.41 | 60.01 | 39.47 | 0.11 | ||
Table 4 illustrates the disparities in vulnerability performance states across different earthquake levels. The probability of experiencing various damage levels differs even under the same earthquake level. For instance, under the frequent seismic action of 7 degrees with an acceleration of 0.1 g, the probability of the ordinary frame structure remaining essentially intact in the calculation example was found to be 87.34 %, which is 38.85 % higher than that of the frame structure subjected to 7 degrees with an acceleration of 0.5 g. Additionally, under this earthquake action, the probability of the infill wall in the calculation example remaining basically intact was determined to be 98.88 %, which is 14.83 % higher than that of the frame structure under 7 degrees with an acceleration of 0.5 g. Both frames exhibited a negligible probability of severe failure and collapse, which was 0 %. Through a comparative analysis, it was observed that the evaluation status at the target fortification level of 7 degrees with an acceleration of 0.1 g was more favorable. Assessing the vulnerability matrix at 7 degrees with an acceleration of 0.5 g revealed that the severe failure rates for infilled wall frames and ordinary frames were 0.85 % and 18.28 %, respectively. Table 4 confirms that the infill wall frame meets the seismic fortification requirements and exhibits superior seismic performance. Building upon the basis of 7 degrees with an acceleration of 0.5 g, the research indicators and ordinary frame indicators were applied in the vulnerability analysis of the infill wall frame in the calculation example, and the corresponding results are presented in Fig. 8.
Fig. 8Correlated exceedance probabilities of infilled walls under two indicators
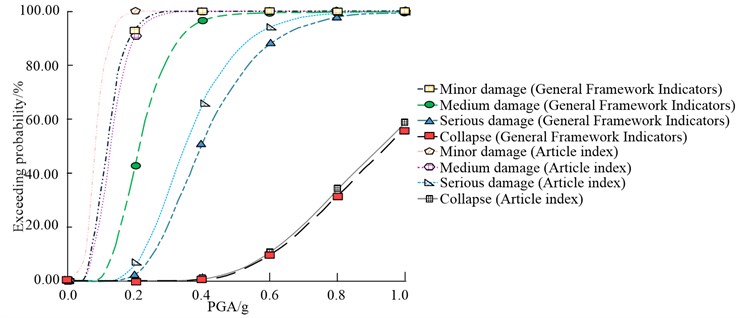
In Fig. 8, under the same , the probability of exceedance under the research indicator is higher than that under the ordinary framework indicator. The probability of exceeding first increased and then gradually stabilized. When was 0.3 g, the probability of severe damage exceeding the research index was 34.08 %, which was 13.11 % higher than the ordinary framework index, and the latter was 20.97 %. When was 0.8 g, the excess of collapse under the research index was 32.27 %, while the average frame index was 30.86 %. On this basis, the vulnerability of the infill wall under two indicators was analyzed, and the results are shown in Table 5.
Table 5Vulnerability matrix of infilled walls under two indexes
Seismic level | Performance status | ||||||
Level classification | Indicator Type | PGA (g) | Basically intact (%) | Minor damage (%) | Medium damage (%) | Serious damage (%) | Collapse (%) |
7 degree frequent earthquake | General Framework Indicators | 0.0561 | 94.82 | 5.18 | 0.00 | 0.00 | 0.00 |
Article Indicators | 0.0561 | 84.05 | 14.80 | 1.15 | 0.00 | 0.00 | |
7 degree earthquake fortification | General Framework Indicators | 0.1500 | 27.07 | 56.31 | 16.32 | 0.30 | 0.00 |
Article Indicators | 0.1500 | 3.58 | 26.39 | 69.18 | 0.85 | 0.00 | |
7 degree rare earthquake | General Framework Indicators | 0.3163 | 1.05 | 11.40 | 60.98 | 26.48 | 0.09 |
Article Indicators | 0.3163 | 0.00 | 0.41 | 60.01 | 39.47 | 0.11 | |
In Table 5, the performance of the ordinary framework indicator is better than that of the research index in terms of the probability distribution under different failure states. When subjected to a 7-degree seismic fortification, the research index exhibits a probability of moderate failure at 69.18 %, which is 52.86 % higher than the ordinary frame index with a moderate failure state. The cumulative probabilities of severe damage and collapse are relatively small for both indicators. However, the cumulative probability of basic integrity, minor damage, and moderate damage for the ordinary framework indicator is 99.7 %, indicating a state of minor damage or below, which does not align with the actual situation. This overestimates the seismic performance of infill walls and fails to leverage the structural seismic resistance. When subjected to a 7-degree earthquake, the difference between the two indicators is not very significant, with structures predominantly experiencing moderate and severe damage states, aligning with the current seismic status. Nonetheless, using the ordinary frame indicators provided in the literature still leads to an overestimation of the seismic performance of infilled wall frames, which hinders effective structural seismic fortification. Based on these two indicators, a common framework was selected as a benchmark to examine its correlation with the probability of exceeding the infill wall, as demonstrated in Fig. 9.
Fig. 9Correlation exceedance probability comparison
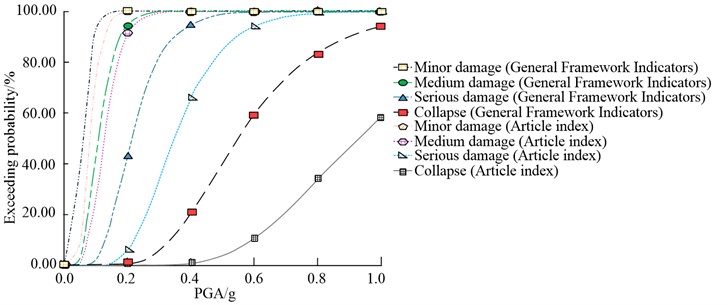
In Fig. 9, under the same , the probability of the infill wall exceeding the ordinary frame is higher. The probability of exceeding first increased and then gradually stabilized. When was 0.4 g, the probability of severe failure of the infill wall was 64.35 %, 29.52 % higher than that of the ordinary frame, and the latter was 93.87 %; When was 0.9 g, the exceedance of the collapse of the infill wall was 47.74 %, while that of the ordinary frame was 90.13 %. On this basis, the vulnerability of the two frameworks is analyzed in Fig. 10.
In Fig. 10, both types of frames generally satisfy the criteria of “undamaged by small earthquakes, repairable during moderate earthquakes, and non-collapsible during large earthquakes” across the three seismic levels. However, the seismic performance of infilled wall frames is superior. In Fig. 10(a), under the influence of frequent earthquakes at a 7-degree intensity, the infilled wall frame exhibits a significantly higher rate of basic integrity, reaching 84.05 %, surpassing that of the ordinary frame. In Fig. 10(b), when subjected to a 7-degree seismic fortification, the average failure probability of the infilled wall frame is 69.18 %, which is 6.56 % higher than that of the ordinary frame. This indicates that the selected indicators for the ordinary frame underestimate the seismic capacity of the infilled frame. In Fig. 10(c), both types of frames mainly experience moderate and severe damage states, demonstrating their ability to resist collapse during large earthquakes.
5. Conclusions
To analyze the seismic vulnerability of infilled wall frame structures, this study utilizes Perform-3D software to construct a FEMA equivalent slant support model. It establishes performance indicators for infilled members and proposes a methodology for overall structural performance assessment. Based on this, the seismic vulnerability of infilled wall frame structures is investigated using the IDA method, and specific numerical examples are constructed for detailed analysis. The results demonstrate that, under different fortification levels, the evaluation of the 7-degree 0.1 g fortification target indicates favorable conditions, while the corresponding state probabilities at 7-degree 0.15 g also meet the fortification requirements. In the case of a 7-degree 0.15 g seismic fortification, the severe failure rates for infilled wall frames and ordinary frames are 0.85 % and 18.28 %, respectively.
Fig. 10Vulnerability analysis of the two frameworks
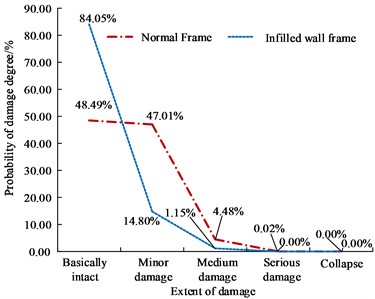
a) Probability of related failure degree of two types of frames under 7-degree frequent earthquake
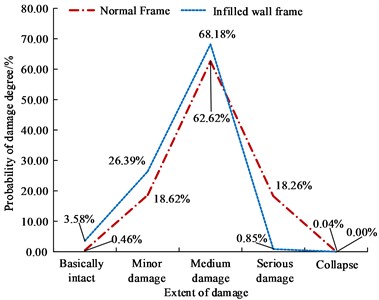
b) Probability of related damage degree of two types of frames under a 7-degree earthquake fortification
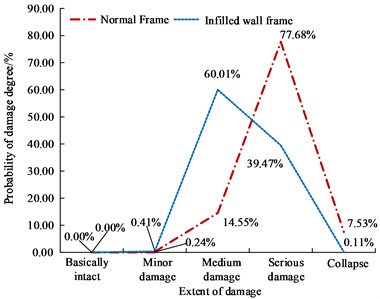
c) Probability of the relevant failure degree of two types of frames under a 7-degree rare earthquake
The calculated example shows that the seismic performance of infilled wall frames is relatively strong. Furthermore, compared to the ordinary frame indicators, the calculated example using the research index for the infilled wall frame aligns more closely with the actual situation. Under the influence of a 7-degree seismic fortification, the moderate failure probability according to the research index is 69.18 %, which is 52.86 % higher than that of the ordinary frame index in the moderate failure state. The cumulative probability of basic integrity, minor damage, and moderate damage according to the ordinary framework indicators is 99.7 %, indicating a state of minor damage or lower, which does not accurately reflect the true situation. In comparison, the seismic performance of the example infilled wall frame is superior to the selected ordinary frame. Under the action of frequent earthquakes at a 7-degree intensity, the basic integrity rate of the infilled wall frame is 84.05 %, surpassing that of the ordinary frame. The research methodology employed in this study proves to be effective. However, it should be noted that the analysis only considered far-field seismic motion and did not explore the performance of infilled frames under near-field seismic motion. In future studies, it is recommended to introduce different seismic parameters in order to broaden the research scope. This will allow for a more accurate assessment of the seismic resistance of infilled frames in the near field, thereby improving seismic safety and economic benefits. Ultimately, this will ensure the safety of buildings and residents in areas affected by near-field seismic events.
References
-
S. Shoeibi, M. A. Kafi, and M. Gholhaki, “New performance-based seismic design method for structures with structural fuse system,” Engineering Structures, Vol. 132, pp. 745–760, Feb. 2017, https://doi.org/10.1016/j.engstruct.2016.12.002
-
N. Zerrouni, S. Aguib, A. Grine, and N. Chikh, “Numerical simulation and experimental analysis of magneto-mechanical behavior of anti-seismic active sandwich structure,” Journal of Vibroengineering, Vol. 21, No. 7, pp. 1928–1944, Nov. 2019, https://doi.org/10.21595/jve.2019.20321
-
N. Miki, S. Kishiki, S. Yamada, T. Hasegawa, and Y. Jiao, “Evaluation of seismic performance of steel frame consisted of wf beam and rhscolum with low joint efficiency in beam web,” Journal of Structural and Construction Engineering(Transactions of AIJ), Vol. 82, No. 737, pp. 1113–1123, 2017, https://doi.org/10.3130/aijs.82.1113
-
A. Kaveh, S. M. Javadi, and R. Mahdipourmoghanni, “Optimization-based record selection approach to incremental dynamic analysis and estimation of fragility curves,” Scientia Iranica, Vol. 28, No. 2, pp. 700–708, 2021, https://doi.org/10.24200/sci.2020.56487.4743
-
S. R. Vaidehi, P. Kamatchi, S. R. Balasubramanian, and G. Joshi, “Seismic safety evaluation of URM buildings through incremental dynamic analysis,” Journal of Structural Engineering, Vol. 47, No. 6, pp. 532–541, 2021.
-
K. Mahmoodi, A. Noorzad, A. Mahboubi, and M. Alembagheri, “Seismic performance assessment of a cemented material dam using incremental dynamic analysis,” Structures, Vol. 29, No. 2, pp. 1187–1198, Feb. 2021, https://doi.org/10.1016/j.istruc.2020.12.015
-
P. Jagadeesan and T. Palanisamy, “Study on performance of infilled wall in RC framed structure using basalt fibre in cement mortar,” Journal of Structural Engineering, Vol. 45, No. 6, pp. 512–519, 2019.
-
S. A. Asadzadeh, M. Mohammadi, N. K. A. Attari, and S. A. Zareei, “An experimental study on the effect of frame-to-wall connection type on the seismic behavior of steel frames infilled with autoclave-cured aerated concrete blocks,” Advances in Structural Engineering, Vol. 23, No. 4, pp. 642–656, Mar. 2020, https://doi.org/10.1177/1369433219877789
-
D. Penava, V. Sarhosis, I. Kožar, and I. Guljaš, “Contribution of RC columns and masonry wall to the shear resistance of masonry infilled RC frames containing different in size window and door openings,” Engineering Structures, Vol. 172, pp. 105–130, Oct. 2018, https://doi.org/10.1016/j.engstruct.2018.06.007
-
B. Bozyigit and Y. Yesilce, “Dynamic stiffness formulations for harmonic response of infilled frames,” Structural Engineering and Mechanics, Vol. 68, No. 2, pp. 183–191, Jan. 2018, https://doi.org/10.12989/sem.2018.68.2.183
-
S. C. Yang, H. P. Hong, and F. M. Bartlett, “Responses and capacity curves of mid – and high-rise wood buildings subjected to seismic excitations,” Canadian Journal of Civil Engineering, Vol. 47, No. 1, pp. 63–76, Jan. 2020, https://doi.org/10.1139/cjce-2018-0300
-
Puttatt Jayarajan, “Seismic fragility assessment of a pipe rack structure in a petrochemical complex by incremental dynamic analysis,” Journal of Structural Engineering (JoSE), Vol. 47, No. 5, pp. 408–415, Jan. 2020.
-
H. Beiraghi, “Incremental dynamic analysis of coupled tall reinforced concrete walls subjected to far-field and near-field earthquakes,” Ingegneria Sismica, Vol. 37, No. 3, pp. 1–26, 2020.
-
A. Ghith, M. Ezzeldin, M. Tait, and W. El-Dakhakhni, “Performance of battery rack auxiliary power systems under FEMA 461 quasi-static seismic loading protocol,” Structures, Vol. 27, No. 27, pp. 1041–1056, Oct. 2020, https://doi.org/10.1016/j.istruc.2020.04.034
-
Tae-Sung Eom, Mu-Won Hur, and Sang-Hyun Lee, “Seismic resistance of strengthened reinforced concrete walls by thick jacketing,” ACI Structural Journal, Vol. 117, No. 6, pp. 93–103, Nov. 2020, https://doi.org/10.14359/51725984
-
J. P. Rivera and A. S. Whittaker, “Updated fragility functions for shear-critical reinforced concrete walls,” ACI Structural Journal, Vol. 116, No. 2, pp. 139–146, Mar. 2019, https://doi.org/10.14359/51711139
-
J. Leng, S. G. Buonopane, and B. W. Schafer, “Incremental dynamic analysis and FEMA P695 seismic performance evaluation of a cold‐formed steel-framed building with gravity framing and architectural sheathing,” Earthquake Engineering and Structural Dynamics, Vol. 49, No. 4, pp. 394–412, Apr. 2020, https://doi.org/10.1002/eqe.3245
About this article

The authors have not disclosed any funding.
The datasets generated during and/or analyzed during the current study are available from the corresponding author on reasonable request.
The authors declare that they have no conflict of interest.
