Abstract
The present study explores the seismic performance and the expected structural damage in reinforced concrete (RC) frames with progressively increasing in-plan and in-height non-regularity. To this aim, four three-dimensional (3D) buildings characterised by different regularity levels are taken into account. The structures are subjected to seismic input consisting of unscaled real ground motion records, and non-linear dynamic analyses are performed in the Cloud Analysis framework, represented by three different intensity measures (IMs). To evaluate the effect of structural non-regularity, fragility curves are derived based on linear regression models.
Highlights
- Incrementation of non-regularity leads to damage incrementation
- Fragility curves developed via Cloud Analysis procedure do not capture such damage incrementation
- Fragility curves developed via Cloud Analysis may not account for seismological properties
- Linear regression may not be the best statistical model to predict such damage incrementation
1. Introduction
Both in-plant and in-height non-regularity features have a major impact on the dynamic behaviour of structures. For example, in-plant non-regularity is responsible of torsional effects, whilst in-height non-regularity typically affects modal participation of higher modes [1], [2]. International codes approach the matter in different ways [3]-[5], but they do not consider it from a risk assessment point of view.
In this paper, in-plan and in-height damage effects are evaluated by developing fragility curves, within the Cloud Analysis framework [6]–[8].
To this aim, four reinforced concrete (RC) frames are designed based on the Italian Code provisions [4], assuming that they are located in a high seismicity zone. The structural layouts are defined to achieve different levels of non-regularity, which is measured by TIR [9]. Nonetheless, the structures are designed to stay in the same range of verifications.
To perform parametric non-linear dynamic time history analyses, a set of 61 unscaled recorded ground motions are selected. For each record, three different intensity measures (IMs) are calculated, to correlate damage and ground motion. The selected damage parameter is the demand/capacity ratio, which is calculated in terms of chord-rotation of horizontal elements. To account for record-to-record variability, a bootstrap procedure is also applied to each correlation [10]. For each linear regression, the corresponding fragility curve is hence calculated. The structures characterised by the highest non-regularity should show more fragile median fragility curves, and the dispersion of the correlation should be bigger.
2. Reference RC structures
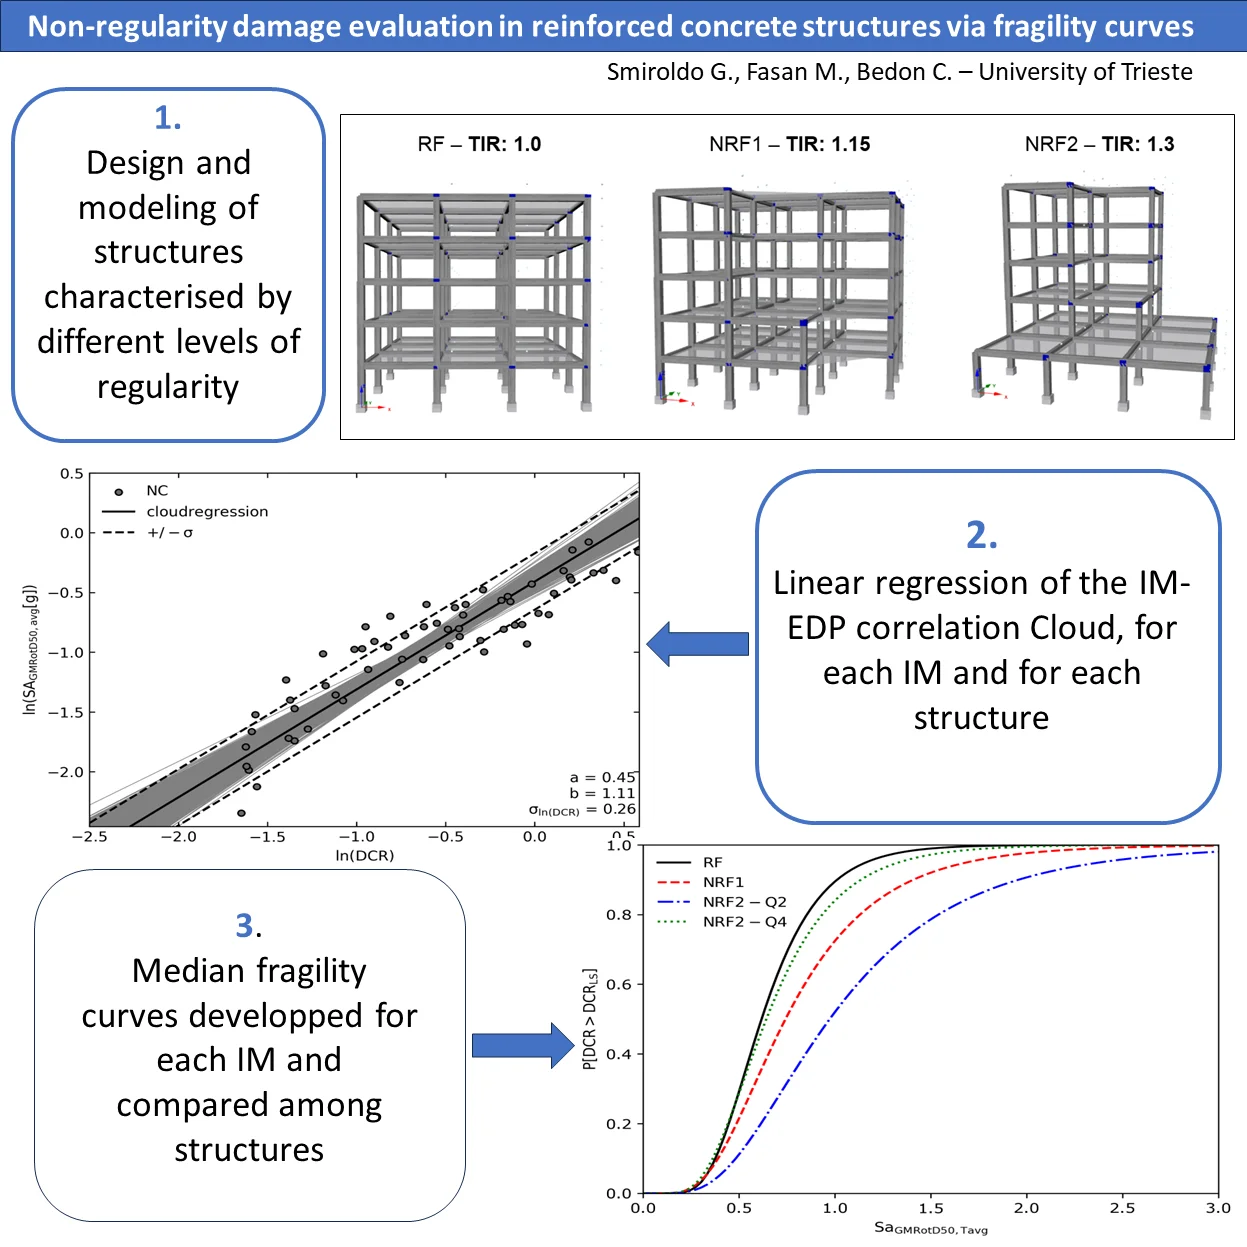
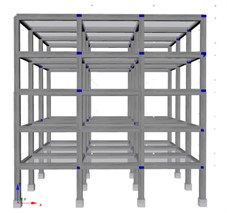
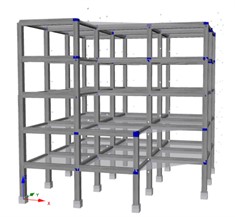
The reference 3D buildings used in this study are four multi-storey reinforced concrete (RC) frames exhibiting varying degrees of regularity. The first structure, referred to as the “Regular Frame” (RF), features a square plan measuring 15 meters in width. The frame is further divided into three bays, each with a length of 5 meters. The seismic action is defined according to [4] for a high seismicity location. The other structures (“NRF1”, “” and “”, in the following) are designed based on the RF layout, by progressively removing bays and columns to achieve the desired levels of non-regularity (see Fig. 1).
The aim of present study is in fact to assess the seismic responses of different structures by varying their in-plan and in-height regularity. To achieve this goal, the selected structures are designed to be as similar as possible from a provisional point of view. Both the RF and NRF1 structures are hence designed adopting a behaviour factor 3.9. To note that for torsional deformable RC structures, the Italian Code prescribes 2. As such, to account for this difference in , the NRF2 system is designed in both ways and two torsional deformable structures (“” and “”) are analysed. To account for design-given uncertainty, the response spectrum analysis results are checked to have the same level of design.
Fig. 1Reference structures: a) RF; b) NRF1 and c) NRF2
a)
b)
c)
3. Intensity measure selection
In this work the median geometric mean value over all possible non-redundant rotation angles is used (GMrotD50) [11].
One structure-independent and two structure-dependent scalar IMs are selected among the most referred in practice, which are:
1) The Peak Ground Acceleration (PGA);
2) For structure-dependent IM, spectral acceleration is evaluated at a mean period , which is defined as the average of fundamental periods in x and y directions [9], as defined in Eq. (1):
The spectra acceleration is also evaluated as the geometric mean over a range of periods [12], [13], as expressed in Eq. (2):
Last measure is used to properly consider the rotational modes of the non-regular structures, making it a very efficient intensity measure [14]–[16]. To note that the range of periods should be selected to include higher modes effect and period elongations due to accumulation of damage. Five periods are selected in present study, including modes with mass participation higher than 10 %:
3.1. Engineering demand parameter selection
The Chord-rotation Demand/Capacity Ratio (DCR) is single EDP for each analysis.
As the shear span Ls defined in following Eq. (4), the Chord-rotation Capacity is defined by the NTC2018 [4] at C8.7.2.1, as the following Eq. (5), for each element end:
3.2. Performance level selection
To generate fragility curves for DCR and as EDP, two performance levels are considered [3]: Life Safety (LS) and Collapse Prevention (CP). EDP Life Safety thresholds are calculated as ¾ of Collapse Prevention thresholds. For DCR, the assumed capacity threshold is set to 1.
Table 1 summarises the thresholds.
Table 1Damage thresholds
RF | NRF1 | NRF2_Q2 | NRF2_Q4 | |
DCR CP | 1 | 1 | 1 | 1 |
DCR LS | 0.75 | 0.75 | 0.75 | 0.75 |
3.3. Record selection
In this work, fragility is assessed via Non-Linear Time History Analysis (NLTHAs) [17]. The Cloud Analysis procedure is selected to develop fragility curves due to its reduced computational cost of approach [18]. Moreover, it is based on the use of unscaled ground motion records avoiding possible biases introduced by scaling [19], [20].
The number of records needed for the estimation of fragility curves varies between 40 and 100 depending on the selected method of evaluation [21]–[24].
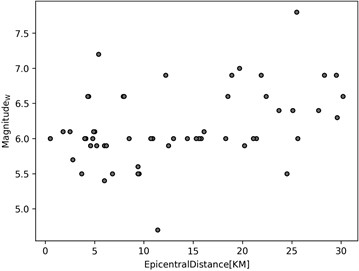
In present study, following the selection parameters in [7], a set of 61 unscaled strong ground-motion records are taken into account from the European Strong Motion Database [25]. The corresponding Magnitude – Distance scatter plot is shown in Fig. 2.
Fig. 2Magnitude – distance scatter plot
3.4. Fragility development
The original Cloud Analysis procedure, which disregards the so called “collapse cases”, is considered. The fragility function for a given performance level can be written as [26]:
Eq (6) represents the probability of experiencing a EDP greater than a . This function can be calculated with standard Cloud Analysis that supposes a linear relation between EDP and IM, within a bi-logarithmic plane:
Therefore, given an EDP threshold , the probability of experiencing an EDP greater than , given , is:
where is the standard normal cumulative distribution.
Fragility functions should be developed including the effect of uncertainties due to [27], [28]: record to record variability; mechanical properties variability; performance level capacity threshold variability; model parameters; fragility median uncertainty. The first three can be classified as mainly aleatory uncertainties, whereas the last one as mainly epistemic. The presently applied methodology naturally accounts for the record-to-record variability as each couple IM-EDP data pairs, resulting from the N NLTHAs, comes from a different record. To account for epistemic uncertainties, a bootstrap procedure is applied [29], [30].
4. Results and discussion
For practical reasons, Fig. 3 shows only one IM-EDP correlation and the corresponding fragility curves.
Fig. 3Results for NRF2Q4
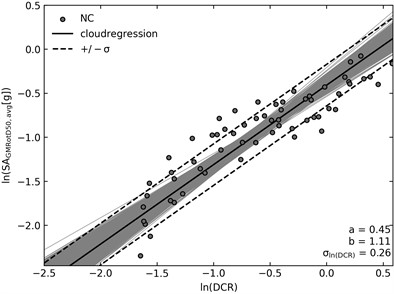
a) Linear regressions
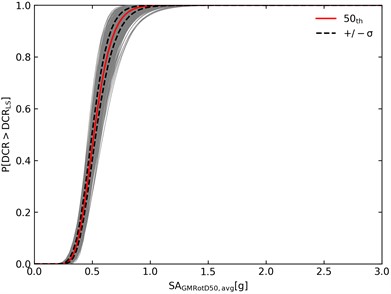
b) Fragility curves
As shown, the IM trend is associated to less scatter around the mean value. This indicates that is the most efficient IM [14], [16]. The pictures show median regression values and the confidence interval for the prediction. The dots represent IM-EDP couples. The median estimated parameters from the bootstrap procedure are also reported. The grey lines show the single bootstrap realizations.
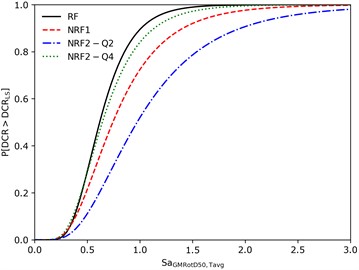
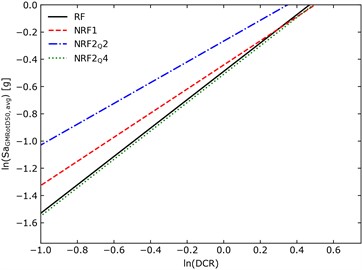
Finally, the response of all RC structures are shown in Fig. 4: the damage evaluation is carried out by qualitatively compare the median fragility curves of reference structures.
The median linear regressions and fragility curves do not show a clear increment of fragility, which should be expected consistent / proportional to non-regularity increment. The frame is the most vulnerable, meanwhile NRF1 and are less vulnerable. To explain this inconsistency, the total amount of accelerograms could be reduced to the highest thirty-one accelerograms which gave the highest EDP and then re-apply the whole methodology. This has been decided to account for possible bias in the record selection process. In this case, the linear regressions and the fragility curves are made without bootstrapping.
The curves are shown in Fig. 5.
Fig. 4Median regressions and fragility curves for all the examined RC structures
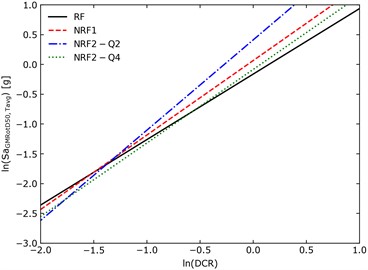
a) Linear regressions
b) Fragility curves
Fig. 5Regressions and fragilities for the new seismic input
a) Linear regressions
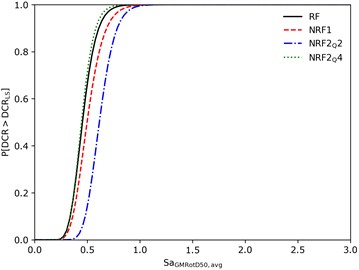
b) Fragility curves
5. Conclusions
In this paper, linear regression and fragility curves were presented, via Cloud Analysis procedure, for a selection of three-dimensional (3D) reinforced concrete (RC) frames characterized by increasing levels of non-regularity in-plan and in-height.
To this aim, the input consisted in 61 unscaled recorded ground motions. Three Intensity Measures and one local EDP were considered for the linear regression correlation. A bootstrap procedure was also implemented to account for epistemic uncertainties.
As shown, the fragility curves did not prove the expected damage incrementation with structural non-regularity, which was indeed emphasized by raw EDPs. To account for possible bias in record selection, linear regressions and fragility curves were defined for a reduced sample of accelerograms, with negligible differences in comparative outcomes.
Such an inconsistency could be probably justified by seismological aspects and statistical modelling issues. The selection of ground motions did not account for near-site effects (i.e., directivity, fling, spectral shape, etc.). Moreover, linear regression might not be the best statistical model to correlate EDPs with IMs that are not sufficient to represent the ground motion. These aspects will be thus necessarily explored in future extended studies.
References
-
A. K. Chopra, Dynamics of Structures: Theory and Applications to Earthquake Engineering. Prentice Hall, 2020.
-
M. N. Fardis, “Seismic design, assessment and retrofitting of concrete buildings,” in Geotechnical, Geological, and Earthquake Engineering, Dordrecht: Springer Netherlands, 2009, https://doi.org/10.1007/978-1-4020-9842-0
-
“Seismic evaluation and retrofit of existing buildings,” American Society of Civil Engineers, 2020.
-
“Norme Tecniche Costruzioni,” 2018.
-
“EN 1998-3: Eurocode 8: Design of structures for earthquake resistance – Part 3: Assessment and retrofitting of buildings,” EUROCODE 8, 2005.
-
N. Luco and C. A. Cornell, “Structure-specific scalar intensity measures for near-source and ordinary earthquake ground motions,” Earthquake Spectra, Vol. 23, No. 2, pp. 357–392, May 2007, https://doi.org/10.1193/1.2723158
-
F. Jalayer, H. Ebrahimian, A. Miano, G. Manfredi, and H. Sezen, “Analytical fragility assessment using unscaled ground motion records,” Earthquake Engineering and Structural Dynamics, Vol. 46, No. 15, pp. 2639–2663, Dec. 2017, https://doi.org/10.1002/eqe.2922
-
H. Ebrahimian and F. Jalayer, “Selection of seismic intensity measures for prescribed limit states using alternative nonlinear dynamic analysis methods,” Earthquake Engineering and Structural Dynamics, Vol. 50, No. 5, pp. 1235–1250, Apr. 2021, https://doi.org/10.1002/eqe.3393
-
“Assessing seismic performance of buildings with configuration irregularities,” FEMA, 2018.
-
C. Galasso, P. Zhong, F. Zareian, I. Iervolino, and R. W. Graves, “Validation of ground-motion simulations for historical events using MDoF systems,” Earthquake Engineering and Structural Dynamics, Vol. 42, No. 9, pp. 1395–1412, Jul. 2013, https://doi.org/10.1002/eqe.2278
-
D. M. Boore, “Orientation-independent measures of ground motion,” Bulletin of the Seismological Society of America, Vol. 96, No. 4A, pp. 1502–1511, Aug. 2006, https://doi.org/10.1785/0120050209
-
L. Eads, E. Miranda, and D. G. Lignos, “Average spectral acceleration as an intensity measure for collapse risk assessment,” Earthquake Engineering and Structural Dynamics, Vol. 44, No. 12, pp. 2057–2073, Sep. 2015, https://doi.org/10.1002/eqe.2575
-
M. Kohrangi, P. Bazzurro, and D. Vamvatsikos, “Vector and scalar IMs in structural response estimation, part I: hazard analysis,” Earthquake Spectra, Vol. 32, No. 3, pp. 1507–1524, Aug. 2016, https://doi.org/10.1193/053115eqs080m
-
H. Ebrahimian, F. Jalayer, A. Lucchini, F. Mollaioli, and G. Manfredi, “Preliminary ranking of alternative scalar and vector intensity measures of ground shaking,” Bulletin of Earthquake Engineering, Vol. 13, No. 10, pp. 2805–2840, Oct. 2015, https://doi.org/10.1007/s10518-015-9755-9
-
A. K. Kazantzi and D. Vamvatsikos, “Intensity measure selection for vulnerability studies of building classes,” Earthquake Engineering and Structural Dynamics, Vol. 44, No. 15, pp. 2677–2694, Dec. 2015, https://doi.org/10.1002/eqe.2603
-
M. Kohrangi, D. Vamvatsikos, and P. Bazzurro, “Implications of intensity measure selection for seismic loss assessment of 3-D buildings,” Earthquake Spectra, Vol. 32, No. 4, pp. 2167–2189, Nov. 2016, https://doi.org/10.1193/112215eqs177m
-
G. Smiroldo, M. Fasan, and C. Amadio, “Fragility curves for reinforced concrete frames characterized by different regularity,” Procedia Structural Integrity, Vol. 44, pp. 283–290, 2023, https://doi.org/10.1016/j.prostr.2023.01.037
-
S. Mattei, M. Fasan, and C. Bedon, “On the use of cloud analysis for structural glass members under seismic events,” Sustainability, Vol. 13, No. 16, p. 9291, Aug. 2021, https://doi.org/10.3390/su13169291
-
N. Luco and P. Bazzurro, “Does amplitude scaling of ground motion records result in biased nonlinear structural drift responses?,” Earthquake Engineering and Structural Dynamics, Vol. 36, No. 13, pp. 1813–1835, Oct. 2007, https://doi.org/10.1002/eqe.695
-
A. Zacharenaki, M. Fragiadakis, D. Assimaki, and M. Papadrakakis, “Bias assessment in incremental dynamic analysis due to record scaling,” Soil Dynamics and Earthquake Engineering, Vol. 67, pp. 158–168, Dec. 2014, https://doi.org/10.1016/j.soildyn.2014.09.007
-
P. Gehl, J. Douglas, and D. M. Seyedi, “Influence of the number of dynamic analyses on the accuracy of structural response estimates,” Earthquake Spectra, Vol. 31, No. 1, pp. 97–113, Feb. 2015, https://doi.org/10.1193/102912eqs320m
-
J. Hancock, J. J. Bommer, and P. J. Stafford, “Numbers of scaled and matched accelerograms required for inelastic dynamic analyses,” Earthquake Engineering and Structural Dynamics, Vol. 37, No. 14, pp. 1585–1607, Nov. 2008, https://doi.org/10.1002/eqe.827
-
J. Kiani, C. Camp, and S. Pezeshk, “On the number of required response history analyses,” Bulletin of Earthquake Engineering, Vol. 16, No. 11, pp. 5195–5226, Nov. 2018, https://doi.org/10.1007/s10518-018-0381-1
-
G. Baltzopoulos, R. Baraschino, and I. Iervolino, “On the number of records for structural risk estimation in PBEE,” Earthquake Engineering and Structural Dynamics, Dec. 2018, https://doi.org/10.1002/eqe.3145
-
Luzi L. et al., “Engineering strong motion database (ESM) (Version 2.0),” Instituto Nazionale di Geofisica e Vulcanologia, 2020.
-
F. Jalayer and C. A. Cornell, “Alternative non-linear demand estimation methods for probability-based seismic assessments,” Earthquake Engineering and Structural Dynamics, Vol. 38, No. 8, pp. 951–972, Jul. 2009, https://doi.org/10.1002/eqe.876
-
V. Silva et al., “Current challenges and future trends in analytical fragility and vulnerability modeling,” Earthquake Spectra, Vol. 35, No. 4, pp. 1927–1952, Nov. 2019, https://doi.org/10.1193/042418eqs101o
-
K. Bakalis and D. Vamvatsikos, “Seismic fragility functions via nonlinear response history analysis,” Journal of Structural Engineering, Vol. 144, No. 10, Oct. 2018, https://doi.org/10.1061/(asce)st.1943-541x.0002141
-
I. Iervolino, “Assessing uncertainty in estimation of seismic response for PBEE,” Earthquake Engineering and Structural Dynamics, Vol. 46, No. 10, pp. 1711–1723, Aug. 2017, https://doi.org/10.1002/eqe.2883
-
F. Jalayer, H. Ebrahimian, and A. Miano, “Record-to-record variability and code-compatible seismic safety-checking with limited number of records,” Bulletin of Earthquake Engineering, Vol. 19, No. 15, pp. 6361–6396, Dec. 2021, https://doi.org/10.1007/s10518-020-01024-6
About this article

The authors have not disclosed any funding.
The datasets generated during and/or analyzed during the current study are available from the corresponding author on reasonable request.
The authors declare that they have no conflict of interest.
