Abstract
Mechanical damages in structures changes its geometry in various ways. However, if damage size comparing to structure size is small, thus observation of this damage could be hard or even impossible in some cases. For this reason, changes in structure’s vibration responses are investigated nowadays. The objective of this research is to investigate the influence of damage size to the vibration response of the mechanical structure – aluminum alloy plate. To achieve this aim, modal analysis of a reference, i.e. health, and multiple damaged structures using ANSYS Workbench, and calculation of modal assurance criterion (MAC) using Matlab were carried out in this research. During this research 6 different damage sizes were modelled and its vibration response was compared to the health one. Obtained results revealed that the bending modes rarely shows any trend towards damages scenario. But, when observing the MAC values matrices, the values related to torsional modes even on the diagonal of the matrices decrease as the damage size increases, which indicates that the damage has more influence on the torsional modes.
1. Introduction
All structures will degenerate over time, which can lead to structural flaws like cracks or damage that can lead to the collapse or failure of the structure over time. If a structural element is damaged or has flaws, these flaws can change its stiffness and damping qualities. As a result, the structure's natural frequencies and mode shapes tell you where and how big the damage is. Since the structural component is so important, even one small crack in it could lead to the collapse of a large building. These flaws changes vibration response of the structure. There are wide variety of processes which could be used to examine changes in measured vibration response to detect, locate, and characterize defects in structural and mechanical systems [1-4]. The idea is based on the principle that modal parameters (natural frequencies, mode shapes, etc.) are functions of the physical properties of the structure (mass, damping, and stiffness) [5-6]. Thus, changes in the physical properties makes differences in the modal properties. One of the method to observe these changes is to conduct modal analysis, which in general is about how mechanical structures move when they are hit by vibrations.
There are two main ways to do modal analysis: numerical modal analysis and experimental modal analysis, during which modal vectors could be obtained [7]. One of the most popular tools for the quantitative comparison of modal vectors is the modal assurance criterion (MAC). The MAC is a statistical indicator, just like ordinary coherence. This least squares based form of linear regression analysis yields an indicator that is most sensitive to the largest difference between comparative values and results in modal assurance criterion that is insensitive to small changes or small magnitudes [8-9]. Modal properties that are compared usually include natural frequencies, real mode shape vectors, modal masses, and modal kinetic and strain energies. For system with complex modes of vibration one can add modal damping ratios and complex mode shapes. A test-analysis comparison is meaningful only for matched modes. These are estimates of the same physical mode shape and their entries correspond one-for-one with their counterparts. Mode matching is an essential step before any comparison can be undertaken [8].
It is useful to compare:
1) measured mode shapes against vectors determined by analytical model.
2) estimates of the same test modal vector obtained from different excitation locations.
3) estimates of the same modal vector obtained from different modal parameter identification processes using the same test data.
4) one test mode shape before and after a change in the physical structure caused by a wanted modification.
This paper is largely concerned with presenting the sensitivity analysis on MAC at various levels of damage. The modal frequencies are also retrieved to demonstrate the impact of the damage scenario. To accomplish this, a straightforward model of aluminum plate is used so that the deviation can be plainly seen and there is no ambiguity regarding the reference for modelling the damage. The work shows a numerical examination of MAC at various levels of damage and demonstrates that, while the damage scale varies throughout a wide range, the change in MAC is not uniform across all modes. The result of this paper provides a quantification of the influence on MAC for various modes.
2. Finite element modelling
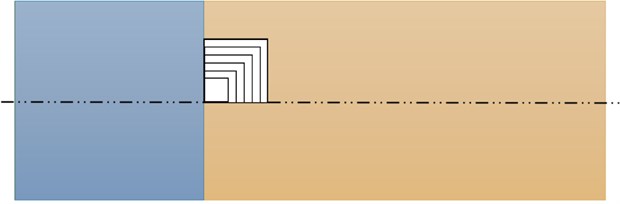
The mechanical structure for investigation – aluminum plate is designed using Ansys SpaceClaim software. The overall geometrical shape of the plate is rectangular with 500 mm length and 150 mm width. Out of 500 mm length, 145 mm is clamped to provide fixed support. The material used is aluminum alloy with the properties shown in Table 1. There are six cases of damages taken into the account. The damage in the aluminum plate is formed in a square shape, constructed at the same position but of different dimensions, starting from 5×5 mm up to 30×30 mm damage. The position of the damages is along the mid line, touching the boundary between fixed support and the free body, spreading towards the right side of the geometry as shown in the Fig. 1.
Table 1Geometry and Material properties
Dimension | 500×150×3 mm |
Density | 2770 kg/m3 |
Young’s modulus | 7.1×10¹⁰Pa |
Poisson’s ratio | 0.33 |
Bulk modulus | 6.9608×10¹⁰Pa |
Shear modulus | 2.6692×10¹⁰Pa |
The software used for numerical modal analysis is ANSYS Workbench software package. The modal analysis is run separately for each case (reference and damaged cases). The Modal A corresponds to undamaged object and Modal B, C, D, E, F, G corresponds to 5×5, 10×10, 15×15, 20×20, 25×25, and 30×30 mm defect respectively.
The element size of the mesh generated for the work piece is 5 mm with fine mesh. As the geometry is composed of 2 rectangle shell bodies, the nodes of both the bodies are merged together using nodal merge element between them. The solution is obtained in the form of 6 mode shapes with respect to 6 natural frequencies after performing the modal analysis. The results of all 6 mode shapes were extracted and evaluated and it was observed that in the list of 6 mode shapes, mode shape 1, 3 and 5 belongs to bending, while mode shape 2, 4 and 6 corresponds to torsional.
Fig. 1Damage location and dimension
The Modal Assurance Criterion (MAC) is calculated as the normalized scalar product of the two sets of vectors and . The resulting scalars are arranged into the MAC matrix, where the form of coherence function can be recognized, indicating the casual relationship between and [8]. In this project, the MAC is calculated between 2 sets of vectors (reference and each damage case). The vectors are derived from node numbers and respective Total Deformation obtained after running modal analysis. The vectors are arranged in and direction along the work piece using a MATLAB script and then used to calculate MAC using another MATLAB script, written specifically to calculate MAC for all the cases:
3. Results
The results obtained after performing numerical modal analysis were 6 mode shapes and their respective natural frequencies, initially on the reference case and then on all the damage cases. The mode shapes and corresponding frequencies for reference case are shown in the Fig. 2. It was observed that the natural frequencies obtained in modal analysis were inversely proportional to the size of the damage. As the damage kept modified or increased in each case, the frequencies for the all the 6 mode shapes kept decreasing.
The mode shapes obtained for the damage cases were quite similar to the reference case in the geometrical behavior, but the natural frequencies were affected as can be clearly observed from the Table 2.
Table 2Natural frequencies with respect to mode shapes for different damage cases
Damage Case | Mode 1 | Mode 2 | Mode 3 | Mode 4 | Mode 5 | Mode 6 |
B | 19.974 | 98.134 | 124.57 | 314.57 | 350.34 | 589.74 |
C | 19.872 | 98.126 | 124.1 | 314.84 | 349.3 | 589.68 |
D | 19.716 | 98.095 | 123.45 | 314.73 | 347.99 | 589.47 |
E | 19.512 | 98.019 | 122.68 | 314.48 | 346.62 | 589.01 |
F | 19.264 | 97.871 | 121.84 | 314.02 | 345.33 | 588.22 |
G | 18.978 | 97.625 | 120.99 | 313.28 | 344.15 | 587.03 |
The modal assurance criterion is calculated between reference and each damage case by putting mode shapes in the form of vectors in the MAC formula using MATLAB. The MAC matrix obtained after calculating the MAC is shown in Table 3, and presented in Fig. 3.
Table 3Numerical presentation of MAC values for damage case B
Mode | 1 | 2 | 3 | 4 | 5 | 6 |
1 | 1.0000 | 0.7128 | 0.5932 | 0.4389 | 0.5184 | 0.4247 |
2 | 0.7130 | 0.9850 | 0.5446 | 0.6495 | 0.4820 | 0.6288 |
3 | 0.5920 | 0.5441 | 0.9997 | 0.6985 | 0.6779 | 0.5612 |
4 | 0.4309 | 0.6390 | 0.7002 | 0.9243 | 0.5177 | 0.6062 |
5 | 0.5190 | 0.4920 | 0.6810 | 0.5171 | 0.9991 | 0.7227 |
6 | 0.4224 | 0.6102 | 0.5631 | 0.6101 | 0.7226 | 0.9329 |
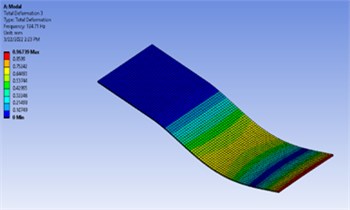
Fig. 2Six mode shapes and their respective frequencies for undamaged
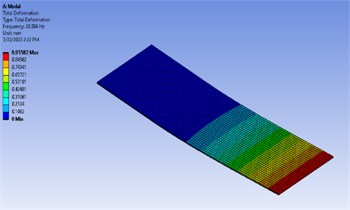
a) Mode 1 (20.004 Hz)
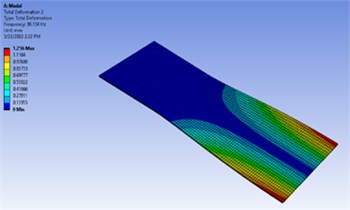
b) Mode 2 (98.134 Hz)
c) Mode 3 (124.71 Hz)
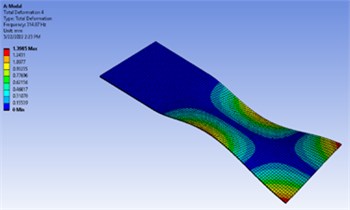
d) Mode 2 (98.134 Hz)
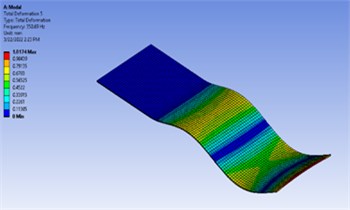
e) Mode 5 (350.69 Hz)
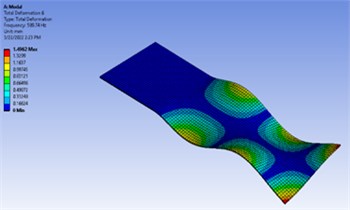
f) Mode 6 (589.74 Hz)
Fig. 3MAC calculation between reference and 5×5 mm damage case
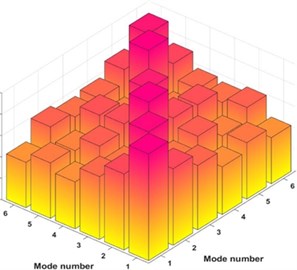
a) 3D presentation of MAC values
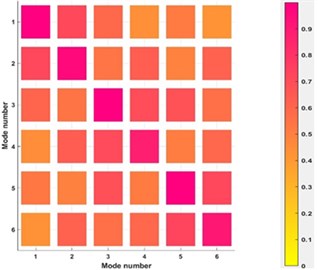
b) 2D presentation of MAC values
Similarly, the MAC values are calculated between the reference and the second damage case which is 10×10 mm in dimension and shown in Table 4. Similar task has been performed for all other damage cases and the numerical values are presented in Table 5-8.
Table 4Numerical presentation of MAC values for damage case C
Mode | 1 | 2 | 3 | 4 | 5 | 6 |
1 | 1.0000 | 0.7128 | 0.5920 | 0.4392 | 0.5188 | 0.4247 |
2 | 0.7134 | 0.9754 | 0.5436 | 0.6475 | 0.4915 | 0.6302 |
3 | 0.5944 | 0.5446 | 0.9997 | 0.6991 | 0.6805 | 0.5632 |
4 | 0.4401 | 0.6476 | 0.7002 | 0.9143 | 0.5155 | 0.6162 |
5 | 0.5206 | 0.4924 | 0.6824 | 0.5173 | 0.9991 | 0.7237 |
6 | 0.4256 | 0.6302 | 0.5633 | 0.6162 | 0.7247 | 0.9359 |
Table 5Numerical presentation of MAC values for damage case D
Mode | 1 | 2 | 3 | 4 | 5 | 6 |
1 | 1.0000 | 0.7128 | 0.5911 | 0.4391 | 0.5186 | 0.4247 |
2 | 0.7140 | 0.9828 | 0.5426 | 0.6544 | 0.4904 | 0.6340 |
3 | 0.5961 | 0.5450 | 0.9997 | 0.6996 | 0.6799 | 0.5634 |
4 | 0.4413 | 0.6548 | 0.7015 | 0.9256 | 0.5139 | 0.6222 |
5 | 0.5221 | 0.4920 | 0.6834 | 0.5174 | 0.9993 | 0.7237 |
6 | 0.4267 | 0.6342 | 0.5634 | 0.6221 | 0.7258 | 0.9448 |
Table 6Numerical presentation of MAC values for damage case E
Mode | 1 | 2 | 3 | 4 | 5 | 6 |
1 | 0.9999 | 0.7130 | 0.5901 | 0.4393 | 0.5186 | 0.4247 |
2 | 0.7149 | 0.9671 | 0.5410 | 0.6442 | 0.4897 | 0.6238 |
3 | 0.5981 | 0.5443 | 0.9994 | 0.6984 | 0.6791 | 0.5626 |
4 | 0.4427 | 0.6455 | 0.7026 | 0.9118 | 0.5132 | 0.6185 |
5 | 0.5240 | 0.4907 | 0.6841 | 0.5174 | 0.9984 | 0.7210 |
6 | 0.4281 | 0.6245 | 0.5630 | 0.6179 | 0.7263 | 0.9312 |
Table 7Numerical presentation of MAC values for damage case F
Mode | 1 | 2 | 3 | 4 | 5 | 6 |
1 | 0.9999 | 0.7130 | 0.5893 | 0.4396 | 0.5186 | 0.4249 |
2 | 0.7160 | 0.9400 | 0.5385 | 0.6322 | 0.4883 | 0.6049 |
3 | 0.6005 | 0.5431 | 0.9987 | 0.6965 | 0.6782 | 0.5611 |
4 | 0.4445 | 0.6348 | 0.7031 | 0.8958 | 0.5126 | 0.6109 |
5 | 0.5261 | 0.4886 | 0.6845 | 0.5189 | 0.9966 | 0.7162 |
6 | 0.4297 | 0.6073 | 0.5618 | 0.6117 | 0.7258 | 0.9102 |
Table 8Numerical presentation of MAC values for damage case G
Mode | 1 | 2 | 3 | 4 | 5 | 6 |
1 | 0.9998 | 0.7125 | 0.5885 | 0.4399 | 0.5185 | 0.4249 |
2 | 0.7169 | 0.9624 | 0.5395 | 0.6306 | 0.4895 | 0.6132 |
3 | 0.6030 | 0.5459 | 0.9980 | 0.6957 | 0.6776 | 0.5620 |
4 | 0.4462 | 0.6335 | 0.7050 | 0.8756 | 0.5114 | 0.5909 |
5 | 0.5283 | 0.4922 | 0.6851 | 0.5183 | 0.9951 | 0.7177 |
6 | 0.4312 | 0.6144 | 0.5625 | 0.5905 | 0.7279 | 0.9098 |
4. Conclusions
In this paper, the modal analysis is performed and the method for the comparison, quantitative correlation and to yield a degree of consistency between the mode shapes of undamaged and multi-damaged bodies is reviewed. The method used is MAC, which only indicate the consistency and does not indicate validity or orthogonality between the different mode shapes being compared. It is worth to notice, that in this paper a soft-simulated study was carried out and thus no surrounding noises are present Therefore no synthetic noises are used to investigate the effect on MAC, which must be considered during experimental study in the future, which will be devoted to verify research results, presented in this paper.
Based on the numerical analysis salient points observed as bellow:
1) The natural frequencies do not change greatly with the increase in the severity of the damage level. Modal frequencies fluctuate by less than 5 % when the damage level is at its peak (20 % loss of width).
2) On the basis of the results obtained after comparing the damage cases using MAC, it can be concluded that the bending modes rarely shows any trend towards damages scenario, because differences in MAC values of health and damaged states varies up to 0,2 % depending on defect size.
3) Observing the MAC values matrices, the values related to torsional modes even on the diagonal of the matrices decrease as the damage size increases, which indicates that the damage has more influence on the torsional modes and exceed up to 10 % difference in the MAC value depending on vibrating mode and defect size.
4) Obtained results could be used as the possibility of MAC usage for structural health monitoring system based on finite element model updating technique.
References
-
F. Seguel and V. Meruane, “Damage assessment in a sandwich panel based on full-field vibration measurements,” Journal of Sound and Vibration, Vol. 417, pp. 1–18, Mar. 2018, https://doi.org/10.1016/j.jsv.2017.11.048
-
Z. Zhang, J. Pan, W. Luo, K. R. Ramakrishnan, and H. K. Singh, “Vibration-based delamination detection in curved composite plates,” Composites Part A: Applied Science and Manufacturing, Vol. 119, pp. 261–274, Apr. 2019, https://doi.org/10.1016/j.compositesa.2019.02.002
-
M. Martinez-Luengo, A. Kolios, and L. Wang, “Structural health monitoring of offshore wind turbines: A review through the Statistical Pattern Recognition Paradigm,” Renewable and Sustainable Energy Reviews, Vol. 64, pp. 91–105, Oct. 2016, https://doi.org/10.1016/j.rser.2016.05.085
-
E. P. Carden and P. Fanning, “Vibration based condition monitoring: a review,” Structural Health Monitoring, Vol. 3, No. 4, pp. 355–377, Dec. 2004, https://doi.org/10.1177/1475921704047500
-
G. F. Gomes, F. A. de Almeida, D. M. Junqueira, S. S. Da Cunha, and A. C. Ancelotti, “Optimized damage identification in CFRP plates by reduced mode shapes and GA-ANN methods,” Engineering Structures, Vol. 181, pp. 111–123, Feb. 2019, https://doi.org/10.1016/j.engstruct.2018.11.081
-
S. Amadori and G. Catania, “Robust identification of the mechanical properties of viscoelastic non standard materials by means of frequency domain experimental measurements,” Composite Structures, Vol. 169, pp. 79–89, Jun. 2017, https://doi.org/10.1016/j.compstruct.2016.11.029
-
Nikhil A. Khadse and Prof. S. R. Zaweri, “Modal analysis of aircraft wing using Ansys workbench software package,” International Journal of Engineering Research and Technology, Vol. 4, No. 7, pp. 225–230, Jul. 2015.
-
M. Pastor, M. Binda, and T. Harčarik, “Modal assurance criterion,” Procedia Engineering, Vol. 48, pp. 543–548, 2012, https://doi.org/10.1016/j.proeng.2012.09.551
-
Rj Allemang, “The modal assurance criterion – Twenty years of use and abuse,” Sound and Vibration, Vol. 37, No. 8, pp. 14–23, Aug. 2003.
About this article

This research is supported by Research Council of Lithuania (Project CompExSHM No. P-MIP-19-523).
