Abstract
A new damage identification method with a fusion index to locate the damage position and identify the damage extent of beam structures is presented by integrating the modal strain energy and natural frequency sensitivity. The modal strain energy, which is with the limitation on obtaining the damage extent, is adopted to locate the damage position with avoiding the interference of structure itself. The natural frequency sensitivity, which is with false detection and interference happening when solely used, is adopted for identifying the damage extent. In order to further improve the precision of the damage quantification, additional masses are added on the beam structure to obtain more information about the natural frequency sensitivity. Then, the fusion index for damage identification is established through combining the modal strain energy and the natural frequency sensitivity before and after adding masses on beam structures. The results obtained by finite element analysis and experimental tests show that the presented method can locate and quantify damages on beam structures in an accurate and convenient way.
Highlights
- The modal strain energy and natural frequency sensitivity are integrated for damage identification of beam structures.
- A fusion index for damage identification is established by combining the modal strain energy and the natural frequency sensitivity.
- An aircraft wing specimen with different damage severity is tested for engineering application.
1. Introduction
Structures such as architectural structures, mechanical structures and vehicle structures are correlated with all around of people’s lives. Once the damage shows up, the safety of the structure cannot be guaranteed, and some damage can even trigger catastrophic failure. Such problems have attracted much attention of researchers, who have carried out their works to try to improve the precision of damage identification for structures.
The dynamic characteristic of the structure is the intrinsic property of the structure and it can be changed if the damage exists. Those dynamic characteristic variations can be reflected in several ways, such as natural frequency, structural stiffness, modal shapes and modal strain energy. Therefore, the structural damage identification based on structural dynamic characteristics is an important approach to diagnose the damage on structures. Locating damages and identifying the damage extent are two major works if damage exists on the structure. Adams et al. [1] proposed a non-destructive method using a spring model to locate and quantify the damage. The method which only considers the change of natural frequencies is simple to use while two problems were not solved. First, in the single damage case, two sites were regarded as damaged location because of the symmetry of the system and the one close to the actual damage position was finally taken for simplicity. Second, the method is not that effective in the case with multiple damages. Cawley and Adams [2] extended their work from one-dimension to two-dimension soon. The finite element analysis was performed based on the shell model. The predicted damage was validated by a simple test and the method was proved to be efficient, but errors still show up in the cases with two damage sites. Since local stiffness reduction is different for isotropic material and anisotropic material, Cawley and Adams [3] performed similar research on composite structure. The method from Cawley and Adams requires dynamic analysis, damage location program as well as corresponding experiments to locate damages. Yuen [4] presented a simpler method to confirm damage location and damage size by variations of eigenparameters. The research was conducted using a cantilever beam model with only two degrees of freedom and the damage was assumed only related to the stiffness loss modeled by the reduction of modulus. Eigenparameters of fore five modes were calculated but only the first mode is very sensitive in locating damages. Other than using the stiffness matrix, the damage can be located by modal shapes. West [5] who is one of the pioneers in this field proposed a MAC (Modal Assurance Criteria) approach to locate damages by checking modal shape differences before and after the damage presented on the space shuttle orbiter. Considering that the reduction of bending stiffness by damage will result in the increase of curvature, curvature mode shape variations can also be applied to locate damages. Pandey et al. [6] detected and located damages according to the curvature differences between the intact and the damaged structure. Later, Pandey and Biswas [7, 8] employed the variation of flexibility matrix to locate the damage and validated results by experiments. Almost the same time, Aktan et al. [9] also published their research on modal flexibility by transferring modal frequencies and mode shapes into the flexibility matrix. The application on bridges proves the reliability of using modal flexibility. Earlier research on flexibility matrix can also be found in the study of Gysin [10]. The results indicate the flexibility matrices of the structure can be obtained precisely when using some fore orders frequency. Stubbs and Kim [11] extended their research to a more complicated three dimensional frames. The research only adopts post-damage modal parameters to locate and estimate the quantity of damage. The application of the proposed system identification method on the continuous beam demonstrates the accuracy of locating damage. However, the magnitude of damage was overestimated. For researchers who applied modal strain energy to detect and locate damage, Doebling et al. [12] adopted mode selection strategy. The selection on modes using maximum strain energy gives more accurate result. The method proposed by Shi et al. [13, 14] based on the variation of modal strain energy in each element shows good results on locating single as well as multiple damages. The improved algorithm on damage quantification in their later research [15] is proved to be very efficient and the extent of damage can be confirmed only using few lower modes. Li et al. [16] decomposed modal strain energy at axial and transverse coordinates for locating damages. The method is demonstrated as very effective in locating different kinds of damage scenarios. Yan et al. [17] applied the closed-form of modal strain energy sensitivity method on damage detection. Although the method is very compact and cost effective, the application on the simply supported beam shows elements close to the boundary are insensitive to the variation of element modal strain energy.
Using different methods to locate and quantify damages all have their advantages and drawbacks. The detailed comparison of different methods can be found in some published studies [18-21]. In order to meet higher requirements of structural complicity and identifying precision, instead of applying only one method, many researchers integrated different methods to avoid limitations and to maximize the strengths. Friswell et al. [22] combined the advantages of the eigen sensitivity method and genetic algorithm. The damage, no matter single or multiple, is located by genetic algorithm and the damage extent is identified by eigen sensitivity analysis successfully. Yang and Liu [23] applied both damage localization criterion and natural frequency sensitivity method in localizing and quantifying damages. The method is proved to be very effective from the application on a simply supported beam. Hu et al. [24] proposed a CMSE (cross-modal strain energy) method which combines both modal shapes and modal frequencies in the estimation of damage extent including scenarios with single or multiple damages. Guo [25] presented an information fusion technique which provides three fusion approaches to integrate the obtained local decisions. The comparison of the three fusion method and other two existing criterion demonstrates higher accuracy of the fusion method on multiple damage identification. Jiang et al. [26] proposed a method integrated data fusion and PNN (probabilistic neural network) on damage detection. Its precision and robustness are demonstrated by two simulation examples. Seyedpoor [27] combined modal strain energy based index and particle swarm optimization in identifying multiple damages, but the combination in essence is a two-step method. The damage is located by a modal strain energy based index first and then the damage extent is confirmed by particle swarm optimization based on the modal strain energy calculated in the first step. Dawari [28] proposed a two stage methodology as well. The damage is located by modal strain energy first and then the severity of the damage is calculated by Artificial Neural Networks.
It is apparent that combing different methods will result in better results because of the utilization of advantages from those methods. In practical engineering, the damage detection by integrating different methods should be simple and efficient. Thus, the integrated method would better be a fusion index while not sequentially applying different methods which could be time-consuming and complicated. Another attention needs to draw is the accuracy of damage detection. Adding masses to the structure is an effective method to avoid false detection caused by the symmetry of the structure as mentioned before. The main idea of this method is to add masses at certain location of the structure to identify damages by combining the modal data before and after adding masses [29]. The identification precision is largely improved based on abundant frequency information from multiple frequency sensitivity functions.
This study proposes a simple damage identification method which combines both advantages of using modal strain energy and natural frequency variation. A brief review on different methods including combined methods applied on damage identification is presented first. In Section 2, the algorithm integrates modal strain energy and frequency sensitivity before and after adding masses as a damage index. In Section 3, the obtained integrated damage criterion is validated by finite element analysis. Moreover, because of using additional masses, sensitivity of influencing factors such as the size, the quantity and the location of the added masses are analyzed in sequence. In Section 4, experimental investigation is carried out on designed beam specimen in the single and multiple damage scenarios. More application examples are implemented on wing specimens with different damage extents. Finally, some important conclusions are drawn. Results from finite element analysis as well as elaborated experiments demonstrate the proposed integrated method can locate and quantify damage easily and precisely.
2. Basic principles
The strain energy of Euler-Bernoulli beam is written as:
where is the bending stiffness, is the length of the beam and is the deflection.
Dividing the beam into elements along the length direction, the strain energy of the the element under the th mode can be expressed by:
where is the th displacement mode of the beam structure, is the stiffness matrix of the th beam element.
Using to express the th displacement mode of the damaged beam structure, the strain energy of the th element under the th displacement mode for the damaged structure can be expressed by:
where “” denotes the corresponding quantities for the damaged beam.
In this study, the strain energy variation is used to define the nondimensionalized damage criterion which is expressed by:
From the engineering perspective, more mode shapes would better be extracted and under each mode shape there exists a damage criterion for the th element. Therefore, the quantity of damage which can use the average value of the fore th order displacement mode at the same element is expressed as:
where stands for the modal modes.
Then the damage index for beam structures based on modal strain energy can be denoted as:
Local peaks can be treated as damaged zones. If damage shows up, 0.
When using frequency sensitivity method, the beam is also divided into elements along the length direction. The characteristic equations for beam vibration without considering the damping before and after adding masses are expressed as:
where and stand for the mass matrix and stiffness matrix, respectively. represents the mass matrix of adding masses. and are the th natural frequency of the systematic structure before and after adding masses on the beam, respectively. and are the corresponding mode shapes of the th natural frequency before and after adding masses on the beam, respectively.
When the damage occurs on the beam, the changes of natural frequency before and after adding masses for the th mode denoted by and are separately expressed as:
where and are the th natural frequency of damaged and intact structure before adding masses. The corresponding parameters after adding masses are denoted by and .
Using Taylor series expansion, and can be approximately expressed as:
where is the total amount of the elements, is the damage parameter for the th element, and are the partial derivations of the th order natural frequency versus the damage parameter of th element before and after adding masses on the beam, respectively.
Damage identification adopts the fore th order natural frequency, then using matrix forms the Eq. (9) can be written as:
where and are the sensitivity matrix and can be expressed by:
The damage can be quantified by Eq. (10):
where is the generalized inverse matrix of while is the generalized inverse matrix of .
In order to employ advantages of using both strain energy function and frequency sensitivity function, the following procedures will be focused on integrating those modal parameters.
Firstly, normalize Eq. (6):
Then dot product is applied to combine the damage index which is from frequency sensitivity damage equation with added masses and which is from the variation of strain energy equation, the integrated damage criterion can be written as:
As can be seen from Eq. (14), the damage index possesses the advantages of both methods. It can be used to solve the damage identification problem such as light-weight structures with high strength. When multiple damages appear on the structure, this method is also effective but the division of strain energy damage criterion by regions and following normalization processing are needed. The details are listed as:
Then can be expressed by:
Based on Eq. (14), the integrated damage criterion aiming at multiple damages is given. The integrated damage identification method will be validated by finite element analysis and well-designed experiments afterwards.
3. Numerical and experimental investigation
3.1. Numerical validation with FEM
A cantilever beam with a single damage and multiple damages is chosen in the example. In the numerical analysis, the model strain energy method, the natural frequency sensitivity method as well as the presented method are respectively used. The corresponding damage identification results are compared with each other.
The geometrical parameters and physical parameters used in the numerical analysis are listed as follows. The length of the beam is 1000 mm. The cross section area of the beam is 150 mm2. The elastic modulus is 105000 MPa. The moment of inertia is 112.5 mm4. The density is 1.75×10⁻⁶ kg/mm3. As can be seen in Fig. 1(a), the cantilever beam structure is uniformly divided into 20 sections by 21 points along the length direction for conventionally describing the location of damages. Location of 1st point is the fixed end while the location of 21st point is the free end. The length of each section is 50 mm and the section number keeps consistent with the number of its left point. The three-dimensional FEM model of the structure is established by using MSC.Nastran as shown in Fig. 1(b).
Fig. 1Beam specimen
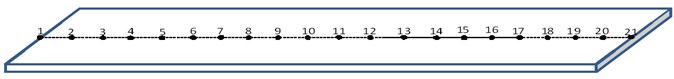
a) Geometrical model
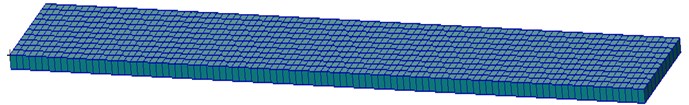
b) Three-dimensional FEM model
1) Condition 1: single damage.
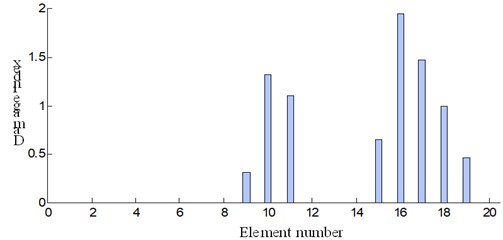
The preset damage with 10 % stiffness degradation is on the 16th section located at the location of 750 mm to 800 mm from the fixed end. Firstly, the damage detection result by using the modal strain energy method is shown in Fig. 2. It is clear that the peak occurs on the 16th section, which is just the location where damage shows up. So, the modal strain energy method is effective for locating the damage. However, the damage extent is so larger than the setting value that it is unreasonable. It is indicated that the modal strain energy method cannot be used for quantifying the damage extent.
Fig. 2Damage detection results obtained by modal strain energy method
Then, the damage extent can be predicted by using the natural frequency sensitivity method and additional masses are added on the structure at certain location to improve the accuracy of prediction. In this case, three mass blocks are added to the 18th point, 19th point and 20th point as in shown in Fig. 1(a). The mass of each block is six times that of the corresponding section, since the damage identification precision is higher when the mass of adding blocks is about five to eight times that of the corresponding beam section according to the literature [23]. Frequency sensitivity analysis is based on the results from modal analysis by MSC.Nastran and the damage extents before and after adding masses are plotted in Fig. 3.
Fig. 3Damage extent comparison of three damage identification schemes
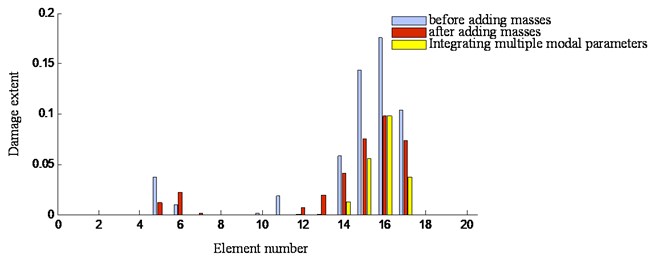
As can be seen from Fig. 3, the results denoted by the grey bar are obtained by the natural frequency sensitivity method before adding masses. Clearly, the highest bar occurs on the 16th section where the damage was preset. It is denoted that there is exiting a damage on the location and the damage extent is about 0.179 denoted by the bar value. Compared with the setting damage value 0.1, the error is 79.1 % which cannot be accepted. By contrast, for the natural frequency sensitivity method after adding masses, the damage extent denoted by the brown bar is 0.098 and the error is only 1.7 % compared with the setting value 0.1. Apparently, the damage identification precision is dramatically increased by using the additional masses. However, there is an interferential peak appearing on the location of the 5th and 6th sections for regardless of whether masses are added to the structure or not. It is indicated that the structure damage cannot be accurately detected only based on the natural frequency sensitivity method.
The presented method by integrating multiple modal parameters is also used for the beam structure and the damage extent is shown together in Fig. 3 with yellow bar. It can be seen that the integrated method successfully eliminates the interference on the location of the 5th and 6th section and still keep the same precision to the natural frequency sensitivity method. It is indicated that the presented method established through combining the modal strain energy and the natural frequency sensitivity before and after adding masses can locate and quantify damages on beam structures in an accurate way.
2) Condition 2: multiple damages.
In this section, multiple damages on the beam are studied. Concretely, two damages with 30 % and 10 % stiffness degradation are set on the locations of the 10th and 16th sections, respectively. The added masses are the same as condition 1.
The damage detection results based on the modal strain energy method is shown in Fig. 4. Obviously, the damage can be localized while the damage extent cannot be reasonably estimated.
Fig. 4Damage detection results obtained by modal strain energy method
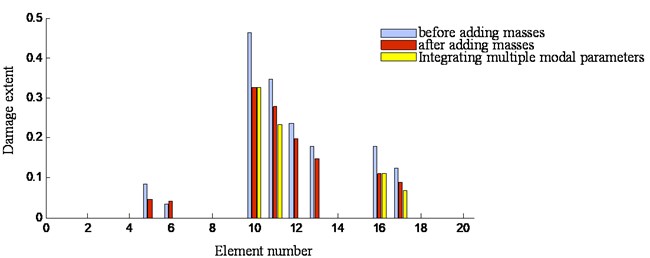
The damage detection results obtained by the frequency sensitivity method before and after adding masses are shown in Fig. 5. In the figure, the results denoted by the grey bar are obtained by the natural frequency sensitivity method before adding masses. Clearly, there are three distinctly local peaks appearing on the location of the 5th section, 10th section and 16th section, respectively. Actually, the last two peaks occurred on the 10th section and 16th section are the preset damages while the weak peak on the 5th section is an interference. So, there is confusion to detect accurately multiple damages on the beam structures by the natural frequency sensitivity method.
The results obtained by the presented method is also shown together in Fig. 5 with yellow bar. It can be seen that the interference on the 5th section is eliminated. It is indicated that the presented method also works well in the case with multiple damages on beam structures.
Fig. 5Damage extent comparison of three damage identification schemes
3.2. Experimental validation
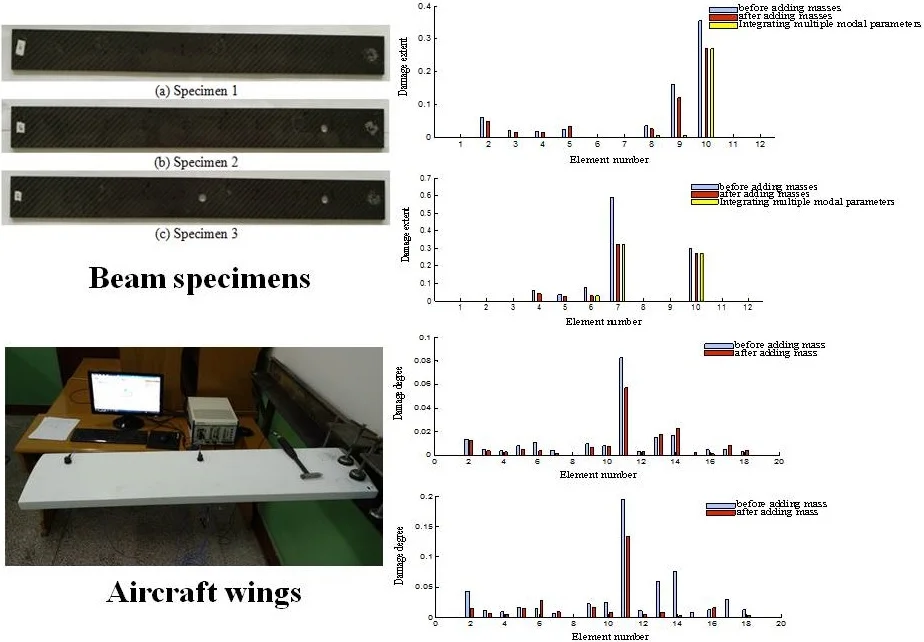
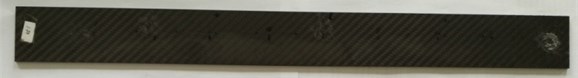
For the experimental validation, beam specimens are chosen with the same dimension. Both single damage and multiple damage cases are considered. The dimension for each specimen is as follows: Length: 480 mm; Width: 50 mm; Thickness: 3 mm.
There are preset damages with different extents on the three specimens. As can be seen from Fig. 6, specimen 1 is intact while specimen 2 and specimen 3 are damaged. There is only one hole on specimen 2 while two holes on specimen 3. The diameter of the hole is 10 mm. The hole on specimen 2 is 100 mm from the left end of the beam. The two holes on specimen 3 are 280 mm and 400 mm from the left end of the beam, respectively. For convenience of description, the beam specimen is divided into twelve elements and the corresponding damage locations are shown in Table 1.
Fig. 6Beam specimens and
a) Specimen 1
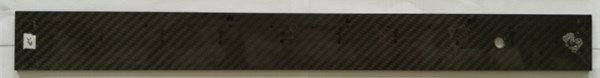
b) Specimen 2
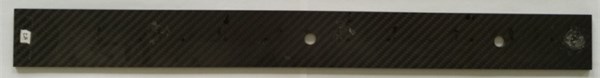
c) Specimen 3
Table 1Damage locations on beam specimens
Beam specimen | Damage locations |
1 | None |
2 | Damage occurs at 10th element for specimen 2 |
3 | Damage occurs at 7th and 10th element for specimen 3 |
The main experimental system equipment including hammer, acceleration sensors and so on are listed in Table 2. The modal test software ModalVIEW is adopted for establishing the model, obtaining responses and data processing. In testing, the sampling frequency is 1024 Hz and the frequency response function curves are obtained through linear average of three measurements.
Table 2Experimental system equipment
Equipment | Type |
Slot | Pxle-1082 |
Hammer | PCB 086C03 |
Acceleration sensor | PCB 356A16 |
Dynamic signal acquisition card | Pxle-4499 |
Modal testing is respectively carried on the three beam specimens. The data obtained from the experiment are used for the damage identification. The detection results for specimen 2 obtained by using the frequency sensitivity method before and after adding masses as well as the integrated method are compared in Fig. 7. The results denoted by the grey bar are obtained by the natural frequency sensitivity method before adding masses and that by brown bar are obtained by the natural frequency sensitivity method after adding masses, respectively. As can be seen from the figure, there are several local peaks confusing the damage detection. However, for the integrated method denoted by the yellow bar, there is only one peak, which indicates the damage occurs at the 10th element. It is the location where the hole had been preset. Also, the damage extent is denoted as 0.28, which is reasonable.
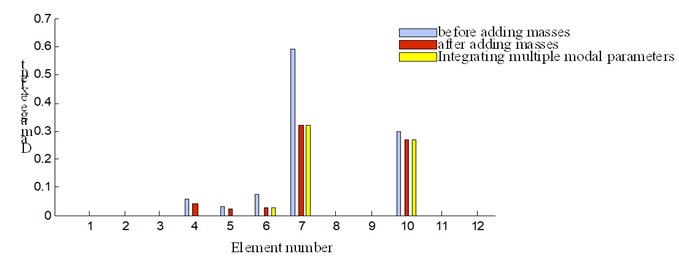
The detection results for specimen 3 obtained by using the frequency sensitivity method before and after adding masses as well as the integrated method are compared in Fig. 8. As can be seen from the figure, there are several local peaks confusing the damage detection for the frequency sensitivity method before and after adding masses. However, for the integrated method denoted by the yellow bar, there is only two peaks, which appears at 7th element and 10th element. It is the exact location where the hole had been preset. Moreover, the damage extents for those two locations are respectively 0.31 and 0.27, which are close to that of the specimen 2.
Fig. 7Identification results of three damage identification methods for specimen 2
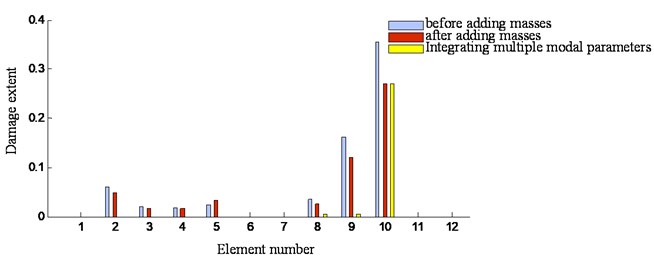
Fig. 8Identification results of three damage identification methods for specimen 3
Besides, when comparing specimen 2 with specimen 3, the interference is larger for using the frequency sensitivity method especially in the single damage case because of the symmetry problem as indicated before. By contrast, for multiple damages at different locations, the symmetry problem is not prominent. In overall, for detecting damages on beam specimens, the integrated method is better than solely using the frequency sensitivity method.
4. Engineering application
Damage identification has a wide range of application in different structures, such as offshore structures [16], bridges [30], concrete frames [31] and blade [32]. In this study, the proposed method is used for aircraft wings.
Firstly, two same rectangle wing test specimens with a beam-ribbed structure are prepared, as shown in Fig. 9. The wing skin is made of glass fiber reinforced plastics and the wing beam and rib are made of wood. The structural parameters are listed in Table 3. The No. 1 specimen is used to simulate the damaged wing while the No. 2 specimen is used to simulate the undamaged one. For No. 1 specimen, different damage severities are produced step by step through punching holes, making cracks and destroying spars. Damage identification results obtained by the strain energy method, the frequency sensitivity method as well as the integrated method are compared in detail.
Table 3Structural parameters of the wing specimen
Length/mm | Wing root/mm | Wing tip/mm | Weight/gram |
1000 | 255 | 255 | 696 |
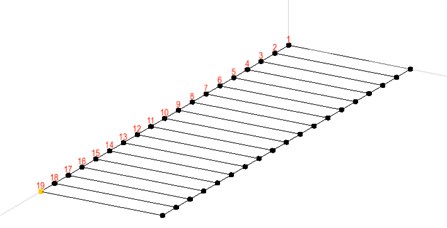
The wing specimen is equally divided into 20 sections and 19 measure points (excluding the fixed end and the free end) are plotted on the wing surface. Two acceleration sensors are arranged on the 10th and 18th measure points, as shown in Fig. 10.
Fig. 9Wing specimens
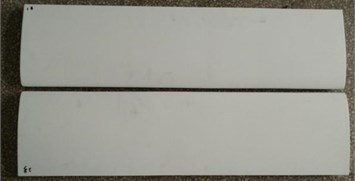
a) Span wise of wing
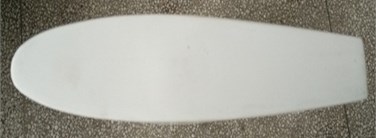
b) Section of wing
Fig. 10Images of experimental system and sensor arrangement
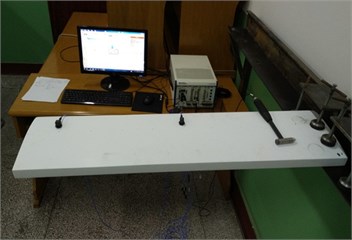
a)
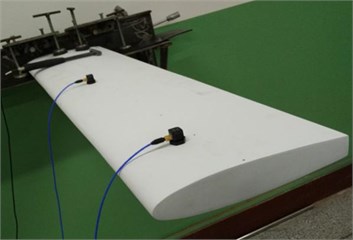
b)
In testing, the main experimental system equipment is listed in Table 2 and the structure model of the wing for modal test is established in ModalVIEW as shown in Fig. 11. The sampling frequency is also 1024 Hz and the average results of frequency response function are obtained by three measurements.
Fig. 11Drawing structure model
The damage of the wing are created by punching holes, making cracks and destroying spars, as shown in Fig. 12. For damage case 1, a hole with a diameter of 1cm on the 11th measure point is made on the wing as shown in Fig. 12(a). For damage case 2, a more severe damage is made on the wing by adding a crack with 2 mm long on both sides of the hole as shown in Fig. 12(b). The sizes of damage area for case 3 and case 4 are 1 cm by 5 cm and 1 cm by 8.5 cm respectively. For case 5, the beam of the wing is destroyed. The damage case 6 is the worst. The rectangle damage area is with the size of 1 cm by 12 cm and the beam of the wing is completely destroyed.
The modal tests are carried out on both the undamaged wing and the damaged one. The additional masses in this test are represented by two bottles loaded with sand as shown in Fig. 13(a). They are placed close to the free end of the wing. The mass of additional blocks is an empirical value. It is chosen as six times the mass of the corresponding wing section based on experiments of damage identification errors under different additional masses as shown in Fig. 13(b).
Fig. 12Damage cases
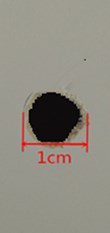
a) Damage case 1
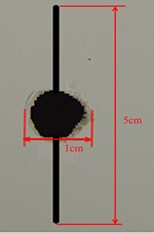
b) Damage case 2
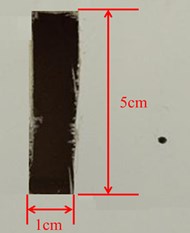
c) Damage case 3
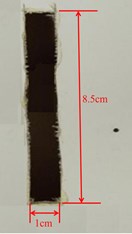
d) Damage case 4
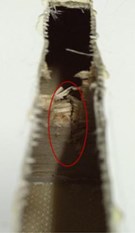
e) Damage case 5
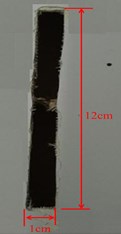
f) Damage case 6
Fig. 13Choose of additional masses
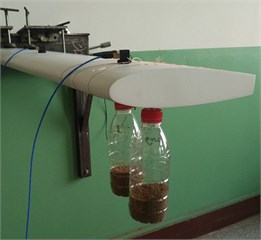
a) Illustration of additional masses
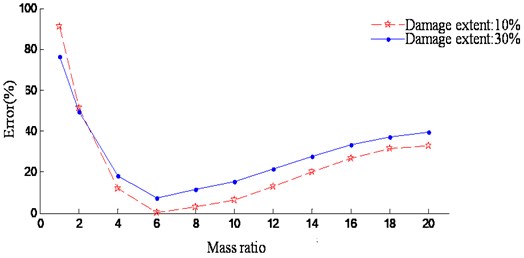
b) Experiment results under different additional masses
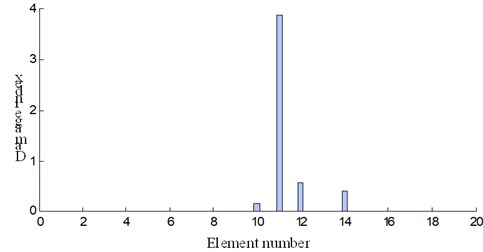
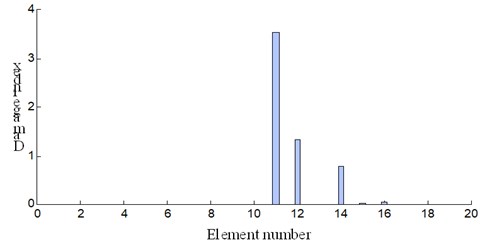
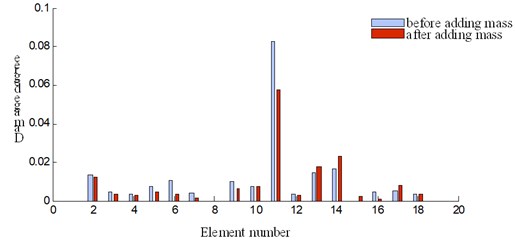
The damage identification results based on modal strain energy of both cases are shown in Fig. 14. As can be seen from Fig. 14, the higher peak showed up at element 11 and it can be deduced that damage occurs at this location. The damage degree for each element before and after adding mass is shown in Fig. 15.
As can be seen from Fig. 15, peak shows up at element 11 and it can be concluded that damage occurs at this location. For condition 1, the damage degree for element 11 is 0.083 without additional mass while it is 0.058 with additional mass as shown in Fig. 15(a). For condition 2, the damage degree for the 11th elements is 0.196 and 0.134 before and after adding mass respectively. The overall trend of the damage degree is lower after adding mass. In addition, the damage degree is more severe at working condition 2, which is the common sense. However, the damage disturbance shows up at the symmetrical position of damaged location.
Fig. 14Damage index results using modal strain energy method
a) Damage condition 1
b) Damage condition 2
Fig. 15Damage identification results before and after adding mass
a) Damage condition 1
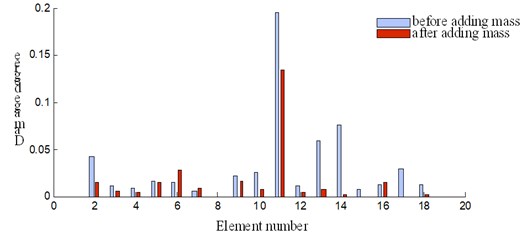
b) Damage condition 2
The presented method by integrating multiple modal parameters are used to localize and quantify the damaged wing. The damages identification results are shown in Fig. 16.
It can be seen that, the damage location is merely detected by the highest peak on the 11th measure point. Furthermore, for damage case 1, the damage extent on the 11th element is 0.058 (see Fig. 16(a)) and that is 0.134 for damage case 2 (see Fig. 16(b)). Apparently, the damage extent of case 2 is more severe than that of case 1. It is illustrated that the results are reasonable. Further, other damage cases in Fig. 12 are investigated by the presented integrated method. The results on locating and quantifying the damage extent of the wing are plotted in Fig. 17.
Fig. 16Damage identification results by integrating multiple modal parameters
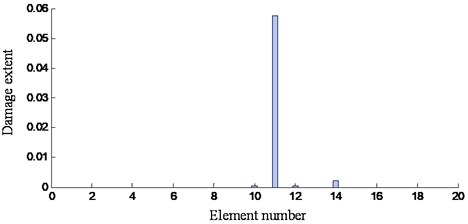
a) Damage case 1
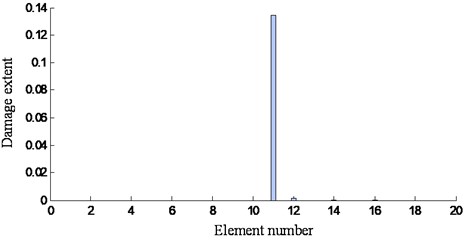
b) Damage case 2
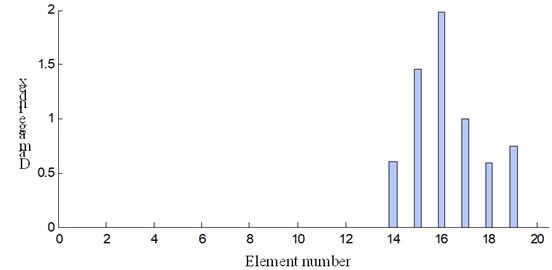
Fig. 17Damage extent for all damage cases
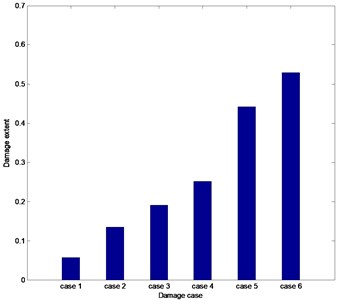
As can be seen from Fig. 17, the calculated damage extent increases accordingly along with the aggravation of the preset damage on the wing. The damage extent is relatively smaller when damage shows up at wing skin. However, when the damage occurs on the wing beam, damage extent increases drastically, which can be found through comparing the damage case 4 and case 5. The main reason is that the beam is the primary bearing section for the wing and its integrity is crucial for the wing structure. It is apparent that the results obtained by the presented integrated method are reasonable.
5. Conclusions
A damage identification method was developed by integrating multiple modal parameters to locate the damage position and identify the damage extent on the beam structure. The corresponding fusion index is established through combining the modal strain energy and the natural frequency sensitivity before and after adding masses. Thereby, the presented method owns both the advantages of applying the modal strain energy or the frequency sensitivity to identify damages. Numerical analysis and experimental investigations were conducted. Results show that the integrated method is very effective on identifying single damage as well as multiple damages on beam structures. For engineering application, an aircraft wing specimen with different damage severity is tested by using the presented method, which is proved to be able to locate the damage position accurately and identify the damage extent reasonably. However, when adding mass blocks on the beam structure to identify damages, several parameters such as the mass, the location of added blocks could influence the accuracy of the identification results, which will be discussed further.
References
-
Adams R. D., Cawley P., Pye C. J., Stone B. J. A vibration technique for non-destructively assessing the integrity of structures. Journal of Mechanical Engineering Science, Vol. 20, Issue 2, 1978, p. 93-100.
-
Cawley P., Adams R. D. The location of defects in structures from measurements of natural frequencies. Journal of Strain Analysis, Vol. 14, Issue 2, 1979, p. 49-57.
-
Cawley P., Adams R. D. A vibration technique for non-destructive testing of fiber composite structures. Journal of Composite Materials, Vol. 13, 1979, p. 161-175.
-
Yuen M. M. F. A numerical study of the eigenparameters of a damaged cantilever. Journal of Sound and Vibration, Vol. 103, Issue 3, 1985, p. 301-310.
-
West W. M. Illustration of the use of modal assurance criterion to detect structural changes in an orbiter test specimen. Proceedings of Air Force Conference on Aircraft Structural Integrity, 1984.
-
Pandey A. K., Biswas M., Samman M. M. Damage detection from changes in curvature mode shapes. Journal of Sound and Vibration, Vol. 145, Issue 2, 1991, p. 321-332.
-
Pandey A. K., Biswas M. Damage detection in structures using changes in flexibility. Journal of Sound and Vibration, Vol. 169, Issue 1, 1994, p. 3-17.
-
Pandey A. K., Biswas M. Experimental verification of flexibility difference method for locating damage in structures. Journal of Sound and Vibration, Vol. 184, Issue 2, 1995, p. 311-328.
-
Aktan A. E., Lee K. L., Chuntavan C., Aksel T. Modal testing for structural identification and condition assessment of constructed facilities. Proceedings of 12th International Modal Analysis Conference, Vol. 2251, 1994, p. 462-468.
-
Gysin H. P. Critical application of an error matrix method for location of finite element modeling inaccuracies. Proceedings of the 4th International Modal Analysis Conference, Vol. 2, 1986, p. 1339-1351.
-
Stubbs N., Kim J. T. Damage localization in structures without baseline modal parameters. AIAA Journal, Vol. 34, Issue 8, 1996, p. 1644-1649.
-
Doebling S. W., Hemez F. M., Peterson L. D., Farhat C. Improved damage location accuracy using strain energy-based mode selection criteria. AIAA Journal, Vol. 35, Issue 4, 1997, p. 693-699.
-
Shi Z. Y., Law S. S., Zhang L. M. Structural damage localization from modal strain energy change. Journal of Sound and Vibration, Vol. 218, Issue 5, 1998, p. 825-844.
-
Shi Z. Y., Law S. S., Zhang L. M. Structural damage detection from modal strain energy change. Journal of Engineering Mechanics, Vol. 126, 2000, p. 1216-1223.
-
Shi Z. Y., Law S. S., Zhang L. M. Improved damage quantification from elemental modal strain energy change. Journal of Engineering Mechanics, Vol. 128, 2002, p. 521-529.
-
Li H. J., Yang H. Z., Hu S. L. J. Modal strain energy decomposition method for damage localization in 3D frame structures. Journal of Engineering Mechanics, Vol. 132, 2006, p. 941-951.
-
Yan W. J., Ren W. X., Huang T. L. Statistic structural damage detection based on the closed-form of element modal strain energy sensitivity. Mechanical Systems and Signal Processing, Vol. 28, 2012, p. 183-194.
-
Kim J. T., Ryu Y. S., Cho H. M., Stubbs N. Damage identification in beam-type structures: frequency-based method vs mode-shape-based method. Engineering Structures, Vol. 25, 2003, p. 57-67.
-
Carden E. P., Fanning P. Vibration based condition monitoring: a review. Structural Health Monitoring, Vol. 3, Issue 4, 2004, p. 355-377.
-
Fan W., Qiao P. Z. Vibration-based damage identification methods: a review and comparative study. Structural Health Monitoring, Vol. 10, Issue 1, 2011, p. 83-111.
-
Rims J., Sandris R., Miroslaw W., Andris C. Experimental structural damage localization in beam structure using spatial continuous wavelet transform and mode shape curvature methods. Measurement, Vol. 102, 2017, p. 253-270.
-
Friswell M. I., Penny J. E. T., Garvey S. D. A combined genetic and eigensensitivity algorithm for the location of damage in structures. Computers and Structures, Vol. 69, 1998, p. 547-556.
-
Yang Q. W., Liu J. K. A coupled method for structural damage identification. Journal of Sound and Vibration, Vol. 296, 2006, p. 401-405.
-
Hu S. L. J., Wang S. Q., Li H. J. Cross-modal strain energy method for estimating damage severity. Journal of Engineering Mechanics, Vol. 132, 2006, p. 429-437.
-
Guo H. Y. Structural damage detection using information fusion technique. Mechanical Systems and Signal Processing, Vol. 20, 2006, p. 1173-1188.
-
Jiang S. F., Zhang C. M., Koh C. G. Structural damage detection by integrating data fusion and probabilistic neural network. Advances in Structural Engineering, Vol. 9, Issue 4, 2006, p. 445-457.
-
Seyedpoor S. M. A two stage method for structural damage detection using a modal strain energy based index and particle swarm optimization. International Journal of Non-linear Mechanics, Vol. 47, 2012, p. 1-8.
-
Dawari V. B., Vesmawala G. R. Structural damage identification of beam structures using two stage method based on modal strain energy indicators and artificial neural networks. Journal of Vibroengineering, Vol. 18, Issue 1, 2016, p. 119-128.
-
Yang Q. W., Liu J. K. Structural damage identification by adding given masses. Engineering Mechanics, Vol. 26, Issue 5, 2009, p. 159-163.
-
Stubbs N., Kim J. T., Farrar C. R. Field verification of a nondestructive damage localization and severity estimation algorithm. Proceedings of 13th International Modal Analysis Conference, Vol. 1, 1995, p. 210-218.
-
Zembaty Z., Kowalski M., Pospisil S. Dynamic identification of a reinforced concrete frame in progressive states of damage. Engineering Structures, Vol. 28, 2006, p. 668-681.
-
Wang Y. F., Liang M., Xiang J. W. Damage detection method for wind turbine blades based on dynamics analysis and mode shape difference curvature information. Mechanical Systems and Signal Processing, Vol. 48, Issues 1-2, 2014, p. 351-367.
About this article

