Abstract
The fuzzy logic method has been used widely in civil and earthquake engineering, but there is no comprehensive point of view for utilizing fuzzy approach in order to obtain ground motion prediction equations (GMPEs) for probabilistic seismic hazard analysis (PSHA). Hence, fuzzy magnitude–distance method as a new approach for choosing GMPEs in the process of PSHA, is developed in this research through the selection of the ruling peak ground acceleration (PGA) of each common cell (the combined cell of earthquake intensity and site to source distance). The presented method reduces the need for engineering judgments in seismic analysis based on a newly developed benchmark. It enables designers to not only determine the range of acceptable fuzzy results but also introduces a concept which ensures the selection of initial well-suited GMPEs for the analysis.
1. Introduction
Generally, a seismic hazard analysis is the assessment of earthquake occurrence in a geographic area within a determined time and specified intensity. Investing probability of the corresponding values for a ground motion parameter (e.g., peak ground acceleration, PGA) is the main goal of probabilistic seismic hazard analysis (PSHA). Hence, Ground Motion Prediction Equation (GMPE) is the key factor which relates the ground-motion parameter to a set of explanatory variables such as earthquake magnitude, seismic source-to-site distance, source type, and local site conditions [1].
In the past decades hundreds of GMPEs have been developed for the prediction of PGA, which are gathered in a series of public reports [2-6]. Therefore, there is a challenge in PSHA for choosing desirable GMPEs in a given project. This decision is a vital step in any hazard analysis because the predicted results are strongly dependent on the chosen GMPEs. In addition, these relations strongly depend on the selected ground motion database. The practical forms used for GMPEs have evolved considerably, and they include more and more independent variables [7].
In addition to variety of parameters which make seismic analysis more complicated, PSHA have a large degree of uncertainty. Insufficient data will affect the resulting risk probabilities leading to underestimated risk. This uncertainty, as a result of incompleteness and vagueness of the seismic data, should be considered in a rationale matter. In order to overcome this uncertainty, in the present study, the concept of fuzzy logic is applied to seismic analysis, generalizing the classic PSHA to fuzzy probabilistic seismic hazard analysis (FPSHA).
The goal of the fuzzy theory is to solve high uncertainty issues, to deal with ambiguous, chaotic and conflicting information, and to handle imprecise data possessing non-statistical uncertainties [8-11]. Fuzzy-probability approach has been verified as the efficient and practical tool in seismic resilience assessment [12, 13], risk assessment in construction industry [13], flood risk assessment [14], risk assessment for oil and gas [15], safety assessment of structures [16], human health risk assessment [17], and design of water distribution network [18].
FPSHA has recently been developed in various aspects. Andric (2017) proposed a method which source-to-site distance and earthquake magnitude was defined as fuzzy-random variables [11]. Considering two types of uncertainties, including aleatory and epistemic, was the main advantage of the proposed model over the classic PSHA. Further, it enabled the evaluation of the seismic risk more precisely and assigned the corresponding membership functions to each curve of the seismic hazard. Finally, it was shown that fuzzy sets could help to integrate all the uncertainties in the process of PSHA.
In another research, a set of 22 regional and worldwide GMPEs have been selected for fuzzy GMPE classification [19]. These relations were classified in two clusters in which each one was defined to have the most dissimilarity with the others as well as having the most similarity within the cluster. The C-mean clustering algorithm was modified in order to be applicable in the research. The results confirmed that the achieved spectral ordinated from GMPEs of different clusters can meaningfully differed from each other.
Adaptive Neuro Fuzzy Inference Systems (ANFIS) is also used to obtain the Fuzzy Ground Motion Prediction Model [20]. A large subset of the NGA-West2 database was used, including 2335 records from 580 sites and 137 earthquakes. Three basic input parameters were: the moment magnitude (Mw), the Joyner-Boore distance (RJB), and Vs30. The GMPE resulting from such simple three explanatory variables ANFIS models, were shown to be comparable to the most recent NGA results [21, 22]. The main advantage of ANFIS compared to Artifical Neuronal Network (ANN) was the simplicity and one-off topology: five layers. The results showed a number of physically sound features: magnitude scaling of the distance dependency, near-fault saturation distance increasing with magnitude and amplification on soft soils.
The basic parameters () and (the number of events with magnitudes equal to or greater than a defined magnitude level) was also fuzzified in the methods of FPSHA [23]. The variables and was first converted into Gaussian fuzzy sets using -cut method. The ranges of and were chosen based on previous studies. The fuzzified variables were used in PSHA. The outputs were defuzzified using the center of area method, and fuzzy hazard curve was developed for the study region. The fuzzy procedure showed more realistic results in comparison to classic PSHA results.
One of the newest FPSHA methods is using fuzzy-based procedures for choosing and combining desirable GMPEs [24], which is grounded on initial data of attenuation relationships. Since earthquake intensity and site distance to seismic source are the strongest influencing factor for GMPEs, different regression methods were used for most GMPEs in order to form attenuation relationships. Accordingly, the relationship with the highest volume of initial data on intensity and distance presents the best result for the intensity-distance range. In fuzzy PSHA, all combinations of intensity and distance are considered for each primarily selected GMPE, and the relationship that provides the most comprehensive initial data governs in each magnitude-distance cell of a seismic grid. An important contrast between this approach and the logic tree method is that in the former, a relationship does not work in all intensity-distance cells; instead, the best relationship in each cell is involved in the final analysis. Fuzzy PSHA results are obtained in different ranges with different levels of feasibility for distinct needs and problem sensitivity.
Consequently, a crucial advantage of fuzzy PSHA is reducing the need for engineering judgment in choosing and combining GMPEs for earthquake analysis. Nevertheless, it also suffers from certain disadvantages. The current research presents a basic improvement of the previously presented approach [24] based on selecting the ruling magnitude-distance cell and by developing a criterion for applying the appropriate range of final fuzzy results. The performed analyses verified the capability of the modified method in PSHA. Reducing the need for engineering judgment in choosing GMPEs and increasing the desirability of initial GMPEs are the main novelty of the proposed procedure.
2. Research framework
In the traditional fuzzy method, the best relationship for each distance-magnitude cell in each degree of membership (DOM) is chosen for all magnitude (earthquake intensity) and distance (source-to-site distance) combinations instead of using one GMPE. The criterion for considering the best GMPE is the volume of initial data on each magnitude and distance range. The first step involves selecting a number of GMPEs for a site based on engineering judgment. In the second step, a table of intensity and distance combinations is constructed for each relationship. The resultant number of magnitude-distance cells is the smallest weight number () of each cell. In order to illustrate the procedure, the Ghodrati relationship [25] is considered, where the normalized weight number is 0.914 for magnitudes between 6 to 6.5 and also 0.497 for distances between 80 and 90 km. Thus, the result of the final magnitude-distance cell for the intensity range of 6 to 6.5 and the distance range of 80 to 90 km is the lowest of the two normalized weight values (i.e., 0.497). Tables are also constructed for other GMPEs. Finally, on the basis of the best and worst weight numbers in the tables, corresponding PGA graphs for each common cells are formed in every DOM, and PSHA is performed with an appropriate α cut at every desirable DOM.
Table 1Applicable GMPE for every magnitude-distance criterion in previous method (Gh.: Ghodrati’s relationship, Bo.: Bommer’s relationship, Am.: Ambraseys’ relationship, No.: Nowroozi’s relationship, Za.: Zare’s relationship, Gr.: Graizer’s relationship, Sa.: Sarma’s relationship)
Distance (Km) | 0-10 | 10-20 | 20-30 | 30-40 | 40-50 | 50-60 | 60-70 | 70-80 | 80-90 | 90-100 | 100-110 | 110-120 |
Magnitude (Mw, Ms) | ||||||||||||
3.5-4 | Bo. | Za. | Za. | Za. | Bo. | Bo. | Bo. | Gr. | Gr. | Gr. | Gr. | Gr. |
4-4.5 | Bo. | Bo. | Za. | Gh. | Gh. | Gh. | Gh. | Gh. | Gh. | Gr. | Gh. | Gr. |
4.5-5 | Bo. | Za. | Gh. | Gh. | Gh. | Gh. | Gh. | Gh. | Gr. | Gr. | Gr. | Gr. |
5-5.5 | Bo. | Am. | Am. | Gh. | Gh. | Gh. | Gh. | Gr. | Gr. | Gr. | Gr. | Gr. |
5.5-6 | Bo. | Am. | Gr. | Gr. | Gr. | Gr. | Gr. | Gr. | Gr. | Gr. | Gr. | Gr. |
6-6.5 | Am. | No. | Gr. | Gh. | Gr. | Gr. | Gh. | Gr. | Gr. | Gr. | Gr. | Gr. |
6.5-7 | Sa. | No. | No. | Sa. | Gr. | Gr. | Gr. | Gr. | Gr. | Gr. | Gr. | Gr. |
7-7.5 | Sa. | No. | No. | Gr. | Gr. | Gr. | Gr. | Gr. | Gr. | Gr. | Gr. | Gr. |
7.5-8 | No. | No. | Gr. | Gr. | Gr. | Gr. | Gr. | Gr. | Gr. | Gr. | Gr. | Gr. |
8-8.5 | No. | No. | No. | No. | No. | No. | No. | No. | No. | No. | Gr. | Gr. |
Table 2Applicable GMPE for every magnitude-distance criterion in the improved method (Gh.: Ghodrati’s relationship, Bo.: Bommer’s relationship, Am.: Ambraseys’ relationship, No.: Nowroozi’s relationship, Za.: Zare’s relationship, Gr.: Graizer’s relationship, Sa.: Sarma’s relationship)
Distance (Km) | 0-10 | 10-20 | 20-30 | 30-40 | 40-50 | 50-60 | 60-70 | 70-80 | 80-90 | 90-100 | 100-110 | 110-120 |
Magnitude (Mw) | ||||||||||||
3.5-4 | Bo. | Bo. | Bo. | Gh. | Gh. | Gh. | Gh. | Gh. | Gh. | Gh. | Bo. | Bo. |
4-4.5 | Gh. | Za. | Gh. | Gh. | Gh. | Gh. | Gh. | Gh. | Gh. | Gh. | Gh. | Za. |
4.5-5 | Am. | Am. | Gr. | Gr. | Gr. | Gr. | Gr. | Gr. | Gr. | Gr. | Am. | Am. |
5-5.5 | Bo. | Am. | Am. | Am. | Am. | Am. | Am. | Am. | Am. | Am. | Bo. | Am. |
5.5-6 | Gh. | Bo. | Gh. | Gh. | Gh. | Gh. | Gh. | Gh. | Gh. | Gh. | Gh. | Bo. |
6-6.5 | Sa. | Sa. | Sa. | Gr. | Gr. | Gr. | Gr. | Gr. | Gr. | Gr. | Sa. | Sa. |
6.5-7 | No. | No. | No. | Gr. | No. | No. | No. | No. | No. | No. | No. | No. |
7-7.5 | No. | No. | Gr. | Gr. | Gr. | Gr. | Gr. | Gr. | Gr. | Gr. | No. | No. |
7.5-8 | Bo. | Bo. | Bo. | Gh. | Gh. | Gh. | Gh. | Gh. | Gh. | Gh. | Bo. | Bo. |
8-8.5 | Gh. | Za. | Gh. | Gh. | Gh. | Gh. | Gh. | Gh. | Gh. | Gh. | Gh. | Za. |
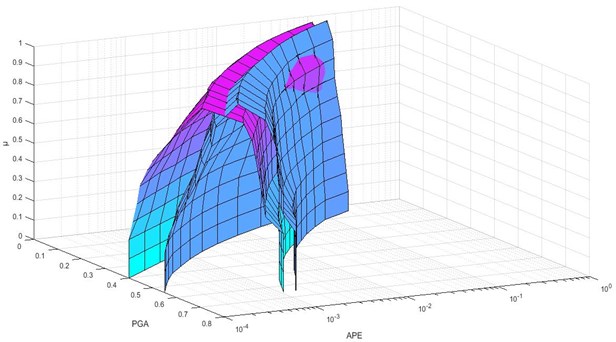
In the improved fuzzy method, the first step is devoted to improve the type of dependence between each magnitude-distance cell and initial data. In the previous fuzzy approach [24], the criteria for selecting each cell in each DOM were the lowest weight numbers of intensity and distance. In the present paper, this criterion is modified, and the number obtained from the sum of the data on intensity and distance () is used. In the previous approach, the values of 0.1 and 0.9 (ranges of data on intensity and distance are very low and relatively high, respectively) for the weight number of intensity range and the distance range, respectively, leaded to the final weight number of 0.1 for combined cells. This value is identical to the combined cell, which had the weight No. of 0.1 for both intervals. Therefore, a criterion that takes precedence over the sum of the initial data on intensity and distance must be defined. Correspondingly, the normalized sum of the data on intensity and distance () is defined as the weight number of each cell. In the Table 1 and Table 2, the ruling GMPE in each cell (DOM = 1) in the improved fuzzy method is compared with the ruling GMPE in each cell in the previous fuzzy method. According to the tables, the ruling GMPEs changed more than 80 % of the cells. The final fuzzy result is thus expected to change dramatically, and this result will be employed in practical examples. Note that the table was constructed for 1 a change that is visible in all other DOMs.
A common debate in fuzzy methods is how to use the results. In final results, a range of answers in each DOM is created for designers. However, the degree of confidence in every DOM with respect to the normalization of cells is obscure. In the traditional fuzzy method, the cell with the highest weight number in any DOM (most of the time, this value is not equal to 1) is regarded as 1, and the weight numbers of the rest of the cells also increase in the same proportion. For example, if for a GMPE, the weight numbers of cells are those indicated in the Table 3, they would be normalized in the shown form. Therefore, the validity of an answer in any DOM cannot be definitively determined.
Table 3An example of initial and actual μ
Initial | Normalized |
0.6 | 1 |
0.42 | 0.7 |
0.3 | 0.5 |
0.24 | 0.4 |
0.21 | 0.35 |
0.18 | 0.3 |
0.12 | 0.2 |
Since a number of intensity and distance cells are used in PSHA (because of source-to-site distance and initial conditions of faults), in the present study a criterion (intrinsic ) was developed in order to show the level of confidence for a result in each DOM with respect to initialized non-normalized weight numbers. The resultant is the average of all real weight numbers used in PSHA at each DOM. In PSHA, a certain number of magnitude-distance cells are used, each of which has a specific weight number. In a PSHA algorithm, then, the initial is stored with use of cell PGAs, and the average is obtained through the addition of values. Schematic procedure of the research framework is illustrated in Fig. 1.
The importance of could be explained in a hypothetical example. Assume that the analysis of two sites for and proceeds in the following form, according to Table 4. By disregarding , a designer guarantees the best result with regard to 1 in both sites. If there is a 10 % chance of failure in a life expectancy of 50 years, the PGAs of the first and second sites are 0.9 and 0.96 g, respectively. However, the use of along with simple engineering judgment indicates that 0.8 to 1 should be employed for the first site. This requirement stems from the fact that the margin of confidence for 1 is low in this site. Therefore, is very effective in appropriate analysis and engineering judgment for selecting the DOMs needed to ensure the desired quality of PSHA.
Fig. 1Schematic procedure of the proposed method
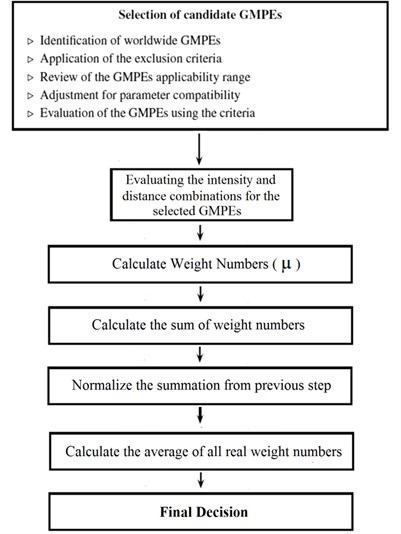
Table 4The hypothetical example of two sites with different amount of μ'
Site No. 2 | Site No. 1 | ||
Initial | initial | actual () | actual () |
1 | 1 | 0.9 | 0.96 |
0.9 | 0.9 | 0.88 | 0.75 |
0.8 | 0.8 | 0.86 | 0.72 |
0.7 | 0.7 | 0.6 | 0.66 |
0.6 | 0.6 | 0.53 | 0.53 |
0.5 | 0.5 | 0.45 | 0.45 |
0.4 | 0.4 | 0.36 | 0.36 |
0.3 | 0.3 | 0.28 | 0.28 |
0.2 | 0.2 | 0.018 | 0.018 |
0.1 | 0.1 | 0.15 | 0.15 |
0 | 0 | 0.09 | 0.09 |
Another benefit of the use of for designers and researchers revolves around the degree of confidence in the primary selection of GMPEs. Using a GMPE-based approach necessitates the selection of attenuation relationships a task that that is always grounded on engineering judgment. In the presented approach, the suitability of initially selected relationships could be also determined using . For instance, if the seismic analysis of a site with 1 reflects the potential of obtaining 0.7, this is the best outcome from the initially selected GMPEs but not necessarily the best solution to the problem. Because the initial selection of GMPE selection for this situation is not suitable, and consequently, deriving the correct result requires a reconsideration in the selected initial GMPE.
3. Practical example for Tehran
In this section, efficiency of the proposed method is demonstrated within a practical the examples. Presence of fundamental faults and seismic blind locations throughout Tehran (Rey and Shemiranat) and the probability of occurrence of catastrophic earthquakes show the high seismic hazard in Tehran district. In addition, the concentration of population and critical infrastructures in Tehran, as a capital of Iran, indicates the seismic safety status of Tehran is on top priority, and different investigations for probabilistic seismic hazard analysis are very important and necessary.
Hence, in this section, results of risk analysis using the proposed method is compared with the previously developed method [26] for the three points in Tehran:
1) Abbasabad region at the center of Tehran; longitude: 51,24; latitude: 35,44;
2) ShahrakeLale region at the northeast of Tehran; longitude: 51,18; latitude: 35,48;
3) Baghershahr region at the south of Tehran; longitude: 51,23; latitude: 35,31.
Soil type: No. 3, 300 m/s, 4.5, (4) = 0.37, 1.41, (4) = 0.63, 1.08 [26].
The values of earthquake activity rate () used above have been obtained through equal weighting of the presented two values, and the result obtained in each case has been assigned to each of the faults present in the region proportionally to its length.
The following 8 faults can be mentioned as some of the most important ones identified throughout the plan.
Table 5Characteristics of major faults in Tehran
Fault | Length (km) | |
Mosha | 200 | 7.5 |
N. Tehran | 75 | 6.9 |
Niavaran | 13 | 6 |
N-Ray | 17 | 6.1 |
S-Ray | 18.5 | 6.2 |
Kahrizak | 40 | 6.6 |
Garmsar | 70 | 6.9 |
Pishva | 34 | 6.5 |
The fuzzy PSHA result of these three regions can be observed in Figs. 2 to 5 as compared to those in the previous method.
As can be observed in all three regions, the new results are considerably different from the previous ones (10 % to 20 %). The peak ground acceleration values for these regions are stated in the Table 6, assuming 10 % chance of failure in the life expectancy of 50 years and 100 years.
Fig. 23D Comparison of hazard curves corresponding to the improved fuzzy approach and previous method for Abbasabad (the purple figure is for improved method and the blue figure is for old one)
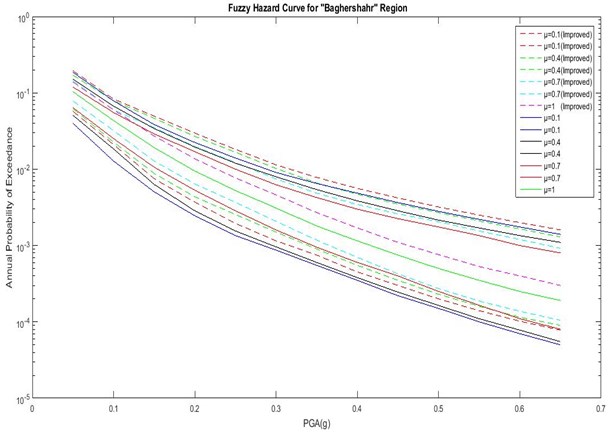
As shown in Figs. 6 to 8 and Table 7, the actual DOM () is different from classical DOM (). In Abbasabad, the highest actual DOM is low compared to the other regions ( 0.6). This suggests that, by engineering judgment, even the best result from the combination of initial chosen GMPEs is not desirable. Therefore, in order to achieve the best results in this region, it is necessary to use a different initial GMPE and performing a fuzzy analysis based on the proposed method. But in BagherShahr and Shahrak-Laleh, is acceptable, which shows the acceptability of the initial chosen GMPEs for these regions. It is noteworthy that, in Baghershahr, the DOM range of 0.8 to 1 should be chosen as the best answer based on engineering judgment. Difference between in these three DOMs is very small, and the first DOM does not have a certain superiority over two degrees. Hence the peak ground accelerationis 0.305 to 0.47 assuming 10 % chance of failure in the life expectancy of 50 years in Baghershahr. But in Shahrak-Laleh, the first DOM has a significant difference indicating the peak ground acceleration of 0.45 assuming 10 % chance of failure in the life expectancy of 50 years.
Fig. 3Comparison of hazard curves corresponding to the improved fuzzy approach and previous method for Abbasabad region
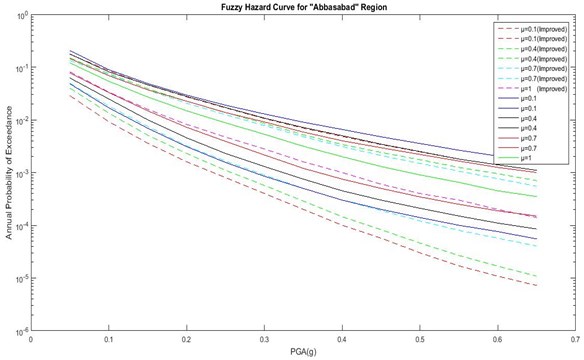
Fig. 4Comparison of hazard curves corresponding to the improved fuzzy approach and previous method for Baghershahr region
The final results of improved fuzzy PSHA regarding these three regions and their actual () are presented in Figs. 6 to 8 and Table 7.
Fig. 5Comparison of hazard curves corresponding to the improved fuzzy approach and previous method for Shahrak-Laleh region
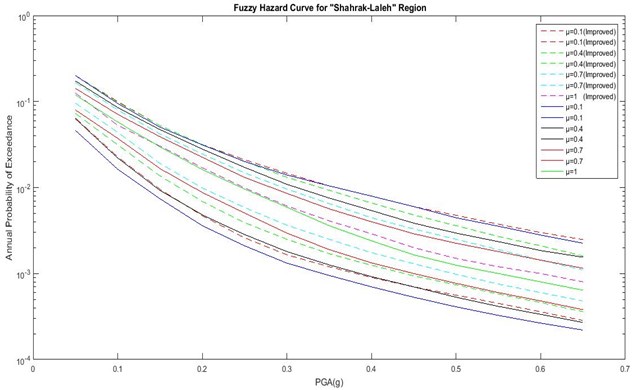
Table 6Peak ground acceleration (assuming 10 % chance of failure in the life expectancy of 50 years)
Dom | Abbasabad region | Baghershahr region | Shahrak-Laleh region | |||
Old | Improved | Old | Improved | Old | Improved | |
0 | 0.23-0.6 | 0.17-0.54 | 0.22-0.57 | 0.225-0.595 | 0.25-0.67 | 0.27-0.69 |
0.1 | 0.23-0.6 | 0.17-0.54 | 0.22-0.57 | 0.225-0.595 | 0.25-0.67 | 0.27-0.69 |
0.2 | 0.23-0.6 | 0.17-0.54 | 0.22-0.57 | 0.225-0.595 | 0.25-0.67 | 0.27-0.69 |
0.3 | 0.24-0.6 | 0.18-0.54 | 0.22-0.57 | 0.225-0.595 | 0.25-0.67 | 0.27-0.69 |
0.4 | 0.24-0.54 | 0.18-0.48 | 0.225-0.51 | 0.23-0.53 | 0.27-0.6 | 0.29-0.62 |
0.5 | 0.26-0.53 | 0.2-0.47 | 0.245-0.5 | 0.25-0.525 | 0.29-0.56 | 0.31-0.58 |
0.6 | 0.29-0.53 | 0.23-0.47 | 0.27-0.48 | 0.275-0.505 | 0.32-0.53 | 0.34-0.55 |
0.7 | 0.3-0.52 | 0.24-0.46 | 0.275-0.46 | 0.28-0.485 | 0.34-0.53 | 0.36-0.55 |
0.8 | 0.32-0.5 | 0.26-0.44 | 0.3-0.45 | 0.305-0.47 | 0.37-0.51 | 0.39-0.53 |
0.9 | 0.33-0.48 | 0.27-0.42 | 0.315-0.425 | 0.32-0.44 | 0.38-0.48 | 0.4-0.505 |
1 | 0.4 | 0.34 | 0.34 | 0.37 | 0.425 | 0.45 |
Fig. 6Hazard curves of the improved fuzzy method with actual DOMS (μ') for Abbasabad region
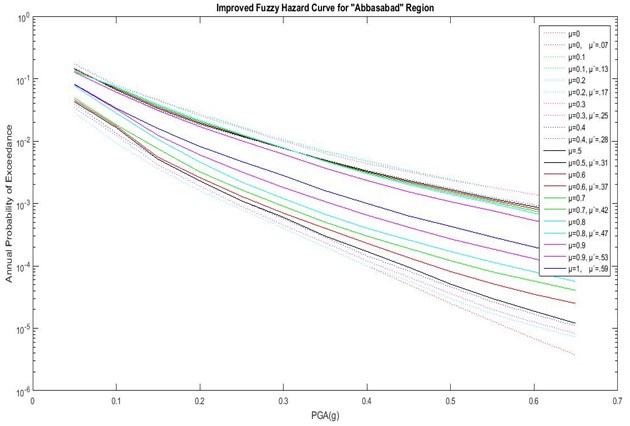
Fig. 7Hazard curves of the improved fuzzy method with actual DOMS (μ') for Baghershahr region
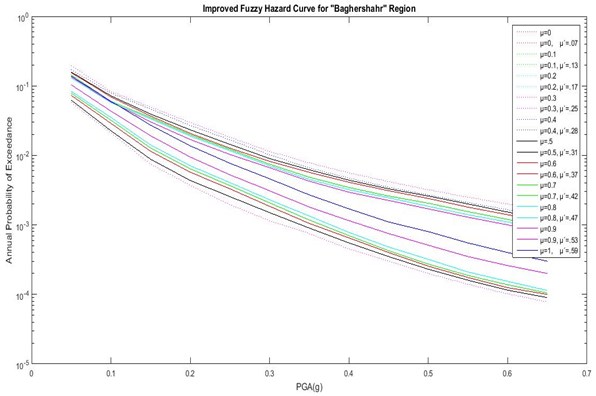
Fig. 8Hazard curves of the improved fuzzy method with actual DOMS (μ') for Shahrak-laleh region
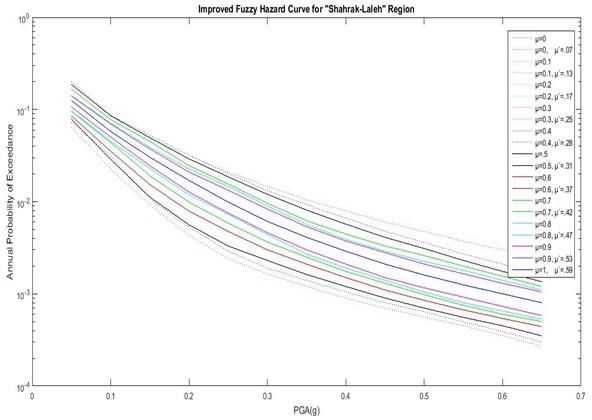
Table 7The difference of normalized DOM (μ) and actual DOM (μ')
– | Abbasabad | Baghershahr | Shahrak-Laleh |
1 | 0.60 | 0.71 | 0.75 |
0.9 | 0.53 | 0.69 | 0.55 |
0.8 | 0.47 | 0.67 | 0.54 |
0.7 | 0.43 | 0.49 | 0.47 |
0.6 | 0.37 | 0.42 | 0.40 |
0.5 | 0.31 | 0.36 | 0.34 |
0.4 | 0.28 | 0.32 | 0.30 |
0.3 | 0.25 | 0.28 | 0.26 |
0.2 | 0.17 | 0.19 | 0.18 |
0.1 | 0.12 | 0.13 | 0.12 |
0 | 0.07 | 0.07 | 0.06 |
According to the example, the proposed fuzzy method not only improves the basis of selecting and combining different GMPEs for PSHA, but also introduces a criterion called actual degree of membership (), which insures the suitability of the chosen initial GMPEs, and provides a desirable range of final fuzzy results based on simple engineering judgments.
Change in weight No. of common cells of intensity and distance causes different PSHA results leading to more precise final outcomes. Since the final results depend on initial weighing of the cells, correct selection of the ruling cells in every degree of membership reduces the probability of errors. In the present research, an innovative parameter () is introduced as sum of the initial data instead of minimizing each of the intensity and distance data. Based on the performed analysis, the presented parameter could provide more precise results with minimum dependency on engineering judgment.
As mentioned before, uncertainty in the selection of initial GMPEs is an essential challenge in the fuzzy magnitude-distance method. The variety and differences of these attenuation relationships can always affect the result of seismic analysis. It is worth mentioning that in contrast to logic tree method, the best points of each attenuation relationship are used here where the effects of choosing initial GMPEs would be the least. In the case of selecting an inappropriate GMPE in the logic tree method, outcomes of the chosen equation will affect the PSHA result causing completely different conclusion. In contrast to logic tree, choosing inappropriate GMPE in the fuzzy magnitude-distance method would have minimum effect considering that the best data of each GMPE are used. In addition, the present research introduced a new criterion () which shows the degree of desirability of initial GMPEs. Small values of demonstrate the initial GMPEs should be revised.
4. Conclusions
The present paper introduces an improved fuzzy method for choosing GMPEs as an effective way in order to reduce the need for engineering judgments and deriving different PSHA results. The main advantages and novelties of the proposed framework are as follows:
1) Reducing the need for engineering judgment in choosing GMPEs.
2) Introducing a new procedure for calculating weight numbers () through a total number of initial data on intensity and distance.
3) Reducing the uncertainties in PSHA by using the actual degree of membership () in order to choose the desirable results in different DOMs.
Performing a detailed case study including three different locations in Tehran as a high seismic region, demonstrated the capability of the proposed method. Hence, this detailed study confirmed that the proposed method can be easily used for performing PSHA in high seismic areas in order to obtain accurate results.
References
-
Douglas J. Earthquake ground motion estimation using strong-motion records: a review of equations for the estimation of peak ground acceleration and response spectral ordinates. Earth-Science Reviews, Vol. 61, Issues 1-2, 2003, p. 43-104.
-
Douglas J. Ground Motion Prediction Equations 1964-2010. PEER Report 2011/102, Pacific Earthquake Engineering Research Center, University of California, Berkeley, 2011.
-
Boore D. M., Stewart J. P., Seyhan E., AtkinsonG. M. NGA-West2 equations for predicting PGA, PGV, and 5 % damped PSA for shallow crustal earthquakes. Earthquake Spectra, Vol. 30, Issue 3, 2014, p. 1057-1085.
-
Akkar Sinan, Bommer Julian J. Empirical equations for the prediction of PGA, PGV, and spectral accelerations in Europe, the Mediterranean region, and the middle East. Seismological Research Letters; Vol. 81, Issue 2, 2010, p. 195-206.
-
Boore David M., Atkinson Gail M. Ground-motion prediction equations for the average horizontal component of PGA, PGV, and 5 %-damped PSA at spectral periods between 0.01 s and 10.0 s. Earthquake Spectra, Vol. 24, Issue 1, 2008, p. 99-138.
-
Stewart Jonathan P., Douglas John, Javanbarg Mohammad, Bozorgnia Yousef, Abrahamson Norman A., Boore David M., Campbell Kenneth W., Delavaud Elise, Erdik Mustafa, StaffordPeter J. Selection of ground motion prediction equations for the global earthquake model. Earthquake Spectra, Vol. 31, Issue 1, 2015, p. 19-45.
-
Douglas J., Edwards B. Recent and future developments in earthquake ground motion estimation. Earth-Science Reviews, Vol. 160, 2016, p. 203-219.
-
Quelch J., Cameron I. T. Uncertainty representation and propagation in quantified risk assessment using fuzzy sets. Journal of Loss Prevention in the Process Industries, Vol. 7, Issue 6, 1994, p. 463-473.
-
Antonioni G., Bonvicini S., Spadoni G., Cozzani V. Development of a framework for the risk assessment of na-tech accidental events. Reliability Engineering and System Safety, Vol. 94, Issue 9, 2009, p. 1442-1450.
-
Han Y., Davidson R. Probabilistic seismic hazard analysis for spatially distributed infrastructure. Earthquake Engineering and Structural Dynamics, Vol. 41, 15, p. 2141-2158.
-
Andric J. M., Lu D. Seismic hazard analysis based on fuzzy-probabilistic approach. 6th ECCOMAS Thematic Conference on Computational Methods in Structural Dynamics and Earthquake Engineering, 2017.
-
Adric J., Lu D. G. Seismic resilience of a bridge based on fuzzy-probabilistic approach. 5th ECCOMAS Thematic Conference on Computational Methods in Structural Dynamics and Earthquake Engineering, 2015.
-
Amiri G. G., Razeghi H., Kazemi A. Seismic hazard assessment of metropolitan Tehran by using deterministic attenuation and epicentral distribution. International Journal of Earth Sciences and Engineering, Vol. 4, Issue 6, 2011, p. 200-203.
-
Yazdi P., Zare M. Building an earthquake catalog for the middle east. Proceedings of the 15th World Conference on Earthquake Engineering, Lisbon, Portugal, 2012.
-
Singh M., Markeset T. Fuzzy reliability analysis of corroded oil and gas pipes. Safety, Reliability and Risk Analysis: Theory, Methods and Applications, 2009.
-
Möller B., Beer M. Fuzzy Randomness: Uncertainty in Civil Engineering and Computational Mechanics. Springer Science and Business Media, 2013.
-
Dutta P. Modeling of variability and uncertainty in human health risk assessment. MethodsX, Vol. 4, 2017, p. 76-85.
-
Fu G., Kapelan Z. Fuzzy probabilistic design of water distribution networks. Water Resources Research, Vol. 47, Issue 5, 2011, https://doi.org/10.1029/2010WR009739.
-
Azarbakht A., Minaei Z. Adaptive fuzzy c-mean clustering of ground motion prediction equations. Journal of Seismology and Earthquake Engineering, Vol. 19, Issue 1, 2017, p. 25-35.
-
Ameur M., Derras B., Zendagui D. Ground motion prediction model using adaptive neuro-fuzzy inference systems: an example based on the NGA-west data. Pure and Applied Geophysics, Vol. 175, Issue 3, 2018, p. 1019-1034.
-
Boore D. M., Path Thompson E. M. Durations for use in the stochastic-method simulation of ground motions. Bulletin of the Seismological Society of America, Vol. 104, Issue 5, 2014, p. 2541-2552.
-
Derras B., Bard P.-Y., Cotton F. Site-Conditions proxies, ground-motion variability and data-driven GMPEs: Insights from NGA-West 2 and RESORCE data sets. Earthquake Spectra, Vol. 32, Issue 4, 2016, p. 2027-2056.
-
Hiremath P., Khan M., Kumar K. Fuzzy probability approach in seismic hazard analysis. Soil Dynamics and Earthquake Geotechnical Engineering, Vol. 15, 2018, p. 41-49.
-
Mahmoudi Mostafa, Shayanfar Mohsenali, Barkhordari Mohammad Ali, Jahani Ehsan New fuzzy method in choosing ground motion prediction equation (GMPE) in probabilistic seismic hazard analysis. Earthquakes and Structures, Vol. 10, Issue 2, 2016, p. 389-408.
-
Ghodrati Amiri G., Mahdavian A., Dana F. M. Attenuation relationships for Iran. Journal of Earthquake Engineering, Vol. 11, Issue 4, 2007, p. 469-492.
-
Tavakoli B., Ghafory-Ashtiany M. Seismic hazard assessment of Iran. Annals of Geophysics, Vol. 42, Issue 6, 1999, p. 1013-1021.
-
Amiri M., Ardeshir A., Zarandi M. H. F. Fuzzy probabilistic expert system for occupational hazard assessment in construction. Safety Science, Vol. 93, 2017, p. 16-28.
-
Andrić J. M., Lu D.-G. Fuzzy methods for prediction of seismic resilience of bridges. International Journal of Disaster Risk Reduction, Vol. 22, 2017, p. 458-468.
-
Möller B., Graf W., Beer M. Safety assessment of structures in view of fuzzy randomness. Computers and Structures, Vol. 81, 2003, p. 1567-1582.
-
Yazdi J., Neyshabouri S. S. Identifying low impact development strategies for flood mitigation using a fuzzy-probabilistic approach. Environmental Modelling and Software, Vol. 60, 2014, p. 31-44.
About this article

