Abstract
An approach to obtain with acceptable accuracy probabilistic response transformation factors by training an artificial neural network (ANN) model is presented. The transformation factors are defined as the ratio of the seismic response of multi-degree-of-freedom structures and their equivalent single-degree-of-freedom systems, associated with a given annual exceedance rate. The approach is used for predicting the seismic response of steel framed buildings. Equations useful to obtain probabilistic response transformation factors for maximum ductility and inter-story drift, as functions of their mean annual rate of exceedance, and of the fundamental vibration period of the structure, are proposed. It is shown that artificial neural networks are a useful tool for reliability-based seismic design procedures of framed buildings and for the improvement toward the next generation of earthquake design methodologies based on structural reliability.
1. Introduction
Most of the seismic design codes are based on deterministic parameters that are focused on satisfying deterministic constraints to achieve a satisfactory design; nevertheless, due to the uncertain nature of the earthquakes and theirs effects on structures, these design criteria cannot be considered as the best alternative to solve the problem of seismic design. A more realistic design must take into account all random parameters, including the probability of failure of the structure during a given interval of time, under all the possible ground motion intensities produced by earthquakes, which represents its structural reliability. In the last decades several researchers have developed procedures for solving structural reliability problems using different methods [1, 2]. Nowadays, despite the fact that structural reliability methodologies are very common, there are serious obstacles for practical implementations, especially, because one of the main requirements of seismic design codes are their easy application by structural engineers. Therefore, the use of practical-applicable models or simplified models as single-degree-of-freedom (SDOF) systems which represent with good accuracy the structural behavior of multi-degree-of-freedom (MDOF) systems, both with similar annual rate of exceeding a structural performance parameter, is a good alternative for practical implementation in structural reliability methodologies. The ratio between the seismic response of MDOF and that of its equivalent SDOF system associated with a similar rate of exceeding a performance parameter is defined as probabilistic seismic response transformation factor (PRTF). Bojórquez et al. [3] found PRTF between the seismic response of MDOF and their equivalent SDOF systems; however, the results were limited to a few models. In the present paper a new approach to reduce the computational effort needed in the analysis is presented. The methodology is based on the use of artificial neural networks.
In recent years ANN methods of structural reliability problems have been considerably used by many researchers. Papadrakakis et al. [4] applied ANN for estimating the reliability of elastic-plastic structures; Papadrakakis and Lagaros [5] used the backpropagation neural network model oriented to the reliability-based optimization of complex structural systems. A numerical device for the reliability assessment of structural systems was developed using the feed-forward ANN [6]. Cardoso et al. [7] used a methodology for computing the probability of structural failure by combining ANN and Montecarlo simulation. Möller et al. [8] used an ANN model to optimize the total structural cost under constraints related to minimum target reliabilities specified for different limit states. The prediction of seismic-induced structural damage was estimated using ANN [9]. Serkan et al. [10] proposed an efficient model to predict the torque capacity of steel fiber reinforced concrete beams. Chin-Sheng and I-Cheng [11] developed a structural optimization package that is based on the ANN theory. Therefore, artificial neural networks can be used to give reasonable response to problems having nonlinear and complex solutions. Additional information about ANN can be found in [12, 13]. The aim of the present study is to develop a set of applicable equations for the assessment of probabilistic response transformation factors using ANN. It is important to say that the new proposed factors could be used to estimate the seismic response of complex multi-degree of freedom systems (in this case, steel frame structures) through the seismic response of simplified SDOF models having similar probability of failure. For this reason, this study is oriented toward the development of practical tools for application in new reliability-based seismic design criteria. In the following section, it is described the traditional approach to compute the structural reliability of buildings, which is crucial to calculate the probabilistic response transformation factors.
2. Evaluation of structural reliability
One of the main objectives of Earthquake Engineering is to quantify, through the consideration of all possible earthquake ground motion intensities at a site, the seismic reliability implicit in structures. Probabilistic Seismic Demand Analysis (PSDA) is used as a tool for estimating the reliability of structures through the evaluation of the mean annual frequency of exceeding a specified value of an engineering demand parameter (e.g. maximum ductility, maximum inter-story drift, etc). The PSDA considers the evaluation of the seismic hazard of a site and the conditional probability of exceeding an given an intensity measure (). In this context, the mean annual frequency of exceedance of an engineering demand parameter of interest exceeding a certain level can be estimated as follows [14]:
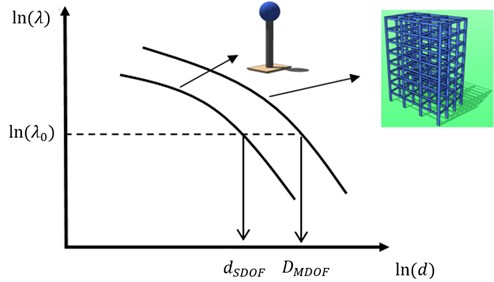
where denotes the ground motion intensity measure, is the conditional probability that a exceeds a certain level of given that the is evaluated at the ground motion intensity measure level . In addition, refers to the differential of the ground motion hazard curve for the . Hence, Eq. (1) provided the seismic demand hazard curves for a specific structure. Fig. 1 shows typical seismic demand hazard curves for a building and a SDOF system, where the parameters illustrated in the figure are discussed in the next section.
It is emphasized the importance of selecting a ground motion intensity measure appropriately. In particular, three characteristics are necessary in an : the sufficiency, efficiency, and scaling robustness. In this study, the spectral acceleration at first mode of vibration was selected as . It has been shown that is sufficient with respect to magnitude and distance [15]. However, it is important to point out that under some circumstances is not a good predictor of nonlinear structural response, and more appropriate measures are necessary (especially those related with the elastic spectral shape of the acceleration spectrum). As example, the vector , which is related to the elastic spectral shape, has resulted sufficient and efficient in many cases [16]. Other such measures include the advanced scalar proposed by [17]; the vector [18]; and the vector [19]. A recent study suggests that based on the spectral shape are the most efficient and also which results sufficient. The records used herein allow the use of a scaling criteria based on : 1) First, due to sufficiency of with respect to and ; and 2) Second, due to the similar spectral shape of the records, because the ground motion records selected for a specific site have similar values of ; and 3) The property known as scaling robustness is satisfied, and this is valid although significant bias usually occurs when increasing nonlinear structural behavior, Bojorquez and Iervolino [19] demonstrated that for scale factors in a range of 1 to 100, no significant bias occurs for important levels of nonlinear behavior (ductility demands up to six) if the records have similar values of . Within this context, Eq. (2) can be expressed as:
where is the hazard curve differential expressed in terms of . Eq. (2) was used to evaluate the structural reliability demand hazard curves of the steel frames in terms of two : ductility and inter-story drift. If a lognormal distribution is considered to evaluate , then the probability that exceeds , given , is given by:
In Eq. (3), and are the sample mean and standard deviation for , respectively, and is the standard normal cumulative distribution function. It has been shown that the maximum inter-story drift has been found to be well represented by a lognormal distribution [16], and for this reason this probability density function was considered in the present study.
3. Probabilistic response transformation factors: definition
It is well-known that most of seismic design codes are commonly based on the use of response spectra derived for SDOF systems with elasto-plastic behavior. However, the ductility and other relevant parameters (e.g., maximum inter-story drift) in actual structures may differ from those estimated for SDOF systems. As a consequence, it is desirable to consider the differences between the seismic demands in the MDOF structures and their corresponding SDOF models. This can be achieved through the use of SDOF to MDOF transformation factors. Moreover, earthquake-resistant design codes do not guaranty the same level of annual exceedance rate between the SDOF systems and complex structures [20, 21]. On the other side, the seismic design spectra or provisions recommended by the codes are not associated with structural reliability levels or prescribed annual exceedance rates [22-24]. Some trends in the seismic design of structures suggest that earthquake spectra that take into account the structural reliability must be used [24, 25]; nevertheless, for recommending the use of this type of spectra, it should be available tools that allows the use of SDOF system to represent the performance of complex structures associated to similar structural reliability levels; that is, factors that relate both responses for the same probability of exceeding certain structural response parameter. Those factors are known as probabilistic response transformation factors. The factors are estimated using seismic demand hazard curves, which are computed with Eq. (1) and are illustrated in Fig. 1. In this figure, and represent the structural demand for the single and for the MDOF systems, respectively, is the expected annual rate of exceeding the structural demand, and indicates natural logarithm. In the present study, the PRTF for maximum ductility and for maximum inter-story drift are obtained via Eqs. (4) and (5). In these equations, and are the PRTF for maximum ductility and for inter-story drift, respectively; and are the median values of the maximum ductility demand for the multi- and the SDOF systems associated with some specific annual rate of exceeding the maximum ductility ; and are the median values of the maximum inter-story drift demand for the multi- and the SDOF systems associated with some specific annual rate of exceeding the maximum inter-story drift , respectively. Note that both systems (SDOF and MDOF) are associated to the same structural reliability given by the annual rate to exceed the maximum ductility or, alternatively, the maximum inter-story drift:
The evaluation of the structural reliability by means of the demand hazard curves is described below. The probabilistic response transformation factors herein are defined as the ratio between the seismic response of MDOF system and their equivalent SDOF systems associated with a given annual exceedance rate (). The demand hazard curves are used for this purpose. Thus, the uncertainty associated with the structural response as well as all the possible interval of ground motion intensity levels in the site is considered (seismic hazard curves). In this case, the steel frames are supposed to be located in soft soil sites of Mexico City, and the seismic hazard curves used correspond to the Ministry of Communications and Transportations site [26].
Notice that to calculate the structural reliability of a specific complex building requires several nonlinear analyses, thus the computational time is quite large in comparison with the estimation of the structural reliability of SDOF systems. This motivate the present study to propose PRTF through MDOF and SDOF systems based on the well-known computational tool ANN. The following section describe the procedure to estimate PRTF using the traditional approach.
Fig. 1Example of the seismic demand hazard curves for a building and its corresponding equivalent SDOF system
4. Probabilistic response transformation factors: numerical results
4.1. Structural steel models and records selection
The two approaches described before to obtain response transformation factors are applied to five regular steel frames that were designed according with the Mexico City Building Code, 2004 [27] and subjected to 30 soft-soil ground motions recorded in the Lake Zone of Mexico City which exhibit a dominant period () of two seconds. Particularly, all motions were recorded in Mexico City during seismic events with magnitudes near to 7 or larger. Table 1 summarizes the principal characteristics of the seismic records under consideration. In this table, and represents the peak ground acceleration and velocity respectively.
Table 1Earthquake ground motions
Record | Date | Magnitude | PGA (cm/s²) | PGV (cm/s) |
1 | 19/09/1985 | 8.1 | 178.0 | 59.5 |
2 | 21/09/1985 | 7.6 | 48.7 | 14.6 |
3 | 25/04/1989 | 6.9 | 45.0 | 15.6 |
4 | 25/04/1989 | 6.9 | 68.0 | 21.5 |
5 | 25/04/1989 | 6.9 | 44.9 | 12.8 |
6 | 25/04/1989 | 6.9 | 45.1 | 15.3 |
7 | 25/04/1989 | 6.9 | 52.9 | 17.3 |
8 | 25/04/1989 | 6.9 | 49.5 | 17.3 |
9 | 14/09/1995 | 7.3 | 39.3 | 12.2 |
10 | 14/09/1995 | 7.3 | 39.1 | 10.6 |
11 | 14/09/1995 | 7.3 | 30.1 | 9.62 |
12 | 14/09/1995 | 7.3 | 33.5 | 9.37 |
13 | 14/09/1995 | 7.3 | 34.3 | 12.5 |
14 | 14/09/1995 | 7.3 | 27.5 | 7.8 |
15 | 14/09/1995 | 7.3 | 27.2 | 7.4 |
16 | 09/10/1995 | 7.5 | 14.4 | 4.6 |
17 | 09/10/1995 | 7.5 | 15.8 | 5.1 |
18 | 09/10/1995 | 7.5 | 15.7 | 4.8 |
19 | 09/10/1995 | 7.5 | 24.9 | 8.6 |
20 | 09/10/1995 | 7.5 | 17.6 | 6.3 |
21 | 09/10/1995 | 7.5 | 19.2 | 7.9 |
22 | 09/10/1995 | 7.5 | 13.7 | 5.3 |
23 | 09/10/1995 | 7.5 | 17.9 | 7.18 |
24 | 11/01/1997 | 6.9 | 16.2 | 5.9 |
25 | 11/01/1997 | 6.9 | 16.3 | 5.5 |
26 | 11/01/1997 | 6.9 | 18.7 | 6.9 |
27 | 11/01/1997 | 6.9 | 22.2 | 8.6 |
28 | 11/01/1997 | 6.9 | 21.0 | 7.76 |
29 | 11/01/1997 | 6.9 | 20.4 | 7.1 |
30 | 11/01/1997 | 6.9 | 16.0 | 7.2 |
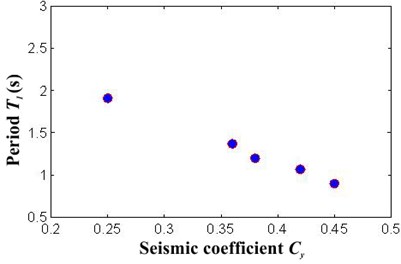
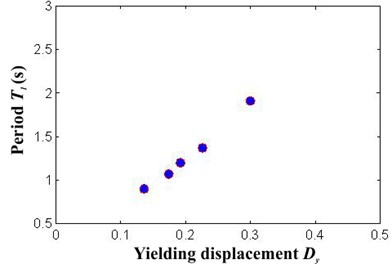
The frames, which were assumed to be used for office occupancy, have three bays of 8 m and a number of stories that range from four to fourteen. The story height is 3.5 m. The bay and inter-story dimensions are those indicated in Fig. 2. The frames were designed for ductile detailing. A36 steel and W sections were used for the beams and columns of the frames. Furthermore, Table 2 summarizes the member sizes for all frames under consideration. A two dimensional, lumped plasticity nonlinear model of each frame was prepared and analyzed. For this purpose, a bilinear model with 3 % strain-hardening was used to represent the cyclic behavior of the steel beams and columns. The columns in the first story were modeled as fixed at their bases and the beam-column connections were assumed to be rigid. Second order effects were explicitly considered. Time-history analysis was carried out for each frame. In the analysis, the first two modes of vibration were assigned 3 % of critical damping. Relevant characteristics for each frame, such as the fundamental period of vibration (), and the seismic coefficient and displacement at yielding ( and ) are shown in Table 3 (the latter two values were established from static nonlinear analysis). Note that the frames exhibit a wide range of periods. Fig. 3(a) and 3(b) compare the period with the seismic coefficient and the yielding displacement for the selected steel frames. Note that both and have a strongly dependency with the structural period in the buildings. This motivates the use of the structural period as input data for the ANN model implemented.
Table 2Summary of the member sizes of the steel frames.
FRAME | F4 | F6 | F8 | F10 | F14 | F18 |
Number of stories | 4 | 6 | 8 | 10 | 14 | 18 |
Internal columns | ||||||
Story 1 | W21×122 | W30×173 | W36×210 | W36×280 | W36×328 | W36×359 |
Story 2 | W21×122 | W30×173 | W36×210 | W36×280 | W36×328 | W36×359 |
Story 3 | W21×111 | W30×148 | W36×194 | W36×245 | W36×280 | W36×359 |
Story 4 | W21×111 | W30×148 | W36×194 | W36×245 | W36×280 | W36×359 |
Story 5 | W30×124 | W36×170 | W36×210 | W36×280 | W36×328 | |
Story 6 | W30×124 | W36×170 | W36×210 | W36×280 | W36×328 | |
Story 7 | W36×160 | W36×182 | W36×245 | W36×280 | ||
Story 8 | W36×160 | W36×182 | W36×245 | W36×280 | ||
Story 9 | W36×150 | W36×210 | W36×245 | |||
Story 10 | W36×150 | W36×210 | W36×245 | |||
Story 11 | W36×182 | W36×210 | ||||
Story 12 | W36×182 | W36×210 | ||||
Story 13 | W36×150 | W36×182 | ||||
Story 14 | W36×150 | W36×182 | ||||
Story 15 | W36×150 | |||||
Story 16 | W36×150 | |||||
Story 17 | W36×150 | |||||
Story 18 | W36×150 | |||||
External columns | ||||||
Story 1 | W18×97 | W27×146 | W36×194 | W36×280 | W36×328 | W36×359 |
Story 2 | W18×97 | W27×146 | W36×194 | W36×280 | W36×328 | W36×359 |
Story 3 | W18×86 | W27×129 | W36×182 | W36×245 | W36×280 | W36×359 |
Story 4 | W18×86 | W27×129 | W36×182 | W36×245 | W36×280 | W36×359 |
Story 5 | W27×114 | W36×160 | W36×210 | W36×280 | W36×328 | |
Story 6 | W27×114 | W36×160 | W36×210 | W36×280 | W36×328 | |
Story 7 | W36×135 | W36×182 | W36×245 | W36×280 | ||
Story 8 | W36×135 | W36×182 | W36×245 | W36×280 | ||
Story 9 | W36×150 | W36×210 | W36×245 | |||
Story 10 | W36×150 | W36×210 | W36×245 | |||
Story 11 | W36×182 | W36×210 | ||||
Story 12 | W36×182 | W36×210 | ||||
Story 13 | W36×150 | W36×182 | ||||
Story 14 | W36×150 | W36×182 | ||||
Story 15 | W36×150 | |||||
Story 16 | W36×150 | |||||
Story 17 | W36×150 | |||||
Story 18 | W36×150 | |||||
Beams | ||||||
Story 1 | W16×67 | W18×71 | W21×83 | W21×68 | W21×93 | W21×101 |
Story 2 | W16×57 | W18×76 | W21×93 | W21×93 | W21×93 | W21×101 |
Story 3 | W16×45 | W18×76 | W21×93 | W21×101 | W21×111 | W21×111 |
Story 4 | W16×40 | W16×67 | W21×83 | W21×101 | W21×111 | W21×111 |
Story 5 | W16×50 | W18×71 | W21×101 | W21×111 | W21×111 | |
Story 6 | W16×45 | W18×65 | W21×93 | W21×101 | W21×101 | |
Story 7 | W18×55 | W21×73 | W21×93 | W21×101 | ||
Story 8 | W18×46 | W21×68 | W21×83 | W21×93 | ||
Story 9 | W21×57 | W21×83 | W21×93 | |||
Story 10 | W21×50 | W21×73 | W21×83 | |||
Story 11 | W21×73 | W21×83 | ||||
Story 12 | W21×62 | W21×73 | ||||
Story 13 | W21×62 | W21×73 | ||||
Story 14 | W21×57 | W21×62 | ||||
Story 15 | W21×62 | |||||
Story 16 | W21×62 | |||||
Story 17 | W21×57 | |||||
Story 18 | W21×57 |
Fig. 2Geometrical characteristics of steel frames
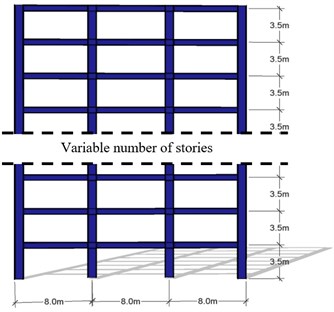
Table 3Relevant characteristics of the steel frames
Frame | Number of stories | (s) | (m) | |
F4 | 4 | 0.90 | 0.45 | 0.136 |
F6 | 6 | 1.07 | 0.42 | 0.174 |
F8 | 8 | 1.20 | 0.38 | 0.192 |
F10 | 10 | 1.37 | 0.36 | 0.226 |
F14 | 14 | 1.91 | 0.25 | 0.30 |
Fig. 3Relation between structural period and a) seismic coefficient, b) yielding displacement
a)
b)
4.2. PRTF for maximum ductility and maximum inter-story drifts
The probabilistic response transformation factors for maximum ductility and for maximum inter-story drift obtained by means of Eqs. (4) and (5) are summarized in Figs. 4 and 5. Several conclusions can be obtained from these figures. The probabilistic response transformation factors for both structural performance parameters are similar for the wide range of mean annual rate of exceeding a specific performance level. The probabilistic ductility transformation factors lie in the interval of 0.8 to 1.0. It suggests that the maximum ductility can be estimated via SDOF systems with good accuracy. Moreover, the use of response spectra for reliability-based earthquake resistant design is a good alternative to evaluate the structural performance of multi-degree of freedom steel frames for the case of maximum ductility. On the other hand, the maximum inter-story drift transformation factors are in a range of 1.4 to 1.8 which means that the maximum inter-story is larger for the steel frames, compared with their equivalent SDOF systems. Tables 4 and 5 summarizes the average values obtained for maximum ductility and maximum inter-story drift.
Fig. 4Probabilistic maximum ductility transformation factors (TPμ) related to different exceedance rates
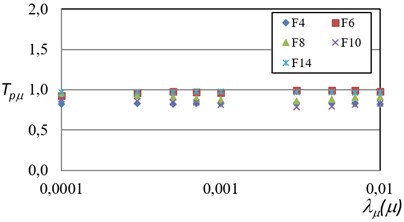
Fig. 5Probabilistic maximum inter-story drift transformation factors (TPγ) related to different exceedance rates
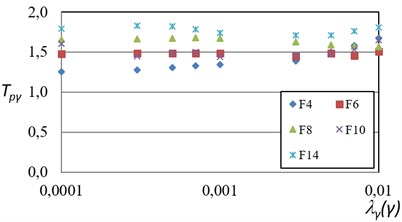
Table 4Summary of the average probabilistic maximum ductility transformation factors
Frame | Number of stories | (s) | |
F4 | 4 | 0.90 | 0.73 |
F6 | 6 | 1.07 | 0.88 |
F8 | 8 | 1.20 | 0.92 |
F10 | 10 | 1.37 | 0.90 |
F14 | 14 | 1.91 | 0.97 |
Table 5Summary of the average probabilistic maximum inter-story drift transformation factors
Frame | Number of stories | (s) | |
F4 | 4 | 0.90 | 1.41 |
F6 | 6 | 1.07 | 1.46 |
F8 | 8 | 1.20 | 1.57 |
F10 | 10 | 1.37 | 1.56 |
F14 | 14 | 1.91 | 1.77 |
The evaluation of seismic performance of complex structures under intense ground motions usually requires full nonlinear dynamic analysis to be carried out. In particular, the reliability assessment of structural systems needs several nonlinear analyses. Despite the advances in efficient computational methods there is a disproportional computational effort to solve practical reliability problems. Here, a methodology based on ANN theory is proposed.
5. Computing probabilistic response transformation factors using ANN: methodology
An artificial neural network is a mathematical model or computational model that is inspired by the way biological nervous systems processes information, such as the brain. It is composed of a large number of highly interconnected processing elements (neurons), the neurons gather together to form groups or layers. An example of a system with three layers is as follows: the first layer has input neurons, which send data via synapses (weights) to the second layer of neurons, and then, via more synapses, to the third layer or output neurons. The power processing of an ANN is due to its parallel distributed structure, and its ability to learn from some examples presented to the ANN and therefore to be generalized. Generalization refers to the artificial neuronal network producing reasonable outputs for inputs not presented during training. If an artificial neuronal network is trained properly it will be generalized, which means that the ANN had learned the full mapping for solving a problem, not only of the examples used in training; consequently, it will respond correctly to never shown patterns.
In earthquake engineering, one important aspect of the artificial neural model stems from the need to save computer time to estimate the seismic response of different building models; moreover, there is evidence that ANN can estimate the response of nonlinear problems with an adequate approximation [28, 29] specifically with the Feed-forward Backpropagation (FFBP) learning algorithm. This model has been widely used with acceptable results in several studies. For example, Günaydın and Günaydın [30] used the FFBP model to estimate the peak ground acceleration for Northwest Turkey, and a new approach for solving inverse reliability problems was proposed by Cheng et al. [31] using the FFBP model. This motivate the present study to select the FFBP to estimate probabilistic response transformation factors for steel buildings under seismic motions, which is described in the next subsection.
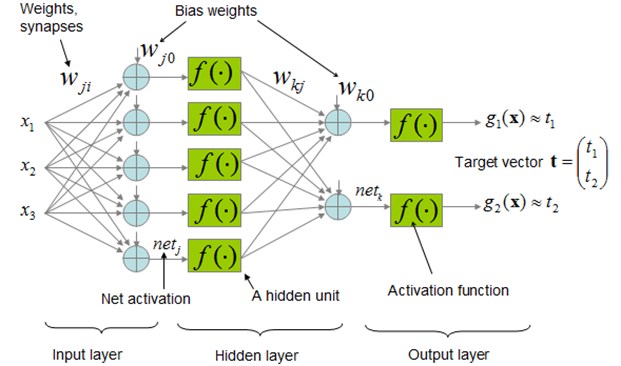
Fig. 6Schematic representation of the FFBP model
5.1. Feed-forward backpropagation networks
The Feed-forward Backpropagation Networks allow the signal to travels one way only; from input to output. FFBP networks begin with an input layer. The input layer may be connected to a hidden layer or directly to the output layer. If it is connected to a hidden layer, the hidden layer can then be connected to another hidden layer or directly to the output layer. Each layer consists of one or more neurons (a schematic representation of the FFBP model is illustrated in Fig. 6). Backpropagation proposed by Rumelhart et al. [32] is a commonly used algorithm to train ANN; the procedure for training the network is as follows: the input data is entered through the first layer, the inputs are multiplied by the connection weights; later, a bias is attached to this sum, transformed through a nonlinearity function, and transferred to the next layer. After applying the nonlinear transformation function, each neuron output passes it to each neuron of the second layer, where each of the neurons sum up the coming information and apply the nonlinear transformation as well. The same procedure is applied to the next layer to provide the network output. As the forward processing arrives at the output layer, the overall error between the network output and the actual observation is calculated. The error at the output layer propagates backward to the input layer through the hidden layer in the network to obtain the final desired outputs. During the forward pass all the synaptic weights of the network are fixed. The whole procedure is repeated back and forth with several pairs of training data sets until the error is less than a small tolerance. The weights of the output layer in the 1 learning step can be calculated by adding a multiple of the negative gradient to the weights calculated at the th step. Symbolically:
where is the vector of weights, is the variation of the weight in terms of the gradient of the error function.
After applying this technique to the output layer the update of weights connecting the hidden layers can be computed similarly.
The steps for evaluating the probabilistic response transformation factors using ANN are the following:
1) The selection of the ANN model. There are many ANN architectures such as Feed-forward Backpropagation network (here selected) and radial base functions. Each of these ANN models have their own structure and parameters.
2) The correct selection of the data set inputs and outputs. The optimal results of the ANN depend mainly on the quality of the training dataset. Furthermore, the use of importance sampling leads, in most cases, to considerable improvement in the quality of the ANN results. A fundamental part for the correct use of the ANN is the proper selection of the parameters that represent it. For the case studied here 1) the fundamental structural period and 2) the annual rate of exceeding and engineering demand parameter EDP, here named were established. Note that other parameters also can be relevant for seismic assessment purposes, for example, the seismic resistance coefficient Cy and the yielding displacement Dy. Nevertheless, a strong dependency of and with the structural period has been observed in steel buildings designed by practitioner structural engineers in Mexico, as it was shown before.
3) Training data calculation. One of the biggest problems of ANN is to estimate the minimal number of training datasets. To solve this problem, the training dataset needs to include the whole simulation domain in order to get satisfactory results. Here, five steel frames designed according with the Mexican City building code representative of mid-rise buildings were selected for the training.
4) Architecture. The results depend highly on the architecture of the ANN. Here different structures were tested and analyzed, for example varying the number of neurons, the number of hidden layers, and testing different transfer functions. Finally, a Feedforward Backpropagation network, the sigmodal transfer function for the hidden layers, and a linear function for the output layer, were selected.
5) Learning phase. A high number of different networks have to be trained in order to find the optimal one, there is not too much information available on this subject, in this paper the trial and error method is applied to find an appropriate model.
6) Once the architecture is selected and the network is trained properly, the next part is to test the network. This phase consists on the evaluation of the response of the ANN to inputs never shown in the training phase. If the test gives reasonable results, in terms of the maximum error, then the model can estimate the response of never inputs shown. The aim of this phase is to generalize the problem and then it can be summarized into simpler equations. In this case the equations obtained are those corresponding to the probabilistic response transformation factors for steel frames.
The procedure described above is applied to find probabilistic response transformation factors for predicting the maximum ductility demand and the maximum inter-story drift of steel frames by means of equivalent SDOF systems, which are performance parameters usually used for seismic assessment and design of structures. In the following sections the methodology is applied to estimate probabilistic response transformation factors for steel frames subjected to ground motions recorded at soft soil sites of Mexico City.
6. Probabilistic response transformation factors using ANN: numerical results
6.1. Artificial neural network model
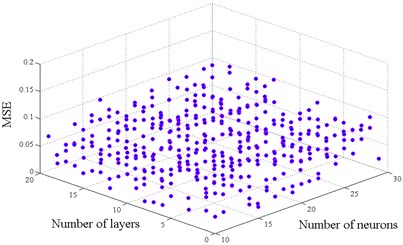
The selection of an adequate ANN model architecture is a complex task. The selection of the number of hidden layers and neurons is important in developing or training an ANN. This selection depends on the nature of the problem to be investigated, and a trial and error process is often followed to determine the adopted structure of the ANN model. In this paper several preliminary ANN models were tested by considering 1 to 30 hidden layers and 10 to 30 hidden neurons in the hidden layer. Two ANN models were proposed one for maximum ductility and the other for maximum inter-story drift. Fig. 7 shows the best results in terms of the mean square error (MSE) of different architectures established for each model.
The selected architecture is based on an input layer, one hidden layer and one output layer. In the training phase of the neural model proposed the input layer was composed of two neurons that represent and the mean annual rate to exceed a selected , ; the hidden layers is constituted by 25 neurons in both models, the output layer has one single neuron that represents the probabilistic response transformation factors.
Fig. 7Architectures tested to find the optimal model
a) For maximum ductility
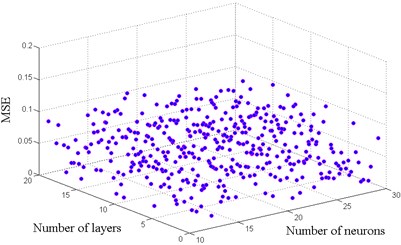
b) For maximum inter-story drift
6.2. ANN training
The backpropagation algorithm was used for the training, the transfer function in the hidden layer was sigmoid and the output layer was the linear function. The frame F8 was not included in the training phase because it is used to evaluate the performance of the ANN model. It is important to remark that the inputs and outputs of the network were not normalized. Two models were trained, one for the maximum inter-story drifts and the other for the maximum ductility. The results of the training stage show an excellent relation with the actual values with a mean square error no larger than 4 % in all the models. Figs. 8 and 9 show the training face of the network by comparing the PRTF results obtained from the analyses for maximum ductility and for maximum inter-story drift, with the ANN approach, respectively.
6.3. ANN testing
After the training has been successfully completed the testing phase was carried out. The results obtained in the testing phase did not reach the same accuracy level found during training; however, it can be observed an acceptable degree of similarity between the PRTFobtained by ANN and those obtained with the traditional approach in terms of both under consideration.
Fig. 8Comparison of the actual PRTF for maximum ductility and those obtained via ANN
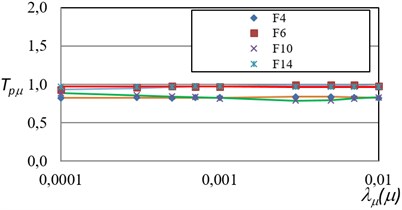
Fig. 9Comparison of the actual PRTF for maximum inter-story drift and those obtained via ANN
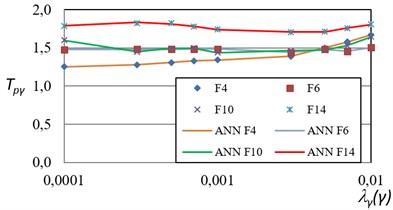
Fig. 10Test error for the 8-story model in terms of maximum ductility
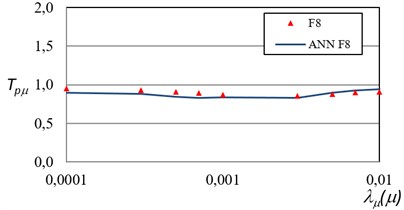
Fig. 11Test error for the 8-story model in terms of maximum inter-story drift
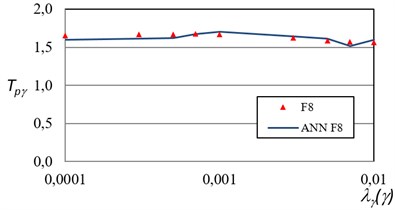
It is important to remember that the model presented in the test phase was never shown to the ANN model before, so it can be concluded that the accuracy obtained with the ANN model is satisfactory. The comparison between the ANN models and the actual values of the F8 in terms of maximum ductility, and of maximum inter-story drift are shown Figs. 10 and 11. The results indicate that its predicted output is within 7 % of the actual output for all the test cases. Therefore, the ANN can fully replace the mathematical model of the steel frames.
7. Simplified equations to calculate PRTF between steel structures and equivalent SDOF systems
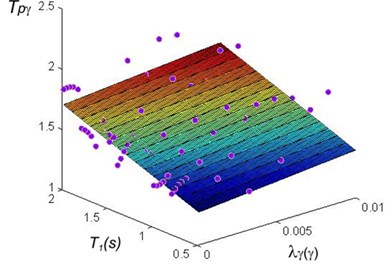
In order to find the relationship between a MDOF steel structure and the SDOF a large database of buildings should be analyzed, for this purpose a set of 40 steel frames were analyzed using the ANN models. The time required in each analysis is considerable large, the ANN model reduces this time to only a few seconds. The fundamental vibration period of the buildings was considered in a range of 0.5 to 2.0 s, and the mean annual rate of exceedance between 0.001 and 0.01. A regression analysis was carried out in order to find simplified equations that can be used for practical purposes in earthquake engineering. The results corresponding to maximum ductility and to maximum inter-story drifts are shown in Figs. 12 and 13. The regressions analysis are summarized in Eqs. (7) and (8). The maximum error obtained was about 10 % of the actual value. Note that these equations are very good related with the PRTF in terms of both maximum ductility and maximum inter-story drift:
Fig. 12Regression analysis for PRTF in terms of maximum ductility
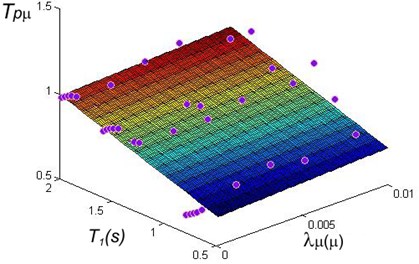
Fig. 13Regression analysis for PRTF in terms of maximum inter-story drift
8. Conclusions
This paper presents the use of Artificial Neural Networks aimed to provide a tool for reliability-based analysis of steel structural systems. The approach was applied to obtain probabilistic response transformation factors to evaluate the response in terms of the maximum inter-story drift and maximum ductility for MDOF steel frames based on the response of equivalent SDOF systems. The estimation of the factors requires several nonlinear analyses, therefore the computational effort involved in the task is considerably high; however, here it is shown that the use of Artificial Neural Networks is a good alternative for practical dynamic analysis of framed structures, obtaining results within acceptable accuracy. The computational effort is reduced with the use of ANN; moreover, equations applicable to obtain probabilistic response transformation factors for maximum ductility and inter-story drift as function of the mean annual rate of exceedance and of the fundamental vibration period of the structure are proposed. It is important to say that the new proposed factors could be used to estimate the seismic response of steel framed buildings through the seismic response of simplified SDOF models having similar probability of failure. Finally, the simplified equations proposed can be very useful in the implementation of new reliability-based seismic design procedures or for the improvement toward the next generation of seismic design methodologies based on structural reliability.
References
-
Fragiadakis M., Vamvatsikos D., Karlaftis M. G., Lagaros N. D., Papadrakakis M. Seismic assessment of structures and lifelines. Journal of Sound and Vibrations, Vol. 334, 2015, p. 29-56.
-
Chojaczyk A. A., Teixeira A. P., Neves L. C., Cardoso J., Guedes-Soares C. Review and application of artificial neural networks models in reliability analysis of steel structures. Structural Safety, Vol. 52, 2015, p. 78-89.
-
Bojórquez E., Ruiz S. E., Terán-Gilmore A. Reliability-based evaluation of steel structures using energy concepts. Engineering Structures, Vol. 30, Issue 6, 2008, p. 745-1759.
-
Papadrakakis M., Papadopoulos V., Lagaros D. L. Structural reliability analysis of elastic-plastic structures using neural networks and Monte Carlo simulation. Computer Methods in Applied Mechanics and Engineering, Vol. 136, 1996, p. 145-163.
-
Papadrakakis M., LagarosD. L. Reliability-based structural optimization using neural networks and Monte Carlo simulation. Computer Methods in Applied Mechanics and Engineering, Vol. 191, 2002, p. 3451-3507.
-
Hurtado J. E., Alvarez D. A. Neural network-based reliability analysis: a comparative study. Computer Methods in Applied Mechanics and Engineering, Vol. 191, 2002, p. 113-132.
-
Cardoso J. B., Almeida J. R., Dias J. M., Coelho P. G. Structural reliability analysis using Monte Carlo simulation and neural networks. Advances in Engineering Software, Vol. 39, Issue 6, 2007, p. 505-513.
-
Möller O., Foschi R. O., Quiroz L. M., Rubinstein M. Structural optimization for performance-based design in earthquake engineering: applications of neural networks. Structural Safety, Vol. 31, Issue 6, 2009, p. 490-499.
-
Lautour O. R., Omenzetter P. Prediction of seismic-induced structural damage using artificial neural networks. Engineering Structures, Vol. 31, Issue 2, 2009, p. 600-606.
-
Serkan E., Onur O., Fuad O. Estimation of ultimate torque capacity of the SFRC beams using ANN. Structural Engineering and Mechanics, Vol. 53, Issue 5, 2015, p. 939-956.
-
Chin-Sheng K., I-Cheng Y. Optimal design of plane frame structures using artificial neural networks and ratio variables. Structural Engineering and Mechanics, Vol. 52, Issue 4, 2014, p. 739-753.
-
Haykin S. Neural Networks: A Comprehensive Foundation. Prentice-Hall, Englewood Cliffs, 1999.
-
Martín del Brio M., Molina S. M. Redes Neuronales y Sistemas Difusos. Alfaomega, Madrid, Spain, 2002, (in Spanish).
-
Cornell C. A. Engineering seismic risk analysis. Bulletin of the Seismological Society of America, Vol. 58, Issue 5, 1968, p. 1583-1606.
-
Shome N. Probabilistic Seismic Demand Analysis of Nonlinear Structures. Ph.D. Thesis, Stanford University, 1999.
-
Baker J. W., Cornell C. A. A vector-valued ground motion intensity measure consisting of spectral acceleration and epsilon. Earthquake Engineering and Structural Dynamics, Vol. 34, 2005, p. 1193-1217.
-
Tothong P., Luco N. Probabilistic seismic demand analysis using advanced ground motion intensity measures. Earthquake Engineering and Structural Dynamics, Vol. 36, 2007, p. 1837-1860.
-
Baker J. W., Cornell C. A. Vector-valued intensity measures for pulse-like near-fault ground motions. Engineering Structures, Vol. 30, Issue 4, 2008, p. 1048-1057.
-
Bojórquez E., Iervolino I. Spectral shape proxies and nonlinear structural response. Soil Dynamics and Earthquake Engineering, Vol. 31, Issue 7, 2011, p. 996-1008.
-
Inoue T., Cornell C. A. Seismic Hazard Analysis of Multi-Degree-of-Freedom Structures. Reliability of Marine Structures RMS-8 Technical Report, Stanford, California, 1990.
-
Esteva L., Ruiz S. E., Rivera J. Reliability and performance-based seismic design of structures with energy-dissipating devices. 9th World Seminar on Seismic Isolation, Energy Dissipation and Active Vibration Control of Structures, Kobe, Japan, 2005.
-
Cornell C. A. Reliability-based earthquake resistant design: the future. 11th World Conference on Earthquake Engineering, Balkema Rotterdam, 1992, p. 2166.
-
Wen Y. K. Building reliability and code calibration. Earthquake Spectra, Vol. 11, Issue 2, 1995, p. 269-296.
-
Ghosh S., Collins K. R. Merging energy-based design criteria and reliability-based methods: exploring a new concept. Earthquake Engineering and Structural Dynamics, Vol. 35, Issue 13, 2006, p. 1677-1698.
-
Rivera J. L., Ruiz S. E. Design approach based on UAFR spectra for structures with displacement-dependent dissipating elements. Earthquake Spectra, Vol. 23, 2007, p. 417-439.
-
Alamilla J. Criterios de Diseño Sísmico Basados en Confiabilidad de Estructuras Aporticadas. Ph.D. Thesis, Universidad Nacional Autonoma de Mexico, Distrito Federal, 2001, (in Spanish).
-
Reglamento de Construcciones para el Distrito Federal. Mexico City Building Code, Gaceta Oficial del Distrito Federal, Mexico Distrito Federal, 2004, (in Spanish).
-
Hossein A. H., Hossein A. G. Prediction of principal ground-motion parameters using a hybrid method coupling artificial neural networks and simulated annealing. Computer and Structures, Vol. 89, 2011, p. 2176-2194.
-
Garzón-Roca J., Adam J. M., Sandoval C., Roca P. Estimation of the axial behaviour of masonry walls based on artificial neural networks. Computer and Structures, Vol. 125, 2013, p. 145-152.
-
Günaydın K., Günaydın A. Peek ground acceleration prediction by artificial neural networks for northwest Turkey. Mathematical Problems in Engineering, 2008, p. 91940.
-
Cheng J., Zhang J., Cai C. S., Xiao R. C. A new approach for solving inverse reliability problems with implicit response functions. Engineering Structures, Vol. 29, Issue 1, 2007, p. 71-79.
-
Rumelhart D. E., Hinton G. E., Williams R. J. Learning Internal Representation by Error Backpropagation. Parallel Distributed Processing: Explorations Microstructure of Cognition 1, MIT Press Cambridge, MA, 1986, p. 318-362.
Cited by
About this article

This research had the support of Universidad Nacional Autónoma de México under Project DGAPA-PAPIIT-IN102114. The support given by Consejo Nacional de Ciencia y Tecnología (CONACYT) to the third author under Grant CB-2011-01-167419, and the scholarship to the first author, is appreciated. Financial support also was received from the Universidad Autónoma de Sinaloa under Grant PROFAPI 2014/032.
