Abstract
With the progresses made in the field of structural and earthquake engineering and with more exact knowledge gained on seismic behavior of structures, earthquake engineering and various structures have advanced a great deal and various types of analytical methods have been developed for the assessment of structures. Dynamic analysis methods are aimed at determining the accurate behavior of structures and static analysis approaches are employed to predict structural behavior for engineering purposes. Most of nonlinear dynamic techniques are time-consuming and require a large volume of computations; moreover, performing these analyses and interpreting the obtained results need special skill and expertise. Conversely, although numerous approximations and simplifications in the nonlinear static approaches have extended and promoted their applications, they have reduced the accuracy of the results obtained by these methods. For evaluation of the seismic performance of structures, the precision and speed of the process of different analytical methods are the most important factors. This has led to the development of many novel methods based on the modern nonlinear static and dynamic analyses concepts. In this research, the results of two new different methods (modal incremental dynamic and incremental modified pushover analysis) for two 3-story and 9-story steel moment-resisting frames, as typical low and mid-rise steel lateral load-carrying systems, have been evaluated and compared with the results of the exact nonlinear incremental dynamic analysis. Based on the findings of this research, for the studied frames, the application of both analytical methods for low-rise frames gives appropriate results for all seismic records at different intensity levels; while for the mid-rise frames, the accuracy of the static analysis method has decreased; although a proper safety margin exists for this approach and also the sensitivity of the static method is less than that of the dynamic method.
1. Introduction
With the extensive use of various software programs and the incredible increase in the processing power of computers, many complicated and involved computations have become easier to perform nowadays. Also, as the field of structural and earthquake engineering has matured and more knowledge has been gained on seismic behavior of various structures, earthquake engineering has advanced a great deal and various types of analytical methods have been devised to assess the seismic behavior of structures.
One of the earliest and simplest methods of seismic analysis for structures is the equivalent static analysis method [1]. However, with the structures adopting a nonlinear behavior during an earthquake, this approach can no longer be technically and economically justified. Therefore, the nonlinear behavior of structures during earthquakes, which is accompanied by nonlinear deformations and time-varied dynamic behaviors, has prompted the development of various nonlinear analytical techniques that can predict the behavior of various structures more realistically.
In recent years, many researches and investigations have been conducted to develop nonlinear analytical methods. A major achievement of these attempts is the nonlinear static analysis (pushover) method, which rules and principles have been presented in detail in the seismic assessment guidelines for structures such as the FEMA356 [2], FEMA273 [3], FEMA440 [4], ASCE41-06 [5] and ATC40 [6]. Pushover analysis was first presented in 1970 [7, 8]; however, the application of this type of analysis in seismic evaluation of structures was introduced through the works of Gulkan and Sozen [9] and Saiidi and Sozen [10]. The pushover analysis method has various limitations such as the regardless of the variation of a structure’s vibrational properties due to the entrance into the inelastic range, not simulating the dynamic response and modal specifications of a structure throughout its range of changes, from linear to nonlinear, and not considering the effect of higher modes. In order to eliminate or reduce the existing deficiencies of the pushover analysis method two types of research were undertaken. These included the adaptive methods introduced by researchers like Bracci et al. [11], Elnashai [12] and Antoniou and Pinho [7] and the modal approaches developed by researchers like Paret et al. [13], Sasaki [14] and Geol and Chopra [15].
In light of the recent advancements, a new method has been formulated based on the static pushover analyses and by employing the nonlinear time-history analyses, in which the loadings of scaled earthquakes are used. This method entitled “Incremental Dynamic Analysis (IDA)”, was first introduced by Bertero et al. [16] and investigated by researchers such as Cornell and Shome [18], Cornell and Vamvatsikos [17] and many other researchers. Despite the advantages of the IDA method over the other existing techniques, due to its use of nonlinear time-history dynamic analysis and a multiple-degree-of-freedom model, the IDA approach is relatively complicated and requires time-consuming analyses. Based on the opinions of researchers, a method was needed that had the advantages of the IDA technique, but was simpler to use and enjoyed an acceptable accuracy. To this end, and to reduce the existing complications of the IDA method, it was used in combination with simpler techniques like various types of nonlinear static analyses.
Mofid et al. [19] presented a method that almost achieved the considered objectives. This method, which is known as the “Modal Incremental Dynamic Analysis (MIDA)”, is a combination of the IDA and MPA methods, in which the MPA approach has replaced the nonlinear dynamic time-history analysis in the IDA method [20, 21]. Azimi et al. [22] presented a simpler method compared to the MIDA that is entitled the “Incremental Modified Pushover (IMP)” method. In this analysis, a lateral loading model and also an equivalent one-degree-of-freedom system have been used to compute the target displacement of a structure, by considering the effect of higher modes.
To evaluate the existing analytical methods, Mortezaei et al. [23] have investigated the nonlinear modified static analysis method in order to assess the seismic demand of the buildings subjected to near-fault ground motions by considering the forward directivity effects. Ghodrati Amiri et al. [24] have studied and compared the in-cycle strength degradation effects for steel moment frames in the nonlinear incremental dynamic analysis method and the existing nonlinear static analysis approach.
Following up on the investigations of the above mentioned researchers, the effects of applying of Incremental Modified Pushover (IMP) and Modal Incremental Dynamic Analysis (MIDA) as new nonlinear analyses of structures, compared with exact method of nonlinear dynamic analysis of IDA have been evaluated. For this purpose, the seismic behavior of low and mid-rise of steel moment resisting frames have been analyzed. The structural models of 3- and 9-story SAC steel moment frames subjected to the seismic records adapted to the design conditions of the selected structures have been used. The results obtained for the low-rise frames have sufficient accuracy for all of the methods. With the increase in the number of stories, the accuracy of the MIDA reduces relative to the IDA method, but improves relative to the IMP approach. In computing the capacities of the studied structures, the results of the IMP analysis have an adequate safety margin which exhibit uniform variations in responses. The MIDA approach achieves adequate results relative to IMP method, however it is more sensitive than the other analyses to the specifications used for ground motions and structural modeling characteristics. Therefore, based on the results of this study, the IMP analysis probably may be used as a conservative method for the seismic design and assessment of structures.
2. Incremental Dynamic Analysis (IDA)
The Incremental Dynamic Analysis (IDA) is a parametric method in which one or several seismic records are scaled up to a certain intensity level and then are applied to a structure. The exact seismic behavior of a structure is obtained in this analysis and its results are used in the seismic performance evaluation of structures. IDA is carried out by plotting the structural Damage Measure (DM) values at each level (each step of analysis) versus the Intensity Measure (IM) values of scaled ground motion records. The IDA curves are prepared by sketching the DM versus one or several IMs based on two or more independent dimensions of IM [17]. To obtain the IDA curves for each earthquake, at each intensity level, a Nonlinear Time-History Analysis (NTHA) is performed on the scaled ground motion records; therefore, for any amount of seismic intensity measure, a corresponding amount of earthquake damage is obtained. Thus, in incremental dynamic analyses, two major criteria are used: Intensity Measure (IM) and Damage Measure (DM). In this research, the common criteria for selecting the applicable IM for building frames including the Peak Ground Acceleration (PGA) has been used. Also, for DM parameters, the maximum relative displacement of stories (interstory drift ratio) () and the maximum relative of roof displacement () have been selected.
3. Modal Incremental Dynamic Analysis (MIDA)
It is complicated and time-consuming to use Nonlinear Time-History Analyses (NTHA) at each intensity level of scaled records to plot the IDA curves. Therefore, relatively simpler analytical methods have been presented to obtain the IDA curves. One of these approaches is the Modal Incremental Dynamic Analysis (MIDA) method [19]. In this analysis, to obtain the IDA curves based on the nonlinear dynamic analysis of a multiple-degree-of-freedom (MDOF) structure, several equivalent single-degree-of-freedom (SDOF) structures are analyzed by using the modal analysis. Selecting the corresponding damping, yielding limit and strain hardening values and determining the equivalent transfer coefficient of an SDOF structure’s dynamic response are the most necessary criteria in the MIDA method. To obtain the damage measure quantity at any scaled level of an earthquake, it is needed to compute the response of structure at each mode of the equivalent SDOF system and then to get the corresponding values of this quantity in the real MDOF structure by means of the transfer coefficients. The steps of the MIDA approach have been outlined in the Fig. 1 [19].
4. Incremental Modified Pushover (IMP)
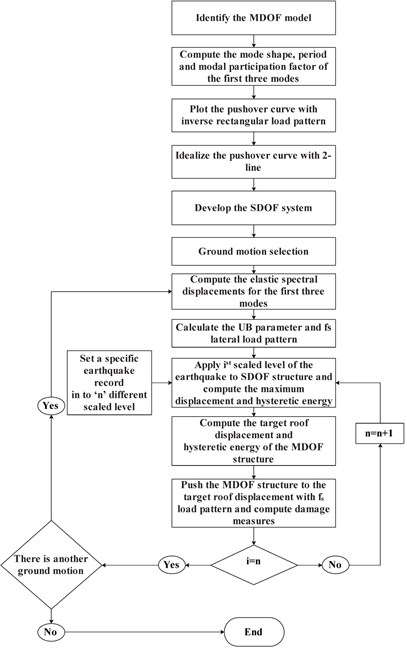
In providing simpler methods of plotting the IDA curves, a new method entitled the incremental modified pushover (IMP) that was presented by Azimi et al. [22]. In this approach, a pushover analysis is used at every intensity measure level of ground motions, and the first up to third mode effects are considered in determining the target displacement and the lateral loading. The steps of the IMP analysis for plotting the approximate curves of the IDA have been presented in the Fig. 2 [22].
5. Models, ground motions and properties of details models
The studied models and the characteristics of ground motion records used in this research and also the static and dynamic specifications of the studied structures have been presented in this section.
Fig. 1The steps of the MIDA approach
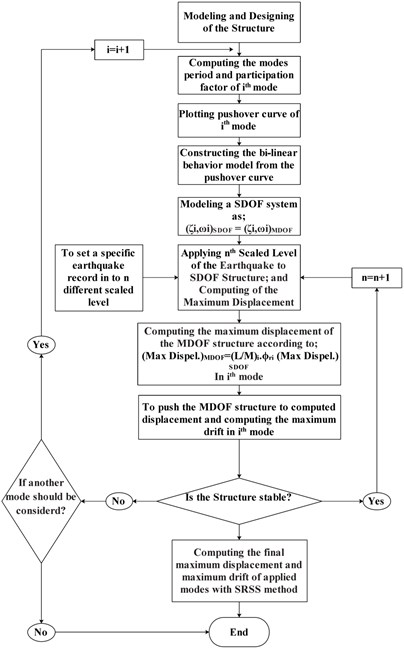
Fig. 2The process of the IMP analysis
5.1. Models
The steel moment resisting frames of SAC buildings as case studies [25] have been used to evaluation of the mentioned analyses. The 3- and 9-story SAC building structures have been designed, for official utilization, based on the UBC94 [1] and to express the behavior of short- and mid-rise of steel moment resistant frames subjected to gravity, seismic and wind loads. In the design of these buildings, no particular irregularity has been considered in the plan view and along the height. The steel moment resisting frames have been designed at the perimeter of SAC building structures to resist the lateral loading and the interior frame systems for bearing of gravity loads. Thus, the SAC type structures include a gravity load-carrying system in the interior of the structure and a lateral load-carrying system surrounding the structures. Since the subject of this research does not concern the gravity loads of a structure, the gravity load-carrying part of the structure has been ignored and this study has been focused on the lateral load-carrying system of the buildings.
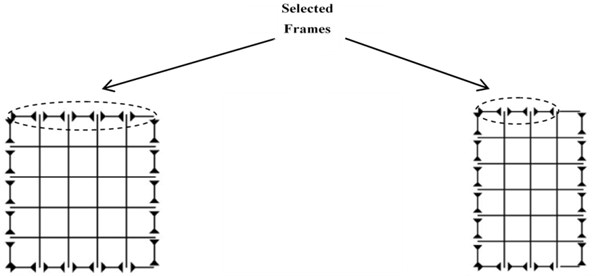
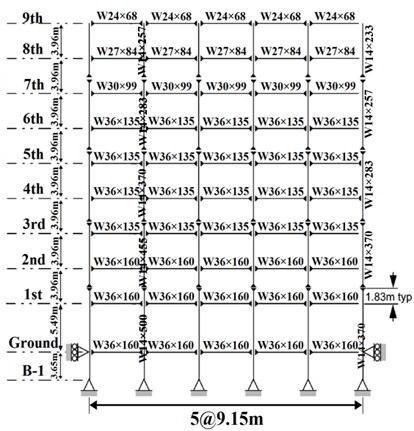
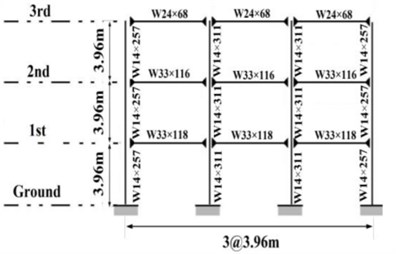
In this research, the frames in the N-S direction of buildings were selected for analysis. The plan views of building structures, selected frames and the specifications of the frames, beam and column elements have been presented in Fig. 3. The effective seismic weight of buildings for every story has been allocated equally between the two steel moment resistant frames along each direction.
Fig. 3Plans and selected moment resisting frames in SAC building
5.2. Ground motions
In order to assess the seismic behavior of the considered structures, a total of 20 ground motion records (LA01-LA20) with a return period of 475 years (with an annual exceeding probability of 10 % in 50 years) in accordance with Design Basis Earthquake (DBE) in IBC [26] and matching the seismic and site conditions of the SAC structures have been used. All of the records include severe earthquakes with a magnitude higher than 6 and the Peak Ground Acceleration (PGA) is more than 0.2 g. The specifications of these records have been given in Table 1.
5.3. Static and dynamic specifications of models
According to the descriptions of Section 5.1 and neglecting of the gravity loading systems of models, the effective seismic weights of the stories and the specifications of the beam and columns sections of the selected frames of SAC structures have been presented in Tables 2 and 3.
The mass of each building story in the nonlinear dynamic analyses, has been assumed to concentrate at the story, along the horizontal degree of freedom, and at the nodes of the beam-to-column connections. The matrix of the damping specifications for frames has been based on the Riley’s damping method and equal to 5 % for the periods of and 0.1. Also, for the nonlinear time-history analyses, the mean acceleration method of Newmark [28] has been used.
Table 1Details of Los Angeles ground motions having a probability of exceedance of 10 % in 50 years [27]
SAC Name | Record | Earthquake magnitude | Distance (km) | Scale Factor | Duration (sec) | PGA (g) |
LA01 | Imperial Valley, 1940, El Centro | 6.9 | 10 | 2.01 | 39.38 | 0.46 |
LA02 | Imperial Valley, 1940, El Centro | 6.9 | 10 | 2.01 | 39.38 | 0.68 |
LA03 | Imperial Valley, 1979, Array #05 | 6.5 | 4.1 | 1.01 | 39.38 | 0.39 |
LA04 | Imperial Valley, 1979, Array #05 | 6.5 | 4.1 | 1.01 | 39.38 | 0.49 |
LA05 | Imperial Valley, 1979, Array #06 | 6.5 | 1.2 | 0.84 | 39.08 | 0.30 |
LA06 | Imperial Valley, 1979, Array #06 | 6.5 | 1.2 | 0.84 | 39.08 | 0.23 |
LA07 | Landers, 1992, Barstow | 7.3 | 36 | 3.2 | 79.98 | 0.42 |
LA08 | Landers, 1992, Barstow | 7.3 | 36 | 3.2 | 79.98 | 0.43 |
LA09 | Landers, 1992, Yermo | 7.3 | 25 | 2.17 | 79.98 | 0.52 |
LA10 | Landers, 1992, Yermo | 7.3 | 25 | 2.17 | 79.98 | 0.36 |
LA11 | Loma Prieta, 1989, Gilroy | 7 | 12 | 1.79 | 39.98 | 0.67 |
LA12 | Loma Prieta, 1989, Gilroy | 7 | 12 | 1.79 | 39.98 | 0.97 |
LA13 | Northridge, 1994, Newhall | 6.7 | 6.7 | 1.03 | 59.98 | 0.68 |
LA14 | Northridge, 1994, Newhall | 6.7 | 6.7 | 1.03 | 59.98 | 0.66 |
LA15 | Northridge, 1994, Rinaldi RS | 6.7 | 7.5 | 0.79 | 14.945 | 0.53 |
LA16 | Northridge, 1994, Rinaldi RS | 6.7 | 7.5 | 0.79 | 14.945 | 0.58 |
LA17 | Northridge, 1994, Sylmar | 6.7 | 6.4 | 0.99 | 59.98 | 0.57 |
LA18 | Northridge, 1994, Sylmar | 6.7 | 6.4 | 0.99 | 59.98 | 0.82 |
LA19 | North Palm Springs, 1986 | 6 | 6.7 | 2.97 | 59.98 | 1.02 |
LA20 | North Palm Springs, 1986 | 6 | 6.7 | 2.97 | 59.98 | 0.99 |
Table 2Beam and column sections of 3-story SAC moment resisting frames
Story/Floor | Columns | Beams | |
Exterior | Interior | ||
1/2 | W14×257 | W14×311 | W33×118 |
2/3 | W14×257 | W14×311 | W30×116 |
3/Roof | W14×257 | W14×311 | W24×68 |
Table 3Beam and column sections of 9-story SAC moment resisting frames
Story/Floor | Columns | Beams | |
Exterior | Interior | ||
–1/1 | W14×370 | W14×500 | W36×160 |
1/2 | W14×370 | W14×500 | W36×160 |
2/3 | W14×370, W14×370 | W14×500, W14×455 | W36×160 |
3/4 | W14×370 | W14×455 | W36×135 |
4/5 | W14×370, W14×283 | W14×455, W14×370 | W36×135 |
5/6 | W14×283 | W14×370 | W36×135 |
6/7 | W14×283, W14×257 | W14×370, W14×283 | W36×135 |
7/8 | W14×257 | W14×283 | W30×99 |
8/9 | W14×257, W14×233 | W14×283 , W14×257 | W27×84 |
9/roof | W14×233 | W14×257 | W24×68 |
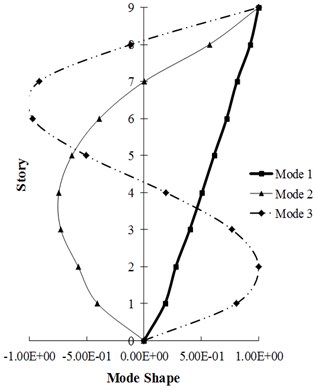
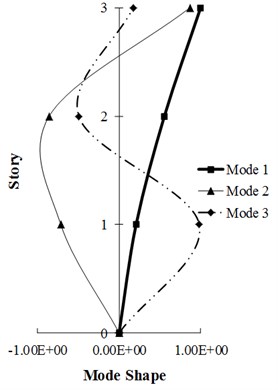
The dynamic modeling characteristics for the 3- and 9-story building frames, as values associated with the vibration periods (), modal participation factor () and the modal effective mass () of the first three modes and also the mode shapes of the first three modes of each structure have been respectively presented in Tables 4, 6 and in Fig. 4.
In Fig. 4, first three modes of studied frames for linear region vibration is shown. The lateral force pattern for these first three modes in the height of the structures follows, [15, 25], where m is the mass matrix of the structure and is the mode shape of the corresponding linear system for the th mode. These force distributions have been applied in the pushover analysis of the presented methods.
Table 4Seismic mass of building models of 3-story SAC structure
Building structure | Floor 2-3 | Roof |
Floor/roof seismic mass per frame (kg) | 957184 | 1046701 |
Table 5Seismic mass of Building Models of 9-Story SAC structure
Building structure | Floor 2 | Floor 3-9 | Roof |
Floor/roof seismic mass per frame (kg) | 1007492 | 989675 | 1073866 |
Table 6Dynamic properties of 3- and 9 story SAC structure
Building structure | First mode | Second mode | Third mode | |||
3-story | 9-story | 3-story | 9-story | 3-story | 9-story | |
Period () (sec) | 1.097 | 2.257 | 0.362 | 0.846 | 0.166 | 0.485 |
Modal Participation factor () | 1.291 | 1.322 | 0.625 | 0.497 | 0.374 | 0.356 |
Effective modal mass (%) () | 82.862 | 82.823 | 13.636 | 10.877 | 1.820 | 2.208 |
Fig. 4Mode shape of first three modes of studied frames
6. Results
After doing the dynamic analyzes, the studied structures are subjected to lateral loading until the target displacement is achieved and the results are obtained based on the first, second and third modes. By combining these results using the Square Root of Sum of Squares (SRSS) method, the results of the modal incremental dynamic analysis (MIDA) are computed. Similarly, for the IMP method, the results have been obtained by implementation an incremental loading pattern analysis and considering the effect of the first three modes on the lateral loading.
To compare the results and estimate the accuracies of the MIDA and IMP methods and also to investigate the effect of the modes on the accuracy of results, these structures have also been precisely analyzed based on a nonlinear time-history analysis using the IDA method. The OpenSees software [29] has been used to evaluate of all the analyses in this research. For derivation of the IDA curves, the Peak Ground Acceleration (PGA) has been used as the intensity measures and the maximum relative displacement between stories () and the maximum relative roof displacement () have been used as the criteria for the relative displacement between stories to determine the damage measures.
6.1. Discussion and interpretation of the results of 3-story frame
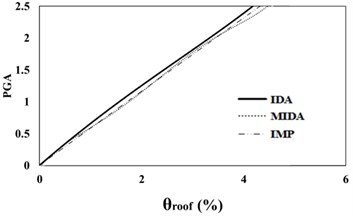
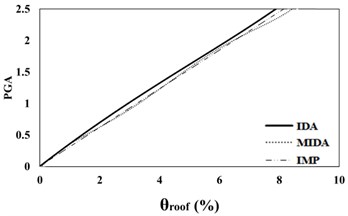
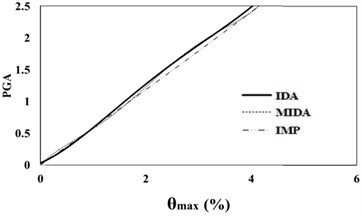
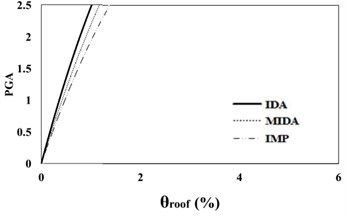
According to Figs. 5, 6, the results obtained for the 3-story SAC structure using the IDA, MIDA and IMP methods are similar for all the ground motion records. Actually, for this low-rise frame, the results obtained by the IMP analysis for all of the ground motion records and damage measures are very close to the results of the MIDA and IDA approaches, which indicates the suitability of this type of analyzes for low-rise studied frame with the steel moment resisting frame system. Also, in assessment of the results in the IMP, MIMP and MIDA methods, it can be realized that, in most cases, the IMP analysis estimates higher damage measures and results are conservative for selected earthquakes intensity levels than the other two methods. Therefore, it can be concluded that the IMP approach has achieved satisfactory results for the studied low-rise SAC frame.
6.2. Discussion and interpretation of the results of 9-story frame
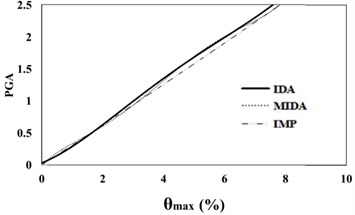
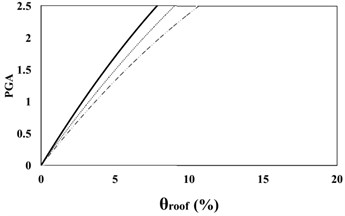
Based on Fig. 7, 8, the results of analysis for maximum relative displacement between the stories indicate that the IMP and MIDA methods produce similar results and that the amounts of errors between the results of these methods compared with the exact IDA method are identical. Although at low intensity measures, all of the three mentioned methods have the almost similar results matching to actual behavior of studied structures, with the increase in the seismic intensity levels, the errors of the IMP and MIDA approaches relative to the IDA method have increased. However, the errors between the results of the IMP and MIDA methods indicate a kind of convergence between these two techniques and show that in general, they have presented higher damage measure values compared to the IDA method. With the increase in the seismic intensity level, the accuracy of the MIDA results has been reduced; while the IMP results have exhibited almost the same as before, despite the increase in the error values. This indicates the high relative sensitivity of the MIDA method for the studied mid-rise model under different intensity of seismic levels, the ground motion records used and also the effects of the higher modes in this research. Although the IMP approach has provided more conservative results relative to both the MIDA and IDA methods, from the standpoint of error values and also the structural behavior, these two methods, especially at higher seismic levels, have been more consistent and relatively less domain of changes in responses at the slope of the IDA curves compared to the results of the MIDA method.
Fig. 516 %, 50 % and 84 % IDA curves of 3 story SAC frame structures with exact nonlinear time history analysis (IDA), MIDA and IMP based-on peak ground acceleration (PGA). Maximum relative roof displacement (θroof)
a) 16 % IDA
b) 50 % IDA
c) 84 % IDA
Fig. 616 %, 50 % and 84 % IDA curves of 3 story SAC frame structures with exact nonlinear time history analysis (IDA), MIDA and IMP based-on peak ground acceleration (PGA). Maximum relative displacement between stories (θmax)
a) 16 % IDA
b) 50 % IDA
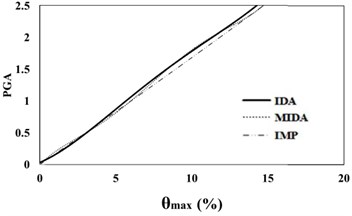
c) 84 % IDA
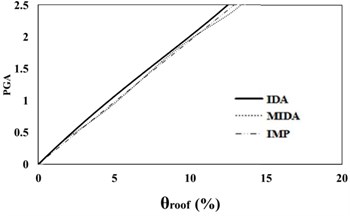
Fig. 716 %, 50 % and 84 % IDA curves of 9 story SAC frame structures with exact nonlinear time history analysis (IDA), MIDA and IMP based-on the peak ground acceleration (PGA). Maximum relative roof displacement (θroof)
a) 16 % IDA
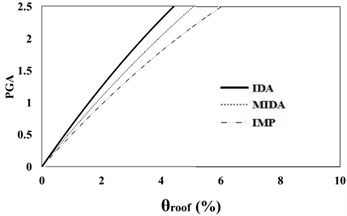
b) 50 % IDA
c) 84 % IDA
The results of analyses based on the maximum roof displacement indicate a uniform behavior for the 9-story frame at various seismic intensity levels. Although the amounts of error have increased with the increase in the seismic levels, in general, and at low seismic levels, the results of the IMP and MIDA methods are very close to each other, indicating the accuracy of the MIMP and IMP methods in applying the first three modes for low seismic intensity levels and studied mid-rise models. With the increase in the seismic intensity level, the behavior of the structure hasn’t changed considerably and this shows that the IMP analysis correctly predicts the structure’s seismic performance. Although the amount of error in the higher seismic intensity level has increased, however the amount of this error has increased with uniform and predictable results.
Fig. 816 %, 50 % and 84 % IDA curves of 9 story SAC frame structures with exact nonlinear time history analysis (IDA), MIDA and IMP based-on the peak ground acceleration (PGA). Maximum relative displacement between stories (θmax)
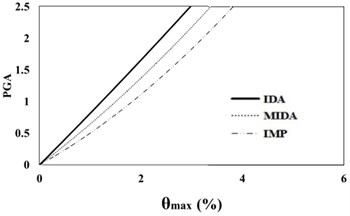
a) 16 % IDA
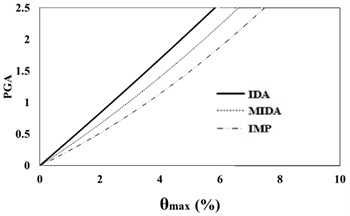
b) 50 % IDA
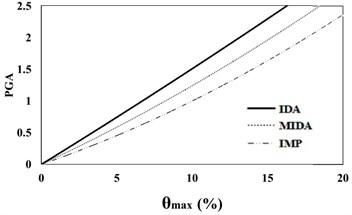
c) 84 % IDA
7. Conclusions
In this research, the accuracy of the results of the IMP and MIDA analysis as the new methods in predicting the seismic behavior of 3- and 9-story SAC frames as representation of typical low and mid-rise steel moment resisting systems was investigated and the following conclusions were obtained:
1) The application of the IMP and MIDA methods for analysis of 3-story frame has led to adequate and reliable results for all of the selected different ground motion records at any intensity measure, and the damage measure values related to the maximum relative displacement of stories and the maximum relative of roof displacement have been with a very good approximation to the exact method is estimated by IDA. Of course, the predicted displacement values (seismic demands) based on the IMP method are greater than those of the other two methods. Therefore, the results have been presented with a safety margin; however, the differences between the results are not significant and the IMP method has obtained acceptable results for the 3-story frame.
2) The results obtained by the MIDA method have some considerable errors relative to those obtained by the IDA approach; which along with various changes in the slope of the results curve indicate the sensitivity of this method to the effect of higher modes in the studied mid-rise frame. Although the IMP method generate a relatively large amount of errors, due to displaying a consistent behavior and also having smaller changes of the curve slope, this method has less sensitive to the higher modes and thus give more conservative results.
3) The accuracy of the results obtained by IMP analyzes is lower than the MIDA method; however, the IMP has more conservative results. Also, because of the relative appropriate, simple and quick processes of the IMP method in structural analysis, therefore this method may be used for the design and evaluation of structures.
4) The MIDA method based on the past researches and this study, gives mostly acceptable results for various structures; while the accuracy of the IMP approach in the analysis of tall buildings may decrease due to the effect of higher modes. However, a more consistent behavior and lower sensitivity is observed in the results obtained by the IMP method.
5) Due to the using of a nonlinear lateral deformation model in the IMP approach, in some cases, the accuracy of the IMP results in the elastic range are not so satisfactory compared to the MIDA method; in which case, an elastic lateral deformation model can be used to improve the accuracy of the results.
References
-
UBC94, UBC97. Uniform Building Code. International Conference of Building Officials, U.S.A., 1994, 1997.
-
FEMA 356. Pre-Standard and Commentary for the Seismic Rehabilitation of Buildings. Federal Emergency Management Agency, Washington, D.C., 2000.
-
FEMA 273. Building Seismic Safety Council. NEHRP Guidelines for the Seismic Rehabilitation of Buildings. Federal Emergency Management Agency, Washington, D.C., 1997.
-
FEMA 440. Improvement of Nonlinear Static Seismic Analysis Procedures. Federal Emergency Management Agency, Washington, D.C., 2005.
-
ASCE41-06. Seismic Rehabilitation of Existing Structures. American Society of Civil Engineering, 2007.
-
ATC-40. Seismic Evaluation and Retrofit of Concrete Building. Applied Technology Council, Redwood City, CA, 1996.
-
Antoniou S., Pinho R. Development and verification of displacement-based pushover procedure. Journal of Earthquake Engineering, Vol. 8, Issue 5, 2004, p. 643-661.
-
Lopez M. A Review of Existing Pushover Methods for 2D Reinforced Concrete Buildings. An Individual Study Submitted in Partial of Fulfillment of the Requirements for the Ph.D. Degree with Supervisor Dr. Pinho, Rose School, European School of Advanced Studies of Seismic Risk, 2004.
-
Gulkan P., Sozen M. A. Inelastic responses of reinforced concrete structure to earthquake motions. ACI Journal Proceedings, Vol. 71, Issue 12, 1974, p. 604-610.
-
Saiidi M., Sozen M. A. Simple nonlinear seismic analysis of R/C structures. Journal of the Structural Division, Vol. 107, Issue 5, 1981, p. 937-953.
-
Bracci J. M., Kunnath S. K., Reinhorn A. M. Seismic performance and retrofit evaluation of reinforced concrete structures. Journal of Structural Engineering, Vol. 123, Issue 1, 1997, p. 3-10.
-
Elnashai Amr S. Advanced inelastic static (pushover) analysis for earthquake applications. Structural Engineering and Mechanics, Vol. 12, Issue 1, 2001, p. 51-70.
-
Paret T. F., Sasaki K. K., Eilbeck D. H., Freeman S. A. Approximate inelastic procedures to identify failure mechanisms from higher mode effects. Proceedings of the Eleventh World Conference on Earthquake Engineering, Vol. 2, 1996.
-
Sasaki K. K., Freeman S. A., Paret T. F. Multimode pushover procedure (MMP) – a method to identify the effects of higher modes in a pushover analysis. Proceedings of the 6th US National Conference on Earthquake Engineering, Seattle, Washington, 1998.
-
Chopra A. K., Goel R. K. A Modal Pushover Analysis Procedure to Estimate Seismic Demands for Buildings: Theory and Preliminary Evaluation. PEER Report 2001/03, Pacific Earthquake Engineering Research Center, Berkeley, 2001.
-
Bertero V. V. Strength and Deformation Capacities of Buildings under Extreme Environments. Structural Engineering and Structural Mechanics, Prentice Hall, Englewood Cliffs, NJ, 1977, p. 211-215.
-
Vamvatsikos D., Cornell C. A. Seismic Performance, Capacity and Reliability of Structures as Seen Through Incremental Dynamic Analysis. Department of Civil and Environmental Engineering, Stanford University, Report No. 151, 2005.
-
Shome N., Cornell C. A. Probabilistic Seismic Demand Analysis of Nonlinear Structures. Reliability of Marine Structures. Report No. RMS-35, Department of Civil and Environmental Engineering, Stanford University, 1999.
-
Mofid M., Zarfam P., Fard B. R. On the modal incremental dynamic analysis. The Structural Design of Tall and Special Buildings, Vol. 14, Issue 4, 2005, p. 315-329.
-
Zarfam P., Mofid M. Evaluation of modal incremental dynamic analysis, using input energy intensity and modified bilinear curve. The Structural Design of Tall and Special Buildings, Vol. 18, Issue 5, 2009, p. 573-586.
-
Zarfam P., Mofid M. On the modal incremental dynamic analysis of reinforced concrete structures, using a trilinear idealization model. Engineering Structures, Vol. 33, Issue 4, 2011, p. 1117-1122.
-
Azimi H., Galal K., Pekau O. A. Incremental modified pushover analysis. The Structural Design of Tall and Special Buildings, Vol. 18, Issue 8, 2009, p. 839-859.
-
Mortezaei A., Ronagh H. R., Kheyroddin A., Ghodrati Amiri G. Effectiveness of modified pushover analysis procedure for the estimation of seismic demands of buildings subjected to near-fault earthquakes having forward directivity. The Structural Design of Tall and Special Buildings, Vol. 20, Issue 6, 2011, p. 679-699.
-
Ghodrati Amiri G., Lahiji N. P., Darvishan E. Effects of in‐cycle strength degradation on collapse capacity of steel moment frames. The Structural Design of Tall and Special Buildings, Vol. 23, Issue 11, 2014, p. 801-813.
-
Goel R. K., Chopra A. K. Evaluation of modal and FEMA pushover analyses: SAC buildings. Earthquake Spectra, Vol. 20, Issue 1, 2004, p. 225-254.
-
International Building Code. International Code Council, Inc. (formerly BOCA, ICBO and SBCCI), Vol. 4051, No. 60478-5795, 2006.
-
http://nisee.berkeley.edu/data/strong_motion/sacsteel/ground_motions.html.
-
Chopra Anil K. Dynamics of Structures. Vol. 3, Prentice Hall, New Jersey, 1995.
-
Mazzoni S., Mckenna F., Scott M. H., Fenves G. L. OpenSees Command Language Manual. Pacific Earthquake Engineering Research (PEER) Center, 2006.
About this article

