Abstract
In order to investigate the characteristics of the water bottom and land vibration induced by underwater blasting, a water bottom vibrometer was developed and applied to a field measurement test to get actual vibration signals on land and water bottom. The characteristics of the vibration signals were studied in the time domain and frequency domain separately, and the influence of water medium on the land vibrations was specially analyzed by using the frequency order wavelet packets algorithm. It shows that the water bottom vibrometer could collect vibration signals effectively with stable performance. The signal analysis shows that in the same horizontal epic-distance of the same underwater blasting, the water bottom vibration has larger amplitude, higher main frequency and wider frequency band than the land vibration. The land vibration mainly consists of two components that in low frequency caused by direct blasting shock and high frequency caused by water oscillation impact. The water impact vibration components extracted from the land vibration by wavelet packets decomposition algorithm distribute more widely in time domain with earlier peak time than the blasting vibration components, and overlap staggered with each other.
1. Introduction
Nowadays, underwater drilling blasting techniques have been more and more widely applied in many defense and economic constructions. But like land blasting, underwater blasting also has many considerable influences on the surrounding environments, such as the blasting vibration. And the characteristics of underwater blasting and induced vibration are bound to be different from that of land blasting due to the influence of underwater environments, such as water mass, water-saturated sediments and rock mass[1, 2]. Current study of underwater blasting vibration mainly concentrates on the effects of land ground vibration and the response of structures [3-5]. Researches about water bottom vibration induced by underwater blasting are rarely reported, and the existing literatures mostly focused on theoretical analysis or predicted from land ground tests that need to be verified by actual water bottom measurements. However, there is a lack of proper water bottom instrumentations because of the much more difficulties of measuring in underwater than on land ground or structures. As to the influence of water medium, present literatures mostly concentrate on the measurements and analysis of water shock waves, acoustic action and bubble pulsation [6-10] but seldom make special analysis on the water impact vibration, because the water impact vibration is much weaker than the blasting vibration and can’t be collected alone. Therefore, they are very important and valuable to develop a proper instrumentation, to carry out actual measurements and collect water bottom vibrations induced by underwater blasting, and to investigate the characteristics of underwater blasting vibration and the influence of water medium with signal analysis for the improvement of practical project construction.
In this paper, a Water Bottom Vibrometer (WBV) and relevant testing procedure were developed [11] with the special consideration on the difficulties in underwater measurements, a field measurement test was carried out to get actual water bottom and land vibration signals in a underwater blasting engineering project. The characteristics of the water bottom and land vibrations were studied in the time domain and frequency domain separately, the influence of water medium on the land vibrations was specially analyzed by using frequency order wavelet packets algorithm, and obtained some valid results.
2. Development of WBV
Learned from the performance of existing common vibrometers for land blasting and consider the requirements of underwater blasting vibration measurements, an autonomous WBV was developed, as showed in Fig. 1. It mainly consists of guide rod, positioning block, head cover, interface module, seals, housing, power module, a central control module, transducer and base. After all modules assembled, the inside space would be filled with epoxy resin.
Fig. 1Structure diagram of water bottom vibrometer: 1 – guide rod, 2 – positioning block, 3 – head cover, 4 – seal ring, 5 – interface module, 6 – housing, 7 – power module, 8 – central control module, 9 – base, 10 – accelerator
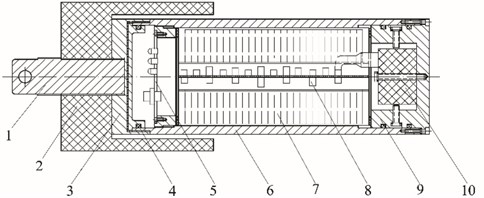
The shell surface was hardened to resist corrosion and oxidation. The cover and the housing are connected by screws and sealed with rubber gaskets and rings between the joint surfaces to guarantee fully waterproof effect. Positioning block is used to locate housing in underwater borehole to ensure the stance of vibrometer and there are several specifications could be selected according to the corresponding size of the drill diameter. Guide rod and positioning block are connected by a screw thread. There is an aperture on the guide rod tip to connect cables and floats. Interface module, consisted of connector panel, power switch, power charging port, network interface and status indicator lights, is used to interact between the internal system and external manipulation. Power source module, composed of rechargeable lithium cells connected in parallel, supplies power for the entire system up to 24 hours. In order to adapt to the minimum drill size used in general underwater blasting, the interior and exterior spaces occupied by instrument parts must be minimized. But general magnetic speed sensors’ volumes are relatively large, so a three-orientation ICP piezoelectric accelerator with relatively small size is used as the transducer module and is rigid fixed in the base with five stainless steel screws to receive rock vibrations. Central control module consists of several sub-modules, such as integral converter, signal conditioner, analog-to-digital (A/D) converter, microprocessor, parameter storage, data storage, data transmission, clock, temperature sensor and so on.
3. Water bottom vibration measurement test
Combined with the vibration monitoring project of underwater drilling blasting in Shanghai Yang Shan Port, a water bottom vibration testing trial was carried out. For comparison, a TC-4850-type land vibrometer developed by the Chengdu Branch of Chinese Academy of Sciences was used to measure land ground vibration simultaneously.
Underwater blasting region was 40 m distant from bank and had 23 blasting borehole totally in two rows, rows interval was 2.5 m, and boreholes step was 2 m, total charge was 765 kg. The maximum segment charge was 76.5 kg, bedrock borehole depth was 7.8 m, bore diameter was 0.165 m, charge length was 6.8 m, packing length was 1m.
According to the circumstance of local site, the TC-4850 land vibrometer was placed at land ground point north to the underwater blasting area, and the WBV was placed in a water bottom borehole west to the underwater blasting area. The sampling frequency of TC-4850 was 8 kHz and the trigger threshold was 0.03 cm/s. The sampling frequency of WBV was 8 kHz and the trigger threshold was 0.05 V (0.175 cm/s).
The horizontal distances of land and underwater measuring points away from the blasting area center were both 50 m. The vertical altitude from land measuring point to underwater blasting district was 15 m. The land point geology roughly included three layers: from top to bottom were gravel layer, macadam layer and rock mass layer. The water bottom geology roughly included three layers too: from top to bottom were 3 m thick silt layer, scattered macadam layer and rock mass. The water depth of underwater measuring point was 10 m, and the installation hole on bedrock was 0.5 m in depth and 0.165 m in diameter.
The axes of land and underwater measuring sensors both orientate radially to the epic-center, axes both orientate to tangential direction, and axes to vertical direction. So the axis of land sensor and the axis of WBV both parallel the east-west direction, and the axis of land sensor and the axis of WBV both parallel the south-north direction.
The WBV was placed in the drilling hole of bed rock and fixed by the positioning block and surrounding sediments and started up automatically at preset initial time before underwater blasting. When water bottom vibration amplitude reached the preset threshold, the WBV was triggered and start collecting underwater rock vibration signals. After underwater blasting, fetch the WBV back by float and rope, remove the surface mud and water stains, open the head cover, connect the data interface of WBV via dedicated data cable to PC and read data from interface software for subsequent analysis.
Fig. 2Measuring circumstance diagram: 1 – land measuring point, 2 – underwater blasting area, 3 – drilling boat, 4 – water bottom measuring point
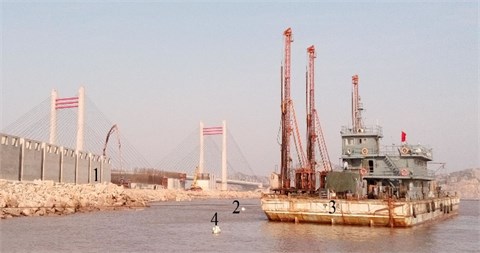
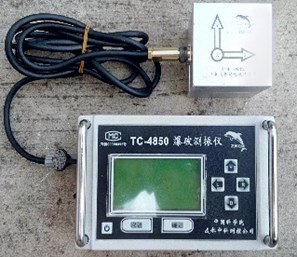
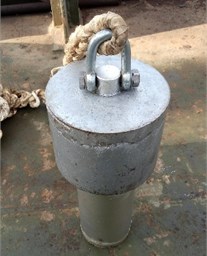
Fig. 3Land vibrometer and WBV
4. Testing results and signal analysis
Observed after fetching the WBV back, the instrument housing is intact without internal leakage and each module operates very well. By using the MATLAB software, the acquired vibration signals were analyzed in the time domain and frequency domain.
4.1. Blasting vibration signals and frequency spectrums
The waveforms and FFT spectrums of forepart 0 s-1.5 s water bottom vibrations are shown in Fig. 4. The peak velocity and the main frequency are shown in Table 1.
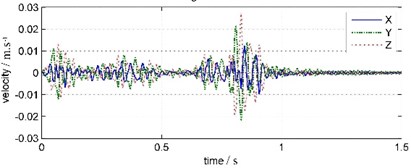
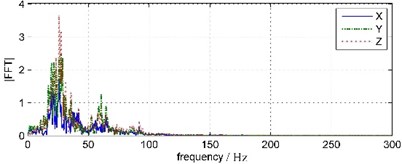
The waveforms and FFT spectrums of forepart 0 s-1.5 s land vibration signals are shown in Fig. 5. The peak velocity and the main frequency are shown in Table 2.
It is shown that the waveforms acquired from TC-4850 and WBV are very similar, but the peak velocity values and duration times are distinctly different. The vertical vibration peak amplitude attenuates 86.32 % from 20.21 cm/s of water bottom point to 2.76 cm/s of land point. The horizontal vibration peak amplitude attenuates 75.59 % from 4.40 cm/s to 1.25 cm/s in south-north orientation and 77.33 % from 9.66 cm/s to 2.19 cm/s in east-west orientation separately. The duration time of water bottom vibration is 0.9 s but that of the land vibration is almost 0.95 s. The time of peak amplitude also delays 0.2 s from water bottom point to land point.
Compared to land vibration, the main frequency of water bottom vibration is much higher and the frequency band also is wider. The water bottom vibration clocked frequency is between 35.64 Hz-46.88 Hz and the frequency band ranges below 200 Hz. The land vibration clocked frequency is between 25.88 Hz-27.34 Hz and the frequency band ranges below 100 Hz, and has a sub-frequency band around 60 Hz.
Table 1Peak velocity and main frequency (WBV)
No. | Channel | Orientation | Peak velocity | Main frequency |
1 | East-West | 9.66 cm/s | 35.64 Hz | |
2 | South-North | 4.40 cm/s | 46.88 Hz | |
3 | Vertical | 20.21 cm/s | 36.13 Hz |
Table 2Peak velocity and main frequency (TC-4850)
No. | Channel | Orientation | Peak velocity | Main frequency |
1 | South-North | 1.25 cm/s | 25.88 Hz | |
2 | East-West | 2.19 cm/s | 27.34 Hz | |
3 | Vertical | 2.76 cm/s | 25.88 Hz |
Fig. 4Water bottom vibration waveforms and spectrums (WBV)
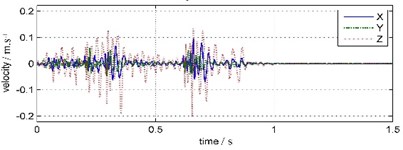
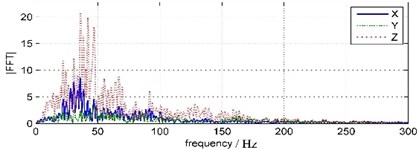
Fig. 5Land vibration waveforms and spectrums (TC-4850)
On the whole, water bottom vibration and land vibration both have maximum amplitude and simplest frequency components in vertical orientation, minimum amplitude and most complex frequency components north-south orientation. The shorter duration and wider frequency range of water bottom vibration indicate the impact vibration energy is relatively larger, the longer duration and narrower frequency band indicate the harmonic vibration energy is relatively larger.
4.2. Coda vibration signals and frequency spectrums
The biggest difference between underwater blasting and land blasting is the influence of water. In blasting segment, all vibration components overlap together and hard to distinguish. But in the coda segment after blasting, the vibration signals will mainly reflect the role of water medium.
The coda signals from 1.5 s to 4.5 s of water bottom and land vibrations are intercepted and analyzed with FFT, as showed in Fig. 6 and Fig. 7.
Fig. 6Water bottom coda vibration waveforms and FFT spectrums
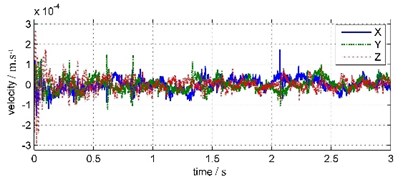
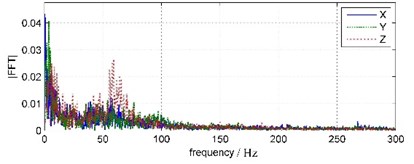
Fig. 7Land coda vibration waveforms and FFT spectrums
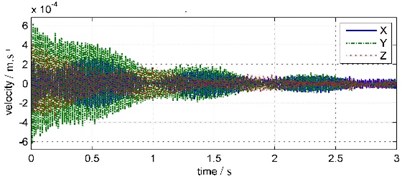
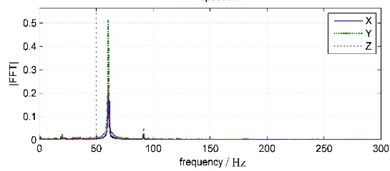
In Fig. 6, 1.5 seconds after the blast has ended, water bottom vibration amplitude has been very small and relatively stable, basically noise components. That is due to the WBV was placed inside the bedrock borehole under silt deposits 3 meters thick, so water vibration has been absorbed and attenuated by the deposited layer before reaching the WBV. In Fig. 7, land coda vibration amplitude is relatively larger, with longer duration and oscillated damping in about 1 s period. In land coda vibration signals, the vibration in east-west direction ( channel), which parallel to blast band, has maximum amplitude. The vibrations in vertical ( channel) and south-north ( channel) direction have relatively smaller amplitudes. The main frequency of south-north vibration is 61.65 Hz, and those of east-west and vertical vibrations are both 60.55 Hz.
According to the observation on site, after blasting vibration energy only comes from the continuing impact of water oscillation, that induced by water shock wave in blasting segment and explosive gases buoyant pulsating after blasting segment, on the slope and water bottom. In blasting segment, the water shock wave propagates in high speed and short duration, so the water oscillation generated by water shock wave from each borehole blasting within 1 s would inevitably overlap with each other. That means the oscillations vibration on land in around 1 s period should be aroused by the water oscillation effect from blasting shock waves. Then the vibration components around 60.55-64.45 Hz should originat from the water oscillation impact, that caused by explosive gases buoyant pulsating, on the slope and water bottom.
In the next parts, water impact vibration components will be extracted from land vibration signals and be analyzed in-depth by using the frequency order wavelet packets decomposition algorithm.
4.3. Water impact vibrations extraction with frequency order wavelet packets decomposition algorithm
4.3.1. Frequency order wavelet packets decomposition algorithm
The wavelet decomposition algorithm, in which only the low-frequency component in one scale would be decomposed into the next scale, has insufficient time-resolution in low-frequency components and insufficient frequency resolution in high-frequency components. However, the wavelet packets decomposition algorithm, which developed on the basis of wavelet decomposition algorithm, also decomposes high-frequency component from one scale into the next scale to realize equal bandwidth decomposition with better time-frequency resolution [12]. So the wavelet decomposition algorithm gets a lot of use in the analysis of the typical non-stationary vibration signals induced by engineering blasting [13-16].
In classical wavelet decomposition algorithm, the wavelet packets components are numbered by the natural order but not arranged in actual frequency band order, which brings some trouble into the accurate understanding on the time-frequency characteristics of signal decomposition. Some researchers theoretically analyzed the regularity and reasons of this frequency derangement and proposed some no-aliasing wavelet packets decomposition algorithms [17-20]. One of these algorithms is frequency shift method on the high-frequency component in each scale, as summarized below.
For discrete signal sequence , 1,…, , the recursion algorithm of classical wavelet packets decomposition is expressed as:
In which, and is a pair of orthogonal and conjugate low-pass and high-pass filters determined by wavelet function. In wavelet packets decomposition process, original signal will be decomposed into two equal bandwidth components in low-band and in high-band through respective low-pass and high-pass filter, and the low frequency and high frequency portions will be decomposed continually in the same way after downward resample, and so on.
With the increase if decomposition scale , the sampling frequency will be decreased with the proportion of . When the sampling frequency is lower than the Nyquist frequency, it will have a frequency aliasing and produce frequency band interleaving in the further decomposition. Due to the low-pass characteristic of filter and the high-pass characteristic of filter , the sequence obtained by only contains low frequency components and will not have frequency aliasing, but the sequence obtained by the only contains high frequency components and will bound to have frequency aliasing along with the increase of decomposition scale. So, if transfer the high frequency components to the lower frequency region by a frequency shift factor to ensure the highest frequency in high-frequency portion is less than the half of sampling frequency at each decomposition scale and reduce the sampling frequency to resample thereafter, the frequency aliasing can be avoided. Then an improved wavelet packets decomposition algorithm arranged in frequency order can be presented as below:
4.3.2. Land vibration signal frequency order wavelet packets decomposition
By using the frequency order wavelet packets decomposition algorithm, the land vibration signals will be decomposed with compactly supported ‘db5’ wavelet and to analyze in depth.
Fig. 8Original wavelet packets decomposition algorithm results
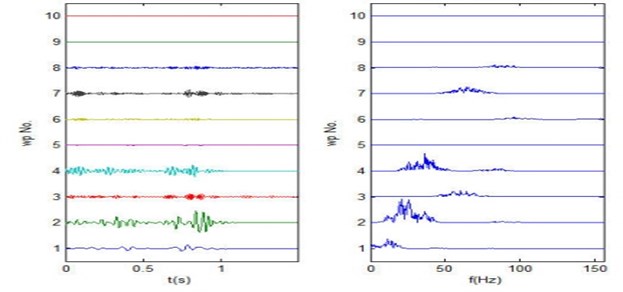
Fig. 9Frequency order wavelet packets decomposition algorithm results
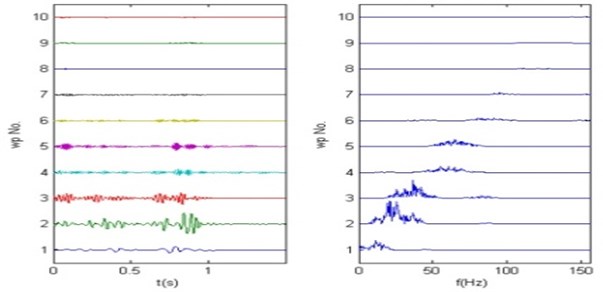
Since the main band of land vibration signals in three directions generally distributed in the frequency bands of 15 Hz-30 Hz, 30 Hz-45 Hz, 45 Hz-75 Hz, so for 6 layers decomposition there will have 64 packets with equal bandwidth of 15.625 Hz to justly separate the band components from each other. As the frequency of vibration signals mainly ranges in 0-150 Hz, the components above 150 Hz can be regarded as broadband noise. So only the wavelet packets from 1st to 10th are chosen to be analyzed. Fig. 8 and Fig. 9 respectively shows the results of original wavelet packets decomposition algorithm and frequency order wavelet packets decomposition algorithm on the land vibration signal in North-South direction. From bottom to top are the 1st to 10th wavelet packets sequences, from left to right are wavelet packets sequence waveforms and spectrums.
As shown in the results of two decomposition algorithms, the frequency bands of each wavelet packets sequence from original wavelet packets algorithm seems more messy, while the bands from frequency order wavelet packets decomposition algorithm entirely arranged from low to high frequency orderly and distinctly and shows better effects and advantages. The wavelet packets sequences of other vibration signals in the rest directions can be obtained with the same frequency order algorithm.
4.3.3. Land water-impact vibration extraction and analysis
The front analysis of coda vibration shows that there contain vibration components around 60.55-64.45 Hz, that caused by the water wave impact on slope and water bottom, in the land vibration signals. According to the order of the frequency bands division of wavelet packets sequences, 60.55-64.45 Hz vibration components are corresponding to the fourth and fifth wavelet packets. By extracting these two wavelet packets sequences, reconstructing them and the rest wavelet packets sequences separately, we can get corresponding vibration components caused by the water impact and by the direct blasting shock respectively. The waveforms and spectrums of the two components in three directions are shown in Fig. 10 and Fig. 11.
Fig. 10Land water-wave vibration waveforms and FFT spectrums
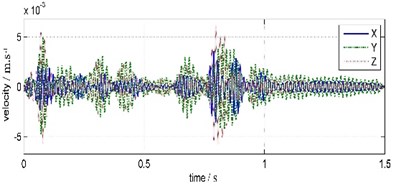
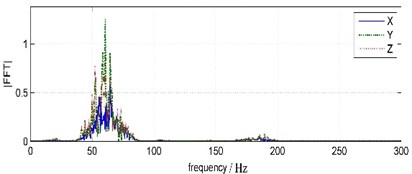
Fig. 11Land blasting vibration waveforms and FFT spectrums
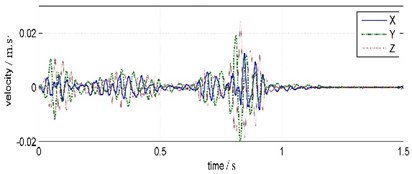
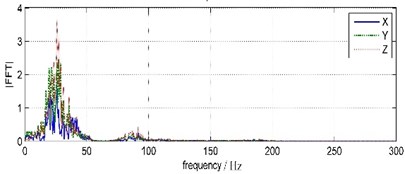
Table 3The characteristic values of land water-wave vibrations and blasting vibrations
Vibration component | Channel | Direction | Peak amplitude (m·s-1) | Peak time (s) | Main frequency (Hz) |
Water-wave vibrations | South-North | 0.003 | 0.798 | 64.45 | |
East-West | 0.004 | 0.825 | 60.55 | ||
Vertical | 0.006 | 0.798 | 60.55 | ||
Blasting vibrations | South-North | 0.013 | 0.846 | 25.88 | |
East-West | 0.020 | 0.829 | 27.34 | ||
Vertical | 0.024 | 0.831 | 25.88 | ||
Overlapped vibrations | South-North | 0.012 | 0.846 | 25.88 | |
East-West | 0.022 | 0.832 | 27.34 | ||
Vertical | 0.027 | 0.831 | 25.88 |
The characteristic values, such as peak amplitude, arriving time and main frequency, of land water-wave vibrations and blasting vibrations are shown in Table 3.
In terms of time, the land water-wave vibrations distributed over wide time domain. With reference to values between 0.5-1 s, the peak times of water-wave vibrations in three directions are 48 ms, 4 ms, 33 ms earlier than that of blasting vibrations and result in staggered overlapping in original vibrations.
Judging from the magnitude, the maximum peak amplitudes of water-wave vibrations, blasting vibrations and overlapped vibrations all lie in vertical direction and the minimum peak amplitudes lie in south-north direction. The sum of peak amplitudes of water-wave vibrations and blasting vibrations is greater than that of overlapped vibrations in every same direction. But the peak amplitude of overlapped vibrations is less than that of blasting vibrations in south-north direction, and is greater in the east-west and vertical direction. That means the vibration is weakened after overlapping in north-south direction and is enhanced in east-west and vertical direction.
From the frequency view, there are two main frequencies in every direction, but is mainly 64.45 Hz in north-south direction and 60.55 Hz in east-west and vertical direction.
5. Conclusions
In this paper, a water bottom vibrometer was developed according to the special environment of underwater blasting vibration measurement. A trial of land and water bottom vibration measurement test was carried out combined with actual underwater blasting engineering. By studying on the collected vibration signals in time and frequency domain, the similarities and differences of land and water bottom vibrations were analyzed. Water vibration components were extracted from land vibrations by using the frequency order wavelet packets decomposition and specially analyzed. Some conclusions can be presented as follows:
Firstly, due to the specific consideration of and designation for the difficulties in underwater measurements, the WBV worked reliably with stable performance, collected valid vibration signals, and can be applied to the water bottom vibration measurements in underwater blasting.
Secondly, in the same horizontal epic-distance of the same underwater blasting, the water bottom vibration has larger amplitude, higher main frequency and wider frequency band than the land vibration. The land vibrations mainly contains two components that in low frequency caused by the direct blasting shock with more energy and in high frequency caused by the water oscillation impact with less energy. Water oscillation vibration components show obvious in the coda signals of land vibrations, but show little in the coda signals of water bottom vibrations due to the isolation of thick sediments layer.
At last, the result of frequency order wavelet packets decomposition algorithm, with the consistence of wavelet packets sequence number and frequency band order, is much more regular than that of classical wavelet packets decomposition algorithm. The water compact vibration components, that extracted from land vibration signals by wavelet packets decomposition algorithm, distribute more widely in time domain with earlier peak time than and staggered overlap with the blasting vibration components, have slightly higher main-frequency in north-south direction and lower main-frequency in vertical direction.
References
-
Cole R. Underwater Explosions. Dover Publishing, New York, 1965.
-
Tong J. Y., Shi J. W., Xiong C. H., Zhang Z. Y. Study on the law of influence of underwater engineering blasting on environment (II). Blasting, Vol. 17, Issue 4, 2000, p. 1-4.
-
Zavalishin S. I., Shablinskii G. É. Investigation of dynamic characteristics of concrete dam by underwater blasts in the head race of the reservoir under field conditions. Power Technology and Engineering, Vol. 48, Issue 1, 2014, p. 17-22.
-
Madheswaran C. K., Sundaravadivelu R., Boominathan A., Natarajan K. Response of berthing structure due to underwater blasting for rock dredging. Experimental Techniques, Vol. 33, Issue 3, 2009, p. 61-72.
-
Zhong D. W. Seismic test and analysis of underwater drilling blasting for Taiziji Waterway. Journal of Wuhan University of Science and Technology, Vol. 34, Issue 5, 20112, p. 350-353.
-
Adushkin A. V., Burchik V. N., Goncharov A. I., Kulikov V. I., Khristoforov B. D., Tsykanovskii V. I. Seismic, hydroacoustic, and acoustic action of underwater explosions. Combustion, Explosion, and Shock Waves, Vol. 40, Issue 6, 2004, p. 707-713.
-
Gitterman Y. Near-Source audiovisual, hydroacoustic, and seismic observations of Dead Sea underwater explosions. Combustion, Explosion, and Shock Waves, Vol. 453, Issue 2, 2009, p. 218-229.
-
Si J. F., Zhong D. W., Li L. N. Experimental research on shock wave in water of underwater drilling blasting. Applied Mechanics and Materials, Vol. 193, Issue 194, 2012, p. 989-994.
-
Tong J. Y., Shi J. W., Xiong C. H., Zhang Z. Y. Study on the law of influence of underwater engineering blasting on environment (I). Blasting, Vol. 17, Issue 3, 2000, p. 6-7.
-
Pritchett J. W. An Evaluation of Various Theoretical Models for Underwater Explosion Bubble Pulsation. Report No. IRA-TR-2-71, Information Research Associates Inc., Berkeley, 1971.
-
Gu W. B., Wang Z. H., Chen J. H., et al. An Automatic Instrument for Water Bottom Vibration Collection in Underwater Blasting. Patent No.201410843437.1, China, 2014.
-
Mallat S. A theory for multi-resolution decomposition, the wavelet representation. IEEE Transactions on Pattern Analysis and Machine Intelligence, Vol. 11, Issue 7, 1989, p. 674-689.
-
Chen S. H., Wei H. X., Du R. Q. Multi-resolution wavelet analysis of blasting vibration signals. Rock and Soil Mechanics, Vol. S, 2009, p. 135-139.
-
Yan J. W., Long Y., Fang X., Zhou C. H., He W. Y. Time-frequency characteristics extracting and analysis of blasting seismic wave based on wavelet packet transformation. Journal of Vibration and Shock, Vol. 26, Issue 4, 2007, p. 251-29.
-
Ling T. H., Li X. B. Features of energy distribution of single deck blast vibration signals with wavelet packet analysis. Journal of Vibration and Shock, Vol. 26, Issue 5, 2007, p. 41-43.
-
Li X. H., Long Y., Ji C., Zhong M. S., Lu L. Influence of height difference based on wavelet packets transformation on blasting vibration signals. Journal of Vibration and Shock, Vol. 32, Issue 4, 2013, p. 44-47.
-
Geng Z. X., Qu L. S. Frequency shift algorithms of wavelet packet and vibration signal analysis. Journal of Vibration Engineering, Vol. 9, Issue 2, 1996, p. 145-152.
-
Fu Q. Y., Fu J. Y., Wang F. L. Wavelet packets algorithm without frequency band derangement. Journal of Vibration Engineering, Vol. 12, Issue 3, 1999, p. 423-428.
-
Ji Y. B. Frequency order of wavelet packet. Journal of Vibration and Shock, Vol. 24, Issue 3, 2005, p. 96-110.
-
Lin L. Y., Song J. C., Xie T. L. improved algorithm of wavelet packet frequency band retrieval and its application in motor fault diagnosis. Journal of Taiyuan University of Technology, Vol. 43, Issue 3, 2012, p. 391-395.
About this article

The WBV was developed in cooperation with Assoc. Prof. Wang Zhihua from Nanjing University of Science and Technology. The underwater blasting site was provided by the Blasting Services Division of Nanjing Institute of Engineering Corps and supported by the chief engineer Yang Zhixu. The authors are grateful to those persons and organizations for their invaluable help.
