Abstract
This study aims to produce a vertical dynamic load transformation model, of medium weight vehicles that burden the road structure, the form of suspension work characteristics on vehicle wheels that experience disturbances and vertical loading, and the relationship between vehicle vertical dynamic loads and road structure strength, in the form of a dimensionless parameter. The experiment was carried out at the Pneumatic and Hydraulics Laboratory of the State Polytechnic of Ujung Pandang using pneumatic actuators as a substitute for vehicle weight. The dynamic load fluctuation of the medium weight category vehicle is equivalent to a pressurized air setting from 1 bar to 6 bar which puts a direct load on the suspension system on the vehicle’s wheels. The deviation, (cm) that occurs when there is compression on the Spring and Shock Absorber can be measured using a distance sensor, while the vertical dynamic load, which burdens the road surface using a Load Cell. The data were analyzed using the vehicle dynamic load equation with pressure variable, (bar), spring constant, and damping fluid coefficient, . A mathematical study of the vibration characteristics of the vehicle suspension was obtained using the Mat Lab program. The results showed that the vibration characteristics of the vehicle body experienced an overshot at a deviation of is 0.534 m for 0.131 seconds. The role of the shock absorber in the suspension mechanism can reduce 26.43 % of the vertical dynamic load (N), and in the time interval, t is 3 seconds with acceleration deviation, is 0.25 m/s2 begins to feel comfortable. The relationship between vehicle dynamic load, and road structure strength, is 0.0178. The data from the comparative analysis is then recommended as a consideration for road construction planners to determine the strength and service life of the road.
1. Introduction
Comfort driving on the road is an important factor that must be experienced for passengers and drivers. The current state of affairs is almost all roads that are built, especially in the urban sector, are always damaged due to the dynamic load of vehicles which continues to increase significantly every time. The problem that occurs today is how to overcome the disturbance of driving comfort caused by damage to the road surface. Related to this problem, it is necessary to study the work of the suspension system and the dynamic load transformation of the weight of vehicles and passengers burdening the road surface. The aim of this research is to obtain comfort through the percentage of spring damping and shock absorber on the wheels and the magnitude of the effect of the vertical dynamic load of the vehicle being transformed to the road surface.
The level of comfort when driving according to [1] determined from the acceleration of deviation that occurs in an interval of time.
This research is expected to contribute to the application of the development of electro pneumatic control technology on suspension test equipment by utilizing a pneumatic actuator as a substitute for the weight of the passenger and vehicle body. Variations in the weight of light, medium and heavy vehicles that cross the road surface simultaneously and fluctuate will greatly affect the stability of the elastic foundation layer of the road to accepting the load. The occurrence of the vertical dynamic load of the vehicle according to [2], [3] begins with the loading mechanism by weight (sprung mass), and the weight of the axle (un sprung mass), on the suspension of each vehicle wheel. Several vibrations generated will affect the stability of the elastic foundation of the road in its path.
The target to be achieved is to form several formula models related to the magnitude of the vertical dynamic load of passing vehicles, determine the ability of the elastic foundation of the road, comfortable, and produce a ratio between the vertical dynamic load of vehicles and the stability of the elastic foundation strength of the inner road in the form of a dimensionless parameter.
2. Suspension system working mechanism
2.1. Suspension system on vehicle body and wheels
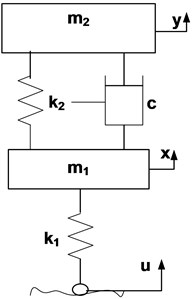
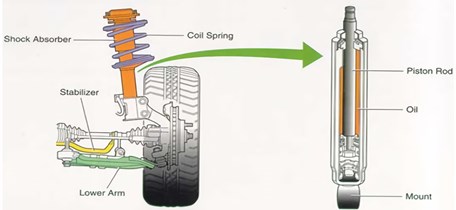
In general, the vehicle suspension system according to [4], [5] consists of a spring and a shock absorber arranged in parallel as shown in Fig. 1. The main function of this suspension is to support the weight of the vehicle, provide rider comfort to the road conditions, maintain wheel traction on the road surface, and maintain wheel alignment.
Fig. 1Mechanism of suspension system on vehicle wheels
a)
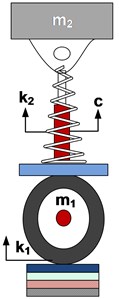
b)
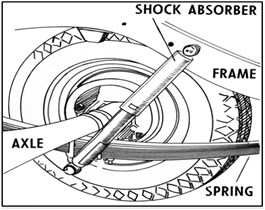
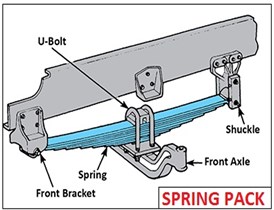
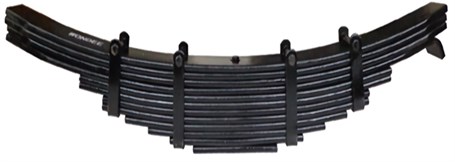
Fig. 2a) The main components of the heavy vehicle wheel suspension system, b) The position of the leaf spring on the wheel
a)
b)
The layout of the working mechanism of the suspension system on the wheels of heavy vehicles to withstand weight and load is as shown in Fig. 2.
Experiments that have been carried out by [6] using three types of leaf spring materials, namely Mild Steel, Kevlar and S2-Glass have stresses of 40,367 (N/mm2), 63,512 (N/mm2), and 71,634 (N/mm2), respectively. The magnitude of the deviations generated by the experiment for the three materials are 0.169732 (mm), 1.126 (mm), and 1.616 (mm).
2.2. Mathematical model
The non-linear mathematical equation of the suspension system on the vehicle wheels [7], [8] is formulated in Eq. (1) and Eq. (2).
The equation for the motion and the transfer function for the wheel, is:
The equation for the motion and the transfer function for the body, is:
By eliminating in Eq. (2), the transfer function of the suspension system to the vehicle body for a front wheel view with two degrees of freedom (2DOF) is obtained by comparing the output and input [9]:
If in Eq. (2) is eliminated and substituted into Eq. (1) then the equation of motion on the wheel axis is:
If on the wheel axis as output and road surface disturbance, as input, then Eq. (4) is simplified by [10] to become:
The magnitude of the values of , and is highly dependent on the axle weight and body weight of each type of vehicle. The values of these constants have been tested by [11], [4] with values of 4153 Ns/mm, = 40576.1 N/m, and = 32167 N/m. Based on Eqs. (3) and (5) will be obtained the magnitude of the output deviation that occurs in the body and wheel axis of the vehicle.
2.3. Effective vertical force
If the spring and the shock absorber are subjected to varying loads from pressure is 1 (bar) to 6 bar, there will be a compression of (mm) which varies as well [12]. The pneumatic cylinder piston compression force generated by air pressure (bar) is expressed on Eq. (6) as:
The magnitude of the effective vertical dynamic force by the pneumatic actuator which is equivalent to the gravity on the vehicle body Eq. (2) has been formulated by [5], [13], [14] namely:
If the dimensions of the cylinder used in the experiment are = 100 mm (0.100 m), then based on Eq. (7) the compressive force on the suspension mechanism is obtained by substituting the value of = 785× from Eq. (6) to Eq. (7) so that the equation is obtained:
If the spring constant (N/mm), deviation (m) and damping coefficient (Ns/mm) in Eq. (8) are determined, then the magnitude of the displacement velocity in the sprung mass, is:
If the spring and shock absorber are subjected to varying loadings from pressure is 1 (bar) to 6 bar on Eq. (9), there will be compression in the direction of compression as far as y (mm) which varies as well [15], [9].
2.4. Dimensionless parameters
A dimensionless parameter value in Eq. (10) according to [10], [16] is obtained from the comparison between the vehicle's vertical dynamic load stress (N) against the tire contact area (m2) with the road construction surface tension, (N) on the area, (m2) then the relationship is obtained:
If the tire width is 215 mm (0.215 m), the contact length is 14.5 cm (0.145 m), then the contact area is = 0.145×0.215 = 0.0312 (m2) and the area of the compression test on the road structure is 1 cm2 (10-4 m2).
The magnitude of the value is based on Eq. (7) while the value refers to the surface tension value of the asphalt-coated road previously carried out by [10][17] for Lataston material, the surface tension on the road is = 100 (kg/cm2) = 1×10⁷ (N/m2) = 1×10⁷ Pa = 10 MPa which is:
Several dynamic loads generated by vehicle loads are transferred to the pavement through the contact area between the tires and the road surface evenly. The relationship between the load from the vehicle and the type of pavement layer in Eq. (11) that is subjected to loading is described in Fig. 3. The layer that receives the largest dynamic load according to [18] is the surface course. The point of action of the vertical load (N) is distributed at an angle of 45° to the point of action of each force on the contact surface. The magnitude of the load will burden the road starting at the surface course, the base course, the sub base course and the subgrade.
Furthermore, [19], [20] explained that the surface layer must be strong to withstand all types of forces acting while the top and bottom layers of the foundation must be able to accept vertical loads and vibrations. At the bottom of the road layer, namely the subgrade, only gets vertical loads from vehicles.
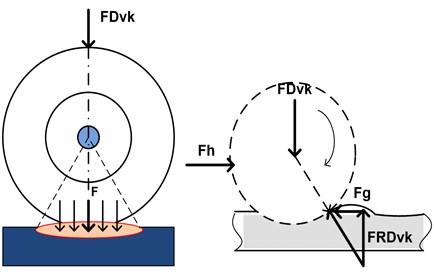
The dynamic load of the vehicle transferred through each axle which is formulated in Eq. (12) is shown in Fig. 4. The amount of pavement surface tension caused by standard vehicle wheels is in the range of 550 -700 kPa which is equivalent to (5.5-7) kg/cm2 with the coefficient of rolling friction between rubber tires and asphalt surface is 0.50 [3], [10].
The magnitude of the frictional force of the tires wheels rolling against the asphalt-covered road surface and the surface tension is:
Fig. 3Distribution of vertical dynamic load on flexible pavement layers: R1, R2= reaction force, L = contact area length, W = weight/cm, s = tire width, A = contact area = L×s, t= layer thickness
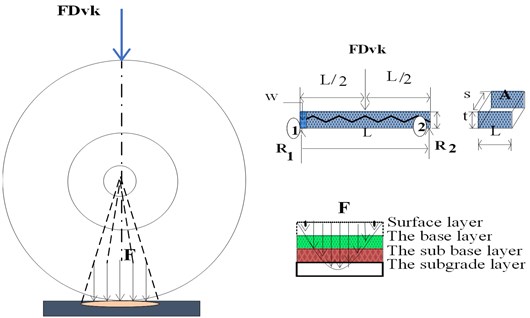
Fig. 4Dynamic load transfer and components of the acting forces
3. Experimental methods and design control
Medium weight category vehicle according to P.T. Astra International, 2014 has axle load (mass un sprung) = 480-600 kg and vehicle weight (mass sprung) = 1185-1990 kg. If an experiment is carried out on a quarter wheel of the vehicle, then the axle weight is determined, = 150 kg and the body weight = 416 kg. Based on the weights of and the total weight obtained is:
3.1. Experimental testing
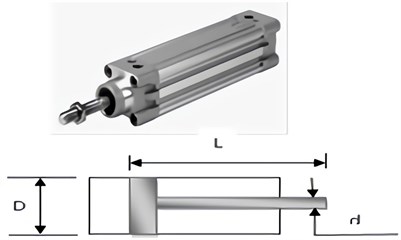
Experimentally, the loading of the pneumatic system on the road structure after going through the suspension mechanism was carried out by equilibrating the total body weight of the vehicle (kg) with the effective piston thrust, (N) of the cylinder at working pressure is 1 to 6 (bar). The pneumatic cylinder used as a dynamic load trigger for the vehicle wheel suspension is the type DNU – 100 – 300 – PPV-A with dimensions of piston diameter, is 100 mm, connecting rod diameter, is 50 mm and stroke length, is 300 mm.
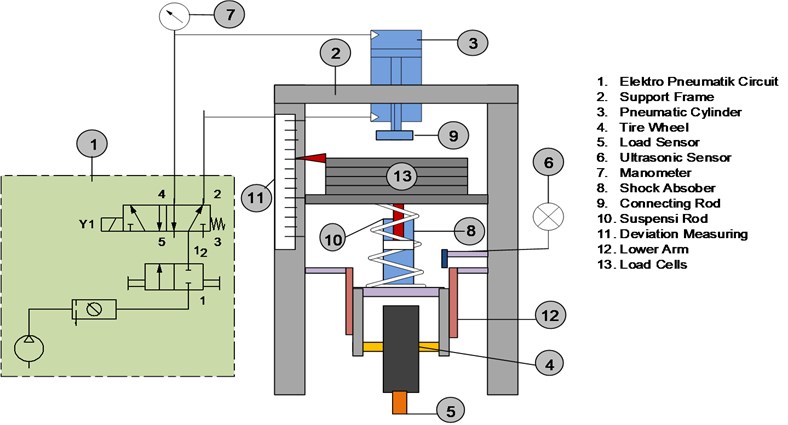
Several pressure gauges, control valves and test specimens used in this study are shown in Figs. 5(a), (b), and (c). The regulator equipped with a manometer is used to regulate the amount of working pressure entering the double-acting cylinder.
Fig. 5a) Pneumatic system dynamic load testing simulation tool, b) load cells, and c) pneumatic cylinders, symbols and dimensions
a)
b)
c)
Analysis of the shock absorber was carried out by using different springs. The research, which was conducted through experimental and mathematical methods, was supported by research instrumentation materials and tools, namely:
a) Optimization of the physical model, by [10] using a pneumatic cylinder of the Type, DNU-100-300-PVA (Fig. 5(c)), as a dynamic suspension simulator for the road surface layer with the following specifications:
Piston diameter, = 100 mm, Rare length, = 300 mm and Forward thrust, = 4496 N and reverse thrust = 4221 N at working pressure = 6 (bar), weight of piston, = 3.864 kg = 38.64 N, weight/10 mm of piston rod, = 0.090 kg/10 mm.
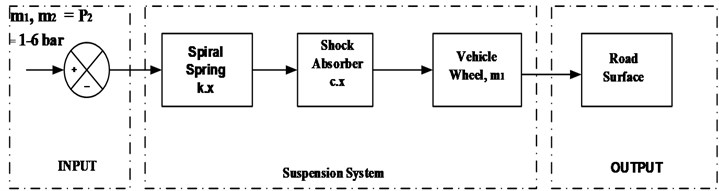
b) Optimization of the Mathematical model, using Mat-Lab operating programming with reference to Eq. (10) which outputs a suspension vibration graph on a quarter wheel vehicle. The block diagram for the optimization of the mathematical model of the suspension work shown in Fig. 7 is a stage of the experimental process that uses the vehicle body weight as the INPUT, which burdens the suspension work system consisting of spiral springs, shock absorbers, and wheels tires that are above the road surface as OUTPUT [7], [20], [21].
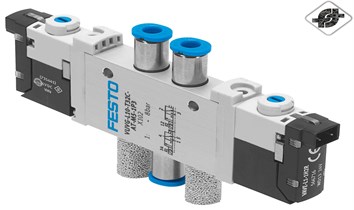
Fig. 6a) Electro pneumatic control, b) 5/2 Actuation solenoid valve and selection lever, c) shock absorber, d) suspension spring, and e) leaf spring
a)
b)
c)
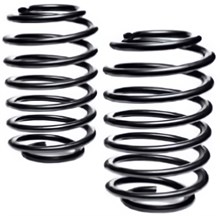
d)
e)
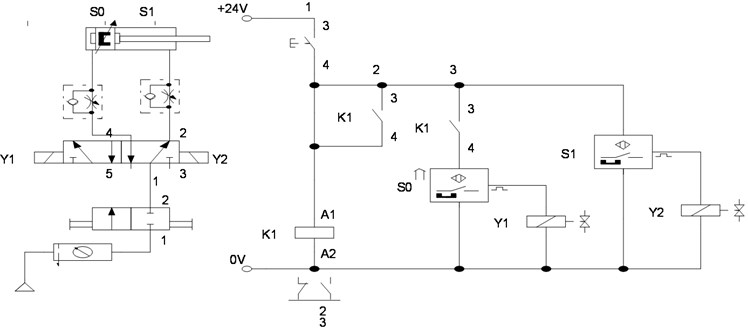
The mechanism for controlling the motion of the pneumatic actuator on the working mechanism of the suspension system on the vehicle wheels is stabilized using electro pneumatic control as shown in Fig. 6(a). If the solenoids and are energized when pressing the T button, the pneumatic cylinder will load the suspension in the down and up directions. The amount of the load can be adjusted by adjusting the air pressure on the regulator from 1 to 6 bar. Fig. 6(b), (c), (d), and (e) shows the 5/2 actuation solenoid valve control device, shock absorber and suspension spring and leaf spring respectively.
3.2. Motion control design
The control valve 5/2 which functions as a control valve for the direction of the piston movement is equipped with a solenoid actuation or mechanical lever which can be used at any time during the initial preparation of the experiment. For the development of digital control, according to [12], [22] the actuation of the lever can be replaced by a solenoid actuation which is actuated by electric power of 24 volts DC.
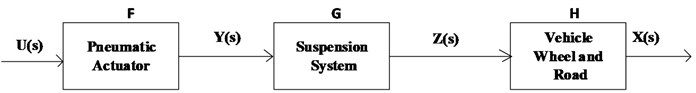
Fig. 7a) Mathematical model suspension work optimization, b) block diagram
a)
b)
The mathematical equation of the schematic diagram shown in Fig. 7(a) is simplified in the block diagram in Fig. 7(b) as follows:
where , , are the output signals from the axle, pneumatic actuator, and suspension system, respectively, while is a complex variable, whereas , , and are respectively a transfer function of the pneumatic actuator, suspension system, and axle, while is the input signal in the form of compressed air from the compressor.
If the actuator force 707 as in Eq. (8) whereas then based on Eq. (8) Eq. (14) is obtained as follows:
The transfer function equation in Eq. (13) is a combination of tiered transfer functions starting at the pneumatic actuator producing a force . The magnitude of the force will actuate the suspension system and the wheel axis so as to produce a fluctuating deviation. As a result of the fluctuating drift, it will also produce variations in vertical dynamic loads on the road surface, as shown in Eq. (14).
4. Results and discussion
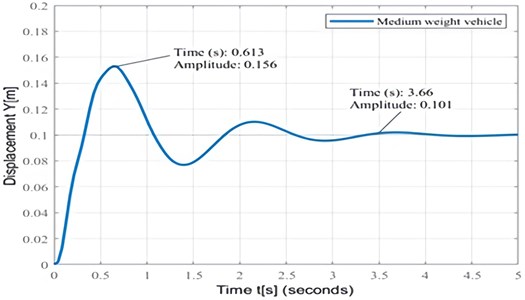
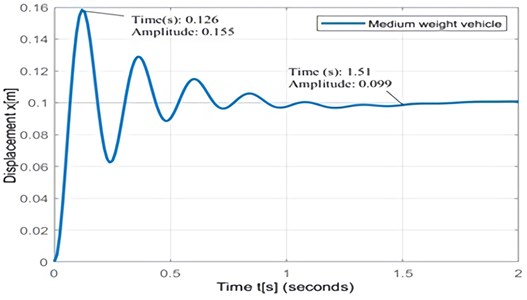
Programming with Mat-Lab software which refers to Eqs. (3) and (5) produces vibration characteristics on the body which are very dependent on the dimensions of the obstacles on the road surface. If the wheel of the vehicle is experiencing obstacles, as high as 10 cm or equal to 0.1 m is used as an INPUT in the program, then a graph of the vibration characteristics of the vehicle body is obtained as in Fig. 8(a) with an overshot amplitude of 0.156 m in 0.613 seconds. The characteristic of the largest deviation that occurs in the wheel with the tire after passing through an obstacle as high as = 0.1 m is to produce an amplitude of 0.155 m in a very short time of 0.126 seconds.
The overshot condition that occurs is caused by a sudden reaction in a very short time of 0.65 (s) to the suspension system beyond its stable state, 0.1 m. The magnitude of the overshot amplitude is obtained from the difference between the maximum deviation, 0.153 m and the steady state deviation, 0.1 m, which is 0.053 m. The overshot condition will disrupt the stability of the vehicle’s motion which has implications for driving discomfort.
4.1. Percentage of damping in suspension
The results of the above program execution produce vibration characteristics in the suspension as a result of dynamic loads that occur vertically. If given INPUT resistance, is 10 cm (0.1 m), then the suspension on the wheels will experience vibration with a maximum deviation, = 0.155 m with a vibration time of 0.126 s. Conditions started to stabilize at = 0.0995 m with a period of 1.6 (s). Previous researchers [20] obtained a proportional displacement of 0.12 m at the wheel of the vehicle which was measured as strain using a WIM sensor placed just below the tire. To optimize the damping that occurs in the suspension system, it can be done by comparing the damping force of the overshot condition, (N) to the dynamic load of the vehicle, (N). The magnitude of the opposing force that dampens during the overshot condition, is equal to:
The dynamic load of the vehicle, is 5660 N, which is obtained from the total weight of the axle of 150 kg (1500 N) and the weight of the vehicle body of 416 kg (4160 N). So the optimal damping percentage is:
4.2. Vibration characteristics
It should be noted that the comfort felt on the vehicle is often disturbed by the uneven shape of the road surface, defects with potholes, bumps and filled with mound-shaped materials and so on. Comfort can also be felt by passengers and drivers when the shock absorber (despot) dampening mechanism is able to absorb the energy from the vertical dynamic load of the vehicle properly. This is caused by the circulation of liquid or gas fluid which is determined by the arrangement of the flow control valve in the cylinder chamber.
The characteristic form of vibration on the wheel suspension of a medium weight vehicle as shown in Fig. 8(a), (b) caused by obstacles on the road surface as high as 0.1 (m) is a reaction to the total dynamic load of the vehicle which produces a maximum deviation (Overshot). Each of these conditions occurs in the body of 0.156 m with a vibration time of 0.613 s and on the wheel axis of 0.155 m with a vibration time of 0.126 s.
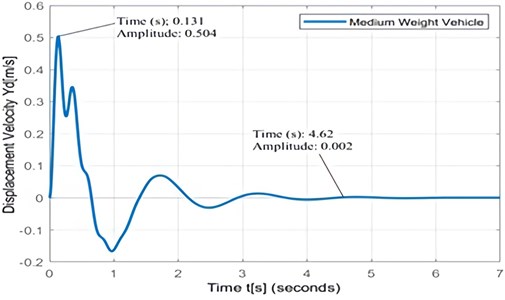
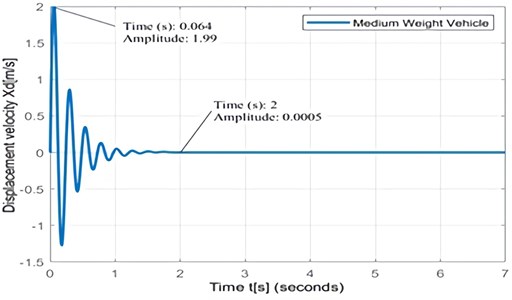
The characteristic form of the displacement velocity on the body and axle of the vehicle in Fig. 9(a) shows that moderate at is 0.534 m/s when is 0.131 s, and in Fig. 9(b), it occurs at is 2.03 (m/s), when is 0.0569 (s ), while the drift rate at the lowest body is 0.0015 m/s when the vibration time is 3.32 s and then at the wheel axis is 0.000547 m/s on a vibration time is 2.0 s. The magnitude of the relative displacement speed of the wheel axle with respect to the vehicle body in the medium weight category is: = (2.03-0.534)= 1.496 m/s.
The graph shows that the deviation speed is quite large due to a sudden shock to the wheel. This overshot condition cannot last long because of the opposing force from the spring and shock absorber. The magnitude of the opposing force that dampens the overshot condition can be calculated by: =1000 Ns/m×1.496 m/s = 1496 N.
Fig. 8a) Characteristics of deviation on the vehicle body, b) axle of vehicle with INPUT resistance, U is 0.1 m
a)
b)
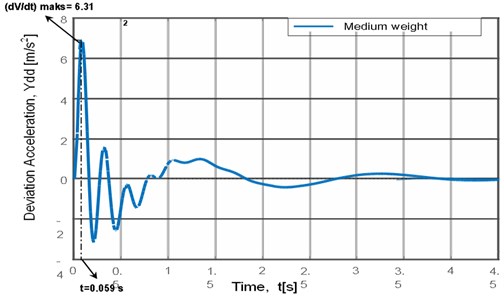
Fig. 10 shows a maximum displacement acceleration of 6.31 m/s2 when experiencing a short overshot for 0.059 s. Convenience is felt by the driver when experiencing an acceleration of deviation with an amplitude of 0.85 m/s2 in an interval of 1 s.
If the standard tire dimensions for a medium-weight vehicle are; width is 0.215 m, contact length, is 0.145 m, then the area of contact between the tire and the road surface is obtained, = 0.0312 m2.
The transformation of the vertical dynamic load of 5660 N to the surface contact area between the tire and the road is 177853 N/m2. If the standard strength of the road structure receives a vehicle dynamic load of = (10000) MPa = 1.0×10⁷ Pa = 1.0×10⁷ N/m2, then based on Eqs. (10) and (11) obtained the relationship between dynamic load transformation and road strength to withstand the load in the form of a dimensionless parameter of:
Fig. 9a) Characteristics of displacement velocity on the vehicle body with resistance U is 0.1 m; b) characteristics of speed deviation on the wheel axis of the vehicle ith resistance, U is 0.1 m
a)
b)
Fig. 10Deviation acceleration on the vehicle body
5. Conclusions
The vertical dynamic load transformation model that supports the road structure is obtained from the graph which is shown by the relationship between the deviations, each on the body of is 0.156 m, vibration time is 0.613 s and on the wheel axis of is 0.155 m, time vibrates is 0.126 s with the displacement speed of the wheel axis relative to the vehicle body is 1.496 m/s.
From the graph of the acceleration of the vibration displacement, which is obtained is 0.85 m/s2 in vibration time, is 1 second, indicating that the passengers and drivers do not feel comfortable driving, but in the time interval, is 3 seconds with acceleration deviation, is 0.25 m/s2 begins to feel comfortable.
The relationship between the vertical dynamic load of vehicles and the strength of the road structure is a contribution to the study of road strength which is expressed in the form of a dimensionless parameter of is 0.0178.
References
-
S. Ka’Ka, S. Himran, I. Renreng, and O. Sutresman, “Modeling of vertical dynamic vibration characteristics on vehicles suspension system,” in IOP Conference Series: Materials Science and Engineering, Vol. 619, No. 1, p. 012003, Oct. 2019, https://doi.org/10.1088/1757-899x/619/1/012003
-
X. Jiao, Y. Zhao, and W. Ma, “Nonlinear dynamic characteristics of a micro-vibration fluid viscous damper,” Nonlinear Dynamics, Vol. 92, No. 3, pp. 1167–1184, May 2018, https://doi.org/10.1007/s11071-018-4116-2
-
Ł. Szabłowski and J. Milewski, “Dynamic analysis of compressed air energy storage in the car,” Journal of Power Technologies, Vol. 91, No. 1, pp. 23–36, 2011.
-
W. S. Singh and N. Srilatha, “Design and analysis of shock absorber: a review,” Materials Today: Proceedings, Vol. 5, No. 2, pp. 4832–4837, 2018, https://doi.org/10.1016/j.matpr.2017.12.058
-
I. M. Ryabov, K. V. Chernyshov, and A. V. Pozdeev, “Energy analysis of vehicle suspension oscillation cycle,” Procedia Engineering, Vol. 150, pp. 384–392, 2016, https://doi.org/10.1016/j.proeng.2016.06.730
-
K. Viswanatham and H. Raghavendra Ra, “Optimization of heavy vehicle suspension system using composites,” IOSR Journal of Mechanical and Civil Engineering, Vol. 8, No. 4, pp. 13–19, 2013, https://doi.org/10.9790/1684-0841319
-
J. Zhang, P. Guo, J. Lin, and K. Wang, “A mathematical model for coupled vibration system of road vehicle and coupling effect analysis,” Applied Mathematical Modelling, Vol. 40, No. 2, pp. 1199–1217, Jan. 2016, https://doi.org/10.1016/j.apm.2015.07.012
-
K. Ogata, Modern Control Engineering. Tom Robbins, 1997.
-
R. Burdzik, “Novel method for research on exposure to nonlinear vibration transferred by suspension of vehicle,” International Journal of Non-Linear Mechanics, Vol. 91, pp. 170–180, May 2017, https://doi.org/10.1016/j.ijnonlinmec.2016.10.014
-
S. Ka’Ka, “Modeling of vehicle dynamic loads transformation on foundation structure of roads using pneumatics simulator,” Hasanuddin University, 2019.
-
G. R. Chavhan, S. W. Burande, and Dr. L. P. Dhole, “Analysis of shock absorber using different material of spring,” International Journal of Engineering and Advanced Technology, pp. 19–21, 2014.
-
M. Badr, L. Abdullah, and Engineer Ahmed Kadhiam Jaliel, “Position Control of the Pneumatic Actuator Employing O N / O FF Solenoids Valve,” International Journal of Mechanical and Mechatronics Engineering, Vol. 17, No. 2, pp. 29–37, 2017.
-
M. Lalanne, P. Berthia, J. Hagapian, F. C. Nelson, and H. Saunders, “Mechanical vibrations for engineers,” Journal of Vibration and Acoustics, Vol. 107, No. 3, pp. 353–354, Jul. 1985, https://doi.org/10.1115/1.3269271
-
“Heavy combination vehicle stability and dynamics: An introduction programme for drivers of heavy,” NZ Transport Agency, 2012.
-
S. Gopinath, R. J. Golden Renjith, and J. Dineshkumar, “Design and fabrication of magnetic shock absorber,” International Journal of Engineering and Technology, Vol. 3, No. 2, pp. 208–211, Apr. 2014, https://doi.org/10.14419/ijet.v3i2.1831
-
W. H. Tan, J. X. Cheah, C. K. Lam, E. A. Lim, H. G. Chuah, and C. Y. Khor, “Vibration analysis on compact car shock absorber,” Journal of Physics: Conference Series, Vol. 908, No. 1, p. 012025, Oct. 2017, https://doi.org/10.1088/1742-6596/908/1/012025
-
O. Ogah, “Effect of curing methods on the compressive strength of concrete,” International Journal of Engineering and Computer Science, Vol. 5, No. 2, pp. 6–20, Jul. 2016, https://doi.org/10.18535/ijecs/v5i7.09
-
S. Kannan, C. Selvamony, M. Ravikumar, and S. B. Gnanappa, “Investigations and study on the effect of Ar glass polymer fibres in self-compacting self-curing concrete,” Citeseer, Vol. 5, No. 2, pp. 41–45, 2010.
-
Y. Zhang, K. Guo, D. Wang, C. Chen, and X. Li, “Energy conversion mechanism and regenerative potential of vehicle suspensions,” Energy, Vol. 119, pp. 961–970, Jan. 2017, https://doi.org/10.1016/j.energy.2016.11.045
-
H. Trabelsi, P.-A. Yvars, J. Louati, and M. Haddar, “Interval computation and constraint propagation for the optimal design of a compression spring for a linear vehicle suspension system,” Mechanism and Machine Theory, Vol. 84, pp. 67–89, Feb. 2015, https://doi.org/10.1016/j.mechmachtheory.2014.09.013
-
I. V. Ryabov, V. V. Novikov, and A. V. Pozdeev, “Efficiency of shock absorber in vehicle suspension,” Procedia Engineering, Vol. 150, pp. 354–362, 2016, https://doi.org/10.1016/j.proeng.2016.06.721
-
S. S. G. Prede, Electropneumatics. Denkendors: Festo Didactic, 2000.
About this article

This research has received previous funding support from the Directorate of Research and Service of the Directorate General of Strengthening Research and Development of the Ministry of Research, Technology and Higher Education in accordance with Research Contract Number: 043/SP2H/LT/DRPM2018, March 26, 2018.
This research activity was carried out well with the support of Laboratory and Workshop facilities from the Ujung Pandang State Polytechnic Institution. Thoughts and suggestions from fellow research staff and students greatly supported the completion of this paper. For the support of all parties, the author would like to express his deepest gratitude.
The datasets generated during and/or analyzed during the current study are available from the corresponding author on reasonable request.
Conceptualization: Simon Ka’ka, Abram Tangkemanda; Funding acquisition: Simon Ka’ka, Daniel Kambuno, Abram Tangkmanda; Software: Simon Ka’ka, Daniel Kambuno; Supervision: Simon Ka’ka, Daniel Kambuno and Abram Tangkemanda; Writing-original draft: Simon Ka’ka; Writing-review and editing: Simon Ka’ka and Daniel Kambuno. All authors have read and agreed to the published version of the manuscript.
The authors declare that they have no conflict of interest.
